

Download - Amazon Web Services
Download - Amazon Web Services
Download - Amazon Web Services

You also want an ePaper? Increase the reach of your titles
YUMPU automatically turns print PDFs into web optimized ePapers that Google loves.
Vernier LabQuest 2 and Original LabQuest – Collect live data<br />
from LabQuest, retrieve existing data, or open saved fi les on<br />
LabQuest. Compatible with 78 different sensors.<br />
Vernier LabQuest Mini – Connect a LabQuest Mini and use<br />
68 different sensors.<br />
Vernier LabPro – Connect a LabPro to collect data with<br />
68 sensors.<br />
Go!Temp, Go! Link, and Go! Motion – Connect any of our Go!<br />
sensors and get advanced analysis tools in Logger Pro.<br />
Wireless Dynamics Sensor System – See real-time graphing of<br />
acceleration, force, and altitude data via wireless Bluetooth<br />
connection.<br />
Spectrometers – Collect data directly from Ocean Optics<br />
spectrometers and Vernier SpectroVis Plus.<br />
Graphical Analysis for iPad – View and analyze data streamed<br />
from Logger Pro to multiple iPad devices and auto-save data for<br />
later work.<br />
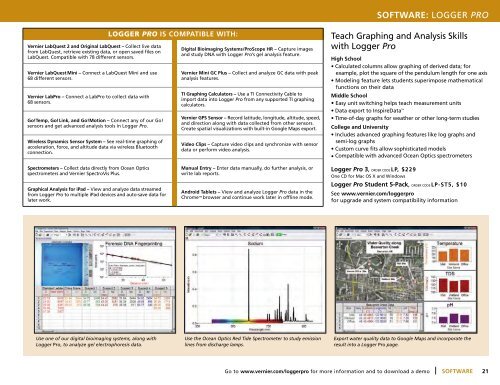
Use one of our digital bioimaging systems, along with<br />
Logger Pro, to analyze gel electrophoresis data.<br />
LOGGER PRO IS COMPATIBLE WITH:<br />
Digital Bioimaging Systems/ProScope HR – Capture images<br />
and study DNA with Logger Pro’s gel analysis feature.<br />
Vernier Mini GC Plus – Collect and analyze GC data with peak<br />
analysis features.<br />
TI Graphing Calculators – Use a TI Connectivity Cable to<br />
import data into Logger Pro from any supported TI graphing<br />
calculators.<br />
Vernier GPS Sensor – Record latitude, longitude, altitude, speed,<br />
and direction along with data collected from other sensors.<br />
Create spatial visualizations with built-in Google Maps export.<br />
Video Clips – Capture video clips and synchronize with sensor<br />
data or perform video analysis.<br />
Manual Entry – Enter data manually, do further analysis, or<br />
write lab reports.<br />
Android Tablets – View and analyze Logger Pro data in the<br />
Chrome browser and continue work later in offl ine mode.<br />
Use the Ocean Optics Red Tide Spectrometer to study emission<br />
lines from discharge lamps.<br />
SOFTWARE: LOGGER PRO<br />
Teach Graphing and Analysis Skills<br />
with Logger Pro<br />
High School<br />
• Calculated columns allow graphing of derived data; for<br />
example, plot the square of the pendulum length for one axis<br />
• Modeling feature lets students superimpose mathematical<br />
functions on their data<br />
Middle School<br />
• Easy unit switching helps teach measurement units<br />
• Data export to InspireData TM<br />
• Time-of-day graphs for weather or other long-term studies<br />
College and University<br />
• Includes advanced graphing features like log graphs and<br />
semi-log graphs<br />
• Custom curve fi ts allow sophisticated models<br />
• Compatible with advanced Ocean Optics spectrometers<br />
Logger Pro 3, ORDER CODE LP, $229<br />
One CD for Mac OS X and Windows<br />
Logger Pro Student 5-Pack, ORDER CODE LP-ST5, $10<br />
See www.vernier.com/loggerpro<br />
for upgrade and system compatibility information<br />
Export water quality data to Google Maps and incorporate the<br />
result into a Logger Pro page.<br />
Go to www.vernier.com/loggerpro for more information and to download a demo- |- SOFTWARE<br />
21