Vineyard surface in Germany - Vinum Bonum
Vineyard surface in Germany - Vinum Bonum
Vineyard surface in Germany - Vinum Bonum

Create successful ePaper yourself
Turn your PDF publications into a flip-book with our unique Google optimized e-Paper software.
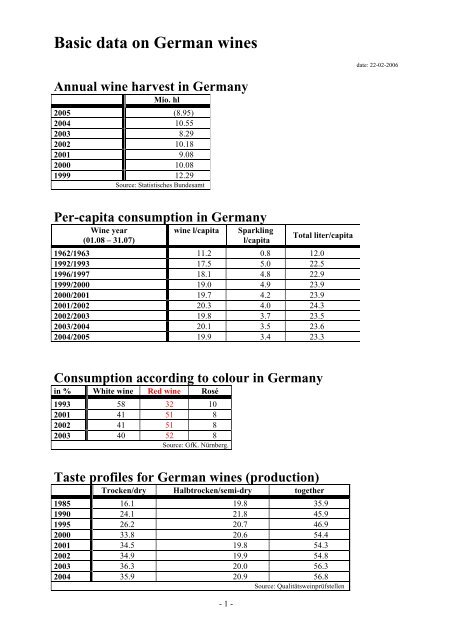
Basic data on German w<strong>in</strong>es<br />
Annual w<strong>in</strong>e harvest <strong>in</strong> <strong>Germany</strong><br />
Mio. hl<br />
2005 (8.95)<br />
2004 10.55<br />
2003 8.29<br />
2002 10.18<br />
2001 9.08<br />
2000 10.08<br />
1999 12.29<br />
Source: Statistisches Bundesamt<br />
Per-capita consumption <strong>in</strong> <strong>Germany</strong><br />
W<strong>in</strong>e year<br />
(01.08 – 31.07)<br />
w<strong>in</strong>e l/capita Sparkl<strong>in</strong>g<br />
l/capita<br />
- 1 -<br />
Total liter/capita<br />
1962/1963 11.2 0.8 12.0<br />
1992/1993 17.5 5.0 22.5<br />
1996/1997 18.1 4.8 22.9<br />
1999/2000 19.0 4.9 23.9<br />
2000/2001 19.7 4.2 23.9<br />
2001/2002 20.3 4.0 24.3<br />
2002/2003 19.8 3.7 23.5<br />
2003/2004 20.1 3.5 23.6<br />
2004/2005 19.9 3.4 23.3<br />
Consumption accord<strong>in</strong>g to colour <strong>in</strong> <strong>Germany</strong><br />
<strong>in</strong> % White w<strong>in</strong>e Red w<strong>in</strong>e Rosé<br />
1993 58 32 10<br />
2001 41 51 8<br />
2002 41 51 8<br />
2003 40 52 8<br />
Source: GfK. Nürnberg.<br />
Taste profiles for German w<strong>in</strong>es (production)<br />
Trocken/dry Halbtrocken/semi-dry together<br />
1985 16.1 19.8 35.9<br />
1990 24.1 21.8 45.9<br />
1995 26.2 20.7 46.9<br />
2000 33.8 20.6 54.4<br />
2001 34.5 19.8 54.3<br />
2002 34.9 19.9 54.8<br />
2003 36.3 20.0 56.3<br />
2004 35.9 20.9 56.8<br />
Source: Qualitätswe<strong>in</strong>prüfstellen<br />
date: 22-02-2006
Market share <strong>in</strong> <strong>Germany</strong> (volume)<br />
<strong>Germany</strong> France Italy Spa<strong>in</strong> New World<br />
1999 49.4 16.7 12.5 3.4 3.3<br />
2000 48.7 16.2 12.9 3.5 3.7<br />
2001 47.8 15.8 13.4 3.6 4.1<br />
2002 45.3 15.9 13.1 3.3 4.3<br />
2003 46.2 16.7 12.1 4.4 5.1<br />
Source: GfK. Nürnberg<br />
<strong>V<strong>in</strong>eyard</strong> <strong>surface</strong> <strong>in</strong> <strong>Germany</strong><br />
date: 2004 hektare %-share white <strong>in</strong> % red <strong>in</strong> %<br />
Rhe<strong>in</strong>hessen 26,177 25.6 68 32<br />
Pfalz 23,413 22.9 60 40<br />
Baden 15,977 15.6 57 43<br />
Württemberg 11,522 11.3 30 70<br />
Mosel-Saar-Ruwer 9,266 9.1 91 9<br />
Franken 6,051 5.9 83 17<br />
Nahe 4,145 4.1 75 25<br />
Rhe<strong>in</strong>gau 3,137 3.1 84 16<br />
Saale-Unstrut 654 0.6 75 25<br />
Ahr 538 0.5 12 88<br />
Mittelrhe<strong>in</strong> 472 0.5 86 14<br />
Hessische Bergstraße 441 0.4 82 18<br />
Sachsen 416 0.4 83 17<br />
total: 102,240 64 36<br />
<strong>V<strong>in</strong>eyard</strong> <strong>surface</strong> world wide (top 10)<br />
2003<br />
(<strong>in</strong> 1000 ha)<br />
Spa<strong>in</strong> 1,207<br />
France 900<br />
Italy 868<br />
Turkey 590<br />
USA 415<br />
Ch<strong>in</strong>a 412<br />
Iran 287<br />
Portugal 249<br />
Romania 239<br />
Argent<strong>in</strong>a 209<br />
Surface worldwide 7,890<br />
Source: Int. We<strong>in</strong>bauamt Paris<br />
Inkl. Tafeltrauben-Anbauflächen<br />
% of v<strong>in</strong>eyard-<strong>surface</strong> <strong>in</strong> <strong>Germany</strong> – white vs. red<br />
white (%) Red (%)<br />
1980 88.6 11.4<br />
- 2 -
1988 85.3 14.7<br />
1992 82.0 18.0<br />
1996 80.0 20.0<br />
2000 75.0 25.0<br />
2001 71.3 28.7<br />
2002 68.5 31.5<br />
2003 66.0 34.0<br />
2004 64.0 36.0<br />
The major grape-varieties <strong>in</strong> <strong>Germany</strong><br />
year 2004 hectare % of total v<strong>in</strong>eyard suface<br />
Riesl<strong>in</strong>g 20.627 20.2<br />
Müller-Thurgau (Rivaner) 14.983 14.7<br />
Spätburgunder 11.371 11.1<br />
Dornfelder 8.200 8.0<br />
Silvaner 5.578 5.5<br />
Kerner 4.606 4.5<br />
Portugieser 4.879 4.8<br />
Grauburgunder 3.786 3.7<br />
Weißburgunder 3.192 3.1<br />
Troll<strong>in</strong>ger 2.578 2.5<br />
Schwarzriesl<strong>in</strong>g 2.591 2.4<br />
Bacchus 2.320 2.3<br />
Regent 2.037 2.0<br />
Scheurebe 2.003 2.0<br />
Total white 65.389 64.0<br />
Total red 36.852 36.0<br />
Total <strong>surface</strong> 102.240 100<br />
Source: Statistisches Bundesamt<br />
V<strong>in</strong>e plant<strong>in</strong>gs 2003/2004<br />
hectares<br />
Regent 623<br />
Riesl<strong>in</strong>g 506<br />
Dornfelder 503<br />
Spätburgunder (p<strong>in</strong>ot noir) 470<br />
Grauburgunder (p<strong>in</strong>ot grigio) 445<br />
Müller-Thurgau 161<br />
Weißburgunder (p<strong>in</strong>ot blanc) 123<br />
Acolon 107<br />
Lemberger 82<br />
Portugieser 68<br />
Total white 1637<br />
Total red 2301<br />
Total new plant<strong>in</strong>gs 3938<br />
Number and v<strong>in</strong>eyard <strong>surface</strong> of w<strong>in</strong>eries<br />
hectares 1999 1989 1979<br />
Below 0.2 23.473 21.620 25.881<br />
- 3 -
0.2 to 0.5 17.156 20.365 24.780<br />
0.5 to 1 9.072 12.039 14.444<br />
1 to 2 6.298 9.220 11.276<br />
2 to 5 6.706 9.118 9.741<br />
5 and more 5.898 5.026 3.349<br />
Total 68.603 77.388 89.471<br />
Source: Statistisches Bundesamt<br />
Total comsumption of w<strong>in</strong>e<br />
2003<br />
(<strong>in</strong> Mio. hl)<br />
2001<br />
(<strong>in</strong> Mio. hl)<br />
France 32.9 33.9<br />
Italy 28.8 30.5<br />
USA 23.4 21.3<br />
<strong>Germany</strong> 20.1 20.0<br />
Spa<strong>in</strong> 13.5 13.8<br />
Argent<strong>in</strong>a 12.3 12.0<br />
Ch<strong>in</strong>a 11.0 ??<br />
Great Brita<strong>in</strong> 10.6 10.1<br />
Romania 5.1 ??<br />
Portugal 5.0 4.7<br />
World w<strong>in</strong>e consumption 229.2<br />
Source: Int. We<strong>in</strong>bauamt Paris<br />
W<strong>in</strong>e production world wide<br />
2003 (<strong>in</strong> Mio. hl)<br />
France 45.8<br />
Italy 43.0<br />
Spa<strong>in</strong> 40.4<br />
USA 20.4<br />
Argent<strong>in</strong>a 13.2<br />
Ch<strong>in</strong>a 11.2<br />
Australia 10.8<br />
South Africa 8.9<br />
<strong>Germany</strong> 8.2<br />
Portugal 7.1<br />
World w<strong>in</strong>e procuction 260.9<br />
Source: Int. We<strong>in</strong>bauamt Paris<br />
W<strong>in</strong>e exports world wide<br />
2003 (<strong>in</strong> Mio. hl)<br />
France 15.0<br />
Italiy 13.3<br />
Spa<strong>in</strong> 12.3<br />
Australia 5.4<br />
Chile 4.0<br />
USA 3.3<br />
Portugal 3.1<br />
<strong>Germany</strong> 2.5<br />
South Africa 2.4<br />
Argent<strong>in</strong>a 1.9<br />
- 4 -<br />
Deutsches We<strong>in</strong><strong>in</strong>stitut, Export Market<strong>in</strong>g<br />
Postfach 1660, 55006 Ma<strong>in</strong>z<br />
Steffen Sch<strong>in</strong>dler, tel. +49-6131-2829-44<br />
Fax: +49-6131-2829-20<br />
steffen.sch<strong>in</strong>dler@dwi-dwf.de<br />
www.deutschewe<strong>in</strong>e.de<br />
www.germanw<strong>in</strong>es.de
Exports world wide 72.0<br />
Source: Int. We<strong>in</strong>bauamt Paris<br />
German w<strong>in</strong>e exports<br />
2005 Value <strong>in</strong> 1,000 € Volume <strong>in</strong> hl €/hl +/- value<br />
2004/2005<br />
United K<strong>in</strong>gdom 126,827 897,487 141 + 0.7<br />
USA 77,809 248,826 313 + 20.6<br />
Netherlands 58,716 407,193 144 + 20.2<br />
Japan 22,409 61,837 362 + 1.0<br />
Sweden 22,391 179,824 125 + 15.1<br />
France 19,292 109,083 177 + 8.7<br />
Norway 16,727 72,994 229 + 28.5<br />
Austria 12,649 38,916 325 - 8,5<br />
Belgium / Lux. 11,563 75,966 152 + 20.6<br />
Denmark 11,009 76,185 145 + 24.5<br />
Russia 10,643 62,033 172 + 48.8<br />
Canada 10,247 40,665 252 - 3.2<br />
Ireland 8,636 44,764 193 - 10.7<br />
Switzerland 8,187 17,546 467 - 19.4<br />
Poland 7,929 56,485 140 + 10.8<br />
F<strong>in</strong>land 6,398 39,207 163 + 16.8<br />
Czech Republic 6,114 39,144 156 + 39.7<br />
Italy 3,815 24,508 156 + 22.7<br />
Mexico 3,283 17,632 186 + 4.0<br />
Estonia 2,126 13,444 158 + 1.3<br />
SUMME 474,647 2,645,021 179 + 9.9<br />
- 5 -