(DRAFT FOR REVIEW) - Global Forest Watch Canada
(DRAFT FOR REVIEW) - Global Forest Watch Canada
(DRAFT FOR REVIEW) - Global Forest Watch Canada

You also want an ePaper? Increase the reach of your titles
YUMPU automatically turns print PDFs into web optimized ePapers that Google loves.
A <strong>Global</strong> A <strong>Global</strong> <strong>Forest</strong> <strong>Forest</strong> <strong>Watch</strong> <strong>Canada</strong> Report<br />
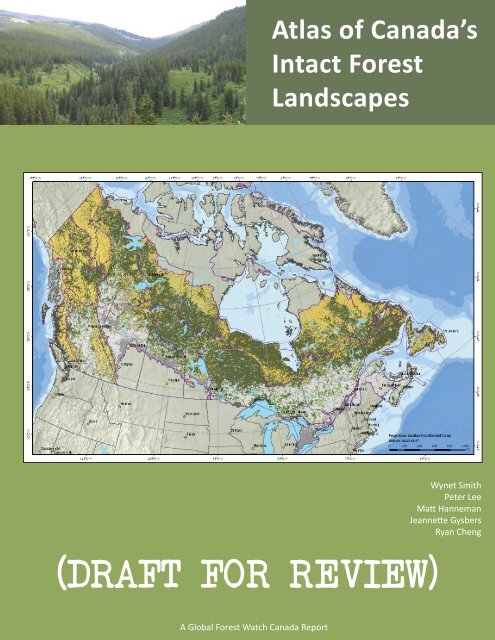
Atlas of <strong>Canada</strong>’s<br />
Intact <strong>Forest</strong><br />
Landscapes<br />
(<strong>DRAFT</strong> <strong>FOR</strong> <strong>REVIEW</strong>)<br />
Wynet Smith<br />
Peter Lee<br />
Matt Hanneman<br />
Jeannette Gysbers<br />
Ryan Cheng
Atlas of <strong>Canada</strong>’s Intact<br />
<strong>Forest</strong> Landscapes<br />
By:<br />
Wynet Smith<br />
Peter Lee<br />
Matthew Hanneman<br />
Jeannette Gysbers<br />
Ryan Cheng<br />
Edmonton, Alberta, <strong>Canada</strong><br />
ISBN: ___<br />
©<strong>Global</strong> <strong>Forest</strong> <strong>Watch</strong> <strong>Canada</strong>, 2009<br />
Cover Design: Matt Hanneman, Peter Lee, Jeannette Gysbers<br />
Report Design and Layout: Jeannette Gysbers<br />
Map Design and Layout: Matt Hanneman<br />
Photos: All photos by <strong>Global</strong> <strong>Forest</strong> <strong>Watch</strong> <strong>Canada</strong>, unless otherwise noted<br />
Citation: Smith W, Lee PG, Hanneman M, Gysbers JD, Cheng R. 2009. Atlas of<br />
<strong>Canada</strong>’s Intact <strong>Forest</strong> Landscapes. Edmonton, Alberta: <strong>Global</strong> <strong>Forest</strong> <strong>Watch</strong><br />
<strong>Canada</strong>. 88 pp.
Dragonfly on maple leaves, Killarney Provincial Park, ON (06/2005)<br />
<strong>Canada</strong>’s forests are, for the most part, publicly owned.<br />
Canadians want to know about the state of the country’s<br />
forests. The Canadian Council of <strong>Forest</strong> Ministers<br />
recently reported that “Canadians are demanding more<br />
information, more options, more involvement in decision<br />
making, and more equitable sharing of benefits,” and that<br />
“policy makers, decision makers, and the public need tools<br />
to define and measure progress toward sustainable forest<br />
management.” The public expects open and transparent<br />
decision-making with respect to forest resources as well<br />
as an ability to participate in decisions being made about<br />
resource use. The demands for more information on<br />
forests in <strong>Canada</strong> indicate the general recognition of a<br />
growing need for a broad range of data on forests to<br />
improve forest policy and decision-making.<br />
Sustainable forest management, a policy priority of<br />
Canadian governments and the forest industry, is<br />
information-intensive and requires a broad range of<br />
timely, up-to-date information for landscape planning and<br />
management and for better monitoring, reporting, and<br />
verification. Sustainable forest management requires data<br />
Natural Resources <strong>Canada</strong>. 00 . The state of <strong>Canada</strong>’s forests<br />
00 – 00 : <strong>Forest</strong> industry competitiveness. Natural Resources <strong>Canada</strong>,<br />
Canadian <strong>Forest</strong> Service, Ottawa. 79 pp.<br />
Canadian Council of <strong>Forest</strong> Ministers (CCFM). 00 . Criteria and<br />
indicators of sustainable forest management in <strong>Canada</strong>: national status<br />
00 . Natural Resources <strong>Canada</strong>, Canadian <strong>Forest</strong> Service, Ottawa.<br />
Wang S. 00 . Managing <strong>Canada</strong>’s forests under a new social contract.<br />
The <strong>Forest</strong>ry Chronicle 8 : 8 – 90.<br />
World Commission on <strong>Forest</strong>s and Sustainable Development. 9.<br />
Our forests, our future. Cambridge UK: Cambridge University Press.<br />
0 pp.<br />
Siry JP, Cubbage FW, Ahmed MR. 00 . Sustainable forest management:<br />
global trends and opportunities. <strong>Forest</strong> Policy and Economics<br />
7: – .<br />
Hickey GM, Innes JL, Kozak RA, Bull GQ, Vertinsky I. 00 .<br />
Monitoring and information reporting for sustainable forest management:<br />
an inter-jurisdictional comparison of soft law standards. <strong>Forest</strong><br />
Policy and Economics 9: 97– .<br />
Preface<br />
that extend beyond the scope of traditional government<br />
forestry departments and across the boundaries of<br />
provincial and territorial jurisdictions. An expanded<br />
information base requires a stakeholder approach and<br />
institutional reforms to facilitate partnerships7 and genuine<br />
collaboration8 amongst a range of actors, including<br />
9 0<br />
industry, government and researchers.<br />
Unfortunately, <strong>Canada</strong>’s ability to meet concerns and<br />
respond to commitments has often been hampered by<br />
outdated forest inventories and information systems.<br />
Dr. Richard R. Schneider pointed out in his 00 book on<br />
Alberta’s forests, Alternative Futures: Alberta’s Boreal <strong>Forest</strong>s<br />
at the Crossroads, “the public has had remarkably little<br />
access to information about these forests. Moreover, the<br />
information that does get widely disseminated comes from<br />
government and industry sources that generally convey<br />
the message that all is well.” There has also often been<br />
jurisdictional differences with regards to the availability<br />
of information about Canadian forests. Fortunately, data<br />
availability has recently improved, <strong>Global</strong> <strong>Forest</strong> <strong>Watch</strong><br />
<strong>Canada</strong> has been a contributor to this improvement in<br />
forest information.<br />
For the past decade, <strong>Global</strong> <strong>Forest</strong> <strong>Watch</strong> <strong>Canada</strong> has<br />
worked to compile existing data and to also create new<br />
data on the state of <strong>Canada</strong>’s forests to contribute to more<br />
sustainable forest management. We have created this atlas<br />
on <strong>Canada</strong>’s intact forest landscapes using data we have<br />
generated along with other available data and information.<br />
It is part of our national series of projects focused on<br />
intact forest landscapes and anthropogenic changes to our<br />
important forest ecosystems.<br />
7 Wang S. 00 . Managing <strong>Canada</strong>’s forests under a new social contract.<br />
The <strong>Forest</strong>ry Chronicle 8 : 8 – 90.<br />
8 Wang S. 00 . Wicked problems and metaforestry: is the era of<br />
management over? The <strong>Forest</strong>ry Chronicle 78: 0 – 0.<br />
9 Yamasaki SH, Kneeshaw DD, Munson AD, Dorion F. 00 .<br />
Bridging boundaries among disciplines and institutions for effective<br />
implementation of criteria and indicators. The <strong>Forest</strong>ry Chronicle<br />
78: 87– 9 .<br />
0 Hickey GM. 00 . Regulatory approaches to monitoring sustainable<br />
forest management. International <strong>Forest</strong>ry Review :89–98.<br />
Gillis M, Omule AY, Brierly T. 00 . Monitoring <strong>Canada</strong>’s forests:<br />
the national forest inventory. The <strong>Forest</strong>ry Chronicle 8 : – .<br />
Schneider RR. 00 . Alternative Futures: Alberta’s Boreal <strong>Forest</strong>s<br />
at the Crossroads. Edmonton AB: Alberta Centre for Boreal Research.<br />
pp.<br />
13 Smith W, Lee P. 2007. <strong>Global</strong> <strong>Forest</strong> <strong>Watch</strong> <strong>Canada</strong>: influencing<br />
forest policy with information. The <strong>Forest</strong>ry Chronicle 8 : 8 - 88.
<strong>Canada</strong>’s federal, provincial and territorial governments<br />
and industry hold more detailed data and information,<br />
but many key datasets are not made readily available<br />
to the public for proprietary reasons as well as other<br />
considerations. <strong>Global</strong> <strong>Forest</strong> <strong>Watch</strong> <strong>Canada</strong>’s focus on<br />
using satellite imagery that is freely available from the<br />
National Aeronautics and Space Administration (NASA),<br />
Natural Resources <strong>Canada</strong> and other sources, allowed us to<br />
create consistent data (albeit at a coarse resolution), which<br />
has enabled us to map and evaluate intact forest landscapes<br />
and recent anthropogenic changes to <strong>Canada</strong>’s forest<br />
ecozones.<br />
Our atlas focuses on <strong>Canada</strong>’s last intact forest landscapes<br />
and examines some of their key conservation values,<br />
as well as key indicators of threats to their future<br />
conservation.<br />
<strong>Global</strong> <strong>Forest</strong> <strong>Watch</strong> <strong>Canada</strong> has created this atlas to assist<br />
Canadians in their efforts to sustainably manage their<br />
important forest resources.<br />
Red Squirrel (Tamiasciurus hudsonicus), Liard River Hotsprings<br />
Provincial Park, BC (08/2006)
This project, and many of its data components, was funded<br />
by the Ivey Foundation, Limited Brands, Alberta Ecotrust,<br />
the EJLB Foundation, the International Boreal Conservation<br />
Campaign (through a contract with the Boreal Songbird<br />
Initiative), the Canadian Boreal Initiative, the Conservation<br />
Biology Institute, and an anonymous donor. Their<br />
support is gratefully acknowledged. In addition: through a<br />
contract with Environment <strong>Canada</strong>, we were able to map<br />
recent anthropogenic disturbances within large regions of<br />
woodland caribou range; and, through a contract with the<br />
International Institute for Sustainable Development, we<br />
were able to collect and analyze a variety of data.<br />
We thank the 00+ reviewers from across <strong>Canada</strong> who<br />
have provided comments on our intact forest landscape<br />
mapping, on our anthropogenic change mapping and on<br />
our recently published Atlas of Alberta (Parts I and II).<br />
These individuals, organizations and agencies are specifically<br />
acknowledged in the relevant publications available at<br />
www.globalforestwatch.ca.<br />
Acknowledgements<br />
We thank those whose valuable feedback and information<br />
contributed to improvements made during the development<br />
of this specific project:<br />
Anita De Wolfe, Francisca Olaya, David Bruinsma, Sina<br />
Sultani, and Robert Boraas provided assistance with analyzing<br />
satellite imagery for disturbances.<br />
Dr. Justina Ray (Wildlife Conservation Society <strong>Canada</strong>)<br />
provided much valuable advice and guidance throughout<br />
the preparation of this atlas. Dr. Fiona Schmiegelow, Dr.<br />
Charles Drever and Aran O’Carroll provided strategic<br />
advice. We are very grateful to the federal, provincial and<br />
territorial governments who made geospatial data available.<br />
The authors thank the suppliers of satellite and other imagery.<br />
The Landsat satellite images used in this work were<br />
obtained from NASA, the <strong>Global</strong> Land Cover Facility at<br />
the University of Maryland, Geogratis (Natural Resources<br />
<strong>Canada</strong>), Dr. Don Leckie (Pacific <strong>Forest</strong>ry Centre), and<br />
Landsat.org
1. Introduction ... 1<br />
Table of Contents<br />
Mapping <strong>Canada</strong>’s Changing Intact <strong>Forest</strong> Landscape ... 1<br />
The importance of intact forest landscapes ... 2<br />
Technical notes on GFWC’s intact forest landscapes methodology and data ... 4<br />
Purpose and Structure of the Atlas ... 5<br />
2. Intact forest landscapes ... 6<br />
Overview ... 6<br />
Tree cover ... 8<br />
Regional analyses ... 10<br />
Ecozone analysis ... 10<br />
Provincial and territorial analysis ... 10<br />
Aboriginal treaties and settled land claims analysis ... 26<br />
Cumulative access in <strong>Canada</strong>’s forest ecozones ... 29<br />
Recent anthropogenic changes to <strong>Canada</strong>’s forest landscapes (1990-2001) ... 32<br />
Fragmentation as a result of recent anthropogenic change ... 36<br />
Recent anthropogenic changes (1990-2001) adjacent to intact forest landscape fragments ... 39<br />
3. The best of what’s left ... 41<br />
Soil organic carbon ... 42<br />
Net biome productivity ... 44<br />
Wetlands ... 46<br />
Lakes and rivers ... 48<br />
Potential old growth ... 50<br />
Species diversity ... 52<br />
Reptile and amphibian species ranges ... 52<br />
Bird species ranges ... 54<br />
Mammal species ranges ... 56<br />
Tree species ranges ... 58<br />
Woodland caribou ... 60<br />
Where is the best of what’s left? ... 62<br />
Protected areas ... 66<br />
4. Conclusion ... 69<br />
Glossary ... 70<br />
Appendix 1. Who is GFWC? ... 73<br />
Appendix 2. Methods ... 74<br />
A. Intact forest landscapes ... 74<br />
B. Cumulative access and recent anthropogenic change ... 76<br />
Appendix 3. Data ... 77<br />
A. List of Landsat images used in intact forest landscape mapping ... 77<br />
B. List of species (reptiles and amphibians, mammals, and birds) used in species diversity analysis ... 82
List of Maps<br />
Map 1. <strong>Forest</strong> Ecozones of <strong>Canada</strong> ... 3<br />
Map 2. Intact <strong>Forest</strong> Landscapes of <strong>Canada</strong> ... 7<br />
Map 3. Tree Cover of <strong>Canada</strong> ... 8<br />
Map 4. Intact <strong>Forest</strong> Landscapes of <strong>Canada</strong>: Regional Map Index ... 12<br />
Map Sheet I ... 13<br />
Map Sheet II ... 14<br />
Map Sheet III ... 15<br />
Map Sheet IV ... 16<br />
Map Sheet V ... 17<br />
Map Sheet VI ... 18<br />
Map Sheet VII ... 19<br />
Map Sheet VIII ... 20<br />
Map Sheet IX ... 21<br />
Map Sheet X ... 22<br />
Map Sheet XI ... 23<br />
Map Sheet XII ... 24<br />
Map Sheet XIII ... 25<br />
Map 5. Aboriginal Treaties, Land Claims and Communities and Intact <strong>Forest</strong> Landscapes of <strong>Canada</strong> ... 27<br />
Map 6. Cumulative Anthropogenic Access in <strong>Canada</strong>’s forest ecozones ... 31<br />
Map 7. Anthropogenic Change (1900-2001) within <strong>Canada</strong>’s <strong>Forest</strong> Ecozones ... 33<br />
Map 8. Ecodistricts of <strong>Canada</strong>’s <strong>Forest</strong> Ecozones by Percent Anthropogenic Change (1900-2001) ... 34<br />
Map 9. Watersheds of <strong>Canada</strong>’s <strong>Forest</strong> Ecozones by Percent Anthropogenic Change (1900-2001) ... 35<br />
Map 10. Ecodistricts of <strong>Canada</strong>’s <strong>Forest</strong> Ecozones by Percent Fragmented as a Result of Recent Anthropogenic<br />
Change (1900-2001) ... 37<br />
Map 11. Watersheds of <strong>Canada</strong>’s <strong>Forest</strong> Ecozones by Percent Fragmented as a Result of Recent Anthropogenic<br />
Change (1900-2001) ... 38<br />
Map 12. Intact <strong>Forest</strong> Landscapes (5,000 to 50,000 ha) by Percent Anthropogenic Change (1990-2001)<br />
Occurring Within 20 Kilometres ... 40<br />
Map 13. Soil Organic Carbon Within <strong>Canada</strong>’s Intact <strong>Forest</strong> Landscapes ... 43<br />
Map 14. Net Biome Productivity Within <strong>Canada</strong>’s Intact <strong>Forest</strong> Landscapes ... 45<br />
Map 15. Wetlands Within <strong>Canada</strong>’s Intact <strong>Forest</strong> Landscapes ... 47<br />
Map 16. Lakes and rivers Within <strong>Canada</strong>’s Intact <strong>Forest</strong> Landscapes ... 49<br />
Map 17. Potential Old-growth Within <strong>Canada</strong>’s Intact <strong>Forest</strong> Landscapes ... 51<br />
Map 18. Reptile and Amphibian Species Within <strong>Canada</strong>’s Intact <strong>Forest</strong> Landscapes ... 53<br />
Map 19. Bird Species Within <strong>Canada</strong>’s Intact <strong>Forest</strong> Landscapes ... 55<br />
Map 20. Mammal Species Within <strong>Canada</strong>’s Intact <strong>Forest</strong> Landscapes ... 57<br />
Map 21. Tree Species Within <strong>Canada</strong>’s Intact <strong>Forest</strong> Landscapes ... 59<br />
Map 22. Caribou Occurrence Within <strong>Canada</strong>’s Intact <strong>Forest</strong> Landscapes ... 61<br />
Map 23. Example Analysis: Combined Conservation Value Within <strong>Canada</strong>’s Intact <strong>Forest</strong> Landscapes ... 64<br />
Map 24. Example Analysis: Combined Conservation Value Within <strong>Canada</strong>’s Intact <strong>Forest</strong> Landscapes<br />
(Protected Areas) ... 65<br />
Map 25. Protected Areas of <strong>Canada</strong> ... 67
List of Figures<br />
Figure 1. Example: satellite images and GFWC’s extracted changes ... 32<br />
List of Tables<br />
Table 1. <strong>Canada</strong>’s intact forest landscapes by size class ... 6<br />
Table 2. Intact forest landscape (IFL): treed and treeless area by ecozone ... 8<br />
Table 3. <strong>Forest</strong> ecozones: treed and treeless area ... 8<br />
Table 4. Intact forest landscapes by forest ecozone ... 10<br />
Table 5. Intact forest landscapes by province/territory ... 11<br />
Table 6. Intact forest landscapes by Aboriginal treaty ... 28<br />
Table 7. Cumulative access by forest ecozone ... 29<br />
Table 8. Cumulative access in forest ecozones by jurisdiction ... 29<br />
Table 9. Intact forest landscapes fragments adjacent to recent anthropogenic change (1900-2001) by<br />
province ... 39<br />
Table 10. Soil organic carbon content within intact forest landscapes ... 42<br />
Table 11. Net biome productivity of intact forest landscapes (2000-2003) ... 44<br />
Table 12. Wetlands within intact forest landscapes ... 46<br />
Table 13. Wetlands within intact forest landscapes by jurisdiction ... 46<br />
Table 14. Intact forest landscapes within watersheds of varying densities of lakes and major rivers ... 48<br />
Table 15. Potential old growth deciduous, mixed, and conifer forest areas within intact forest landscapes<br />
by jurisdiction ... 50<br />
Table 16. Number of common, endangered, threatened and vulnerable taxa used in species diversity<br />
analyses ... 52<br />
Table 17. Total intact forest landscape area covered by varying levels of reptile and amphibian species<br />
diversity ... 53<br />
Table 18. Total area covered by varying levels of bird species diversity ... 54<br />
Table 19. Total area covered by varying levels of mammal species diversity ... 56<br />
Table 20. Total area covered by varying levels of tree species diversity ... 58<br />
Table 21. Extent of woodland caribou occurrence in jurisdictions and intact forest landscapes ... 60<br />
Table 22a. The seven key Where is the Best of What’s Left? ecological values and their categorization and<br />
ranking ... 63<br />
Table 22b. Individual species diversity ranks that were combined for the species diversity ecological<br />
value ... 63<br />
Table 23. Total protected area (permanent and interim) by ecozone ... 68<br />
Table 24. Status of intact forest landscapes with regards to protected area status ... 68<br />
8 | Introduction
Mapping <strong>Canada</strong>’s Changing<br />
Intact <strong>Forest</strong> Landscape<br />
Canadian forests are important both ecologically and<br />
economically as forests and other woodland cover<br />
percent, or 0 million hectares, of the country’s landmass.<br />
Map on page 9 illustrates the extent of <strong>Canada</strong>’s tree<br />
cover. <strong>Canada</strong> has fifteen ecozones, eleven of which are<br />
considered forest ecozones (see Map ). These eleven<br />
ecozones total just over 80 million hectares.<br />
As with other countries, <strong>Canada</strong>’s forest ecosystems are not<br />
static and have changed over time. These changes result<br />
from both human and non-human causes. As Canadians<br />
attempt to manage their forests for a range of values, more<br />
information on the amount and types of change to our<br />
forests is essential. <strong>Global</strong> <strong>Forest</strong> <strong>Watch</strong> focuses its efforts<br />
on the provision of spatial data and maps towards this end.<br />
During the past decade, <strong>Global</strong> <strong>Forest</strong> <strong>Watch</strong> <strong>Canada</strong><br />
(GFWC) has been mapping <strong>Canada</strong>’s forest landscapes.<br />
In 000, <strong>Global</strong> <strong>Forest</strong> <strong>Watch</strong> <strong>Canada</strong> and the World<br />
Resources Institute published <strong>Canada</strong>’s <strong>Forest</strong>s at a Crossroads:<br />
An Analysis in the Year 2000. This report mapped some<br />
basic indicators of the condition of, and change occurring<br />
in, <strong>Canada</strong>’s forests.<br />
In 00 , GFWC released the report <strong>Canada</strong>’s Large Intact<br />
<strong>Forest</strong> Landscapes, which was based on an analysis of satellite<br />
imagery that mapped <strong>Canada</strong>’s remaining large intact forest<br />
landscapes, which we defined as areas of at least 50,000<br />
Agriculture and Agri-Foods <strong>Canada</strong>. 999. A National Ecological<br />
Framework for <strong>Canada</strong>. Available at: http://sis.agr.gc.ca/cansis/nsdb/<br />
ecostrat/intro.html ( /0 / 009)<br />
See various reports on <strong>Canada</strong>’s ecozones, including: ( ) Statistics<br />
<strong>Canada</strong>. 007. Human Activity and the Environment: Annual Statistics<br />
007 and 008. Catalogue no.: - 0 -XWE. Available at: http://<br />
www.statcan.ca/english/freepub/ - 0 -XIE/ 007000/part .htm<br />
( /0 / 009). ( ) Natural Resources <strong>Canada</strong>. The State of <strong>Canada</strong>’s<br />
<strong>Forest</strong>s (various annual reports, 99 - 008). Available at: http://<br />
bookstore.cfs.nrcan.gc.ca/searchpubs_e.php?ResearchNetworkIDs=RN<br />
0 &PubLanguageID=PL ( /0 / 009).<br />
3 Smith W, Lee P. 2007. <strong>Global</strong> <strong>Forest</strong> <strong>Watch</strong> <strong>Canada</strong>: influencing forest<br />
policy with information. The <strong>Forest</strong>ry Chronicle 8 : 8 - 88.<br />
Smith W, Lee P, eds. 000. <strong>Canada</strong>’s <strong>Forest</strong>s at a Crossroads: An Assessment<br />
in the Year 000. Washington DC: World Resources Institute.<br />
Available at: http://www.globalforestwatch.ca/publications_and_maps.<br />
htm ( /0 / 009).<br />
1. Introduction<br />
Birch and conifer forest near Chibougamau, QC (10/2004)<br />
hectares ( 00 km ) within forest ecozones that contain<br />
forest and non-forest ecosystems minimally disturbed by<br />
human activity.<br />
Building upon this work, GFWC then released a report<br />
in 00 titled <strong>Canada</strong>’s <strong>Forest</strong> Landscape Fragments: A First<br />
Approximation which mapped the first approximation of<br />
intact forest landscapes and forest fragments, that is, areas<br />
of forest less than 0,000 hectares in size. We used satellite<br />
imagery to map smaller areas of <strong>Canada</strong>’s forests that<br />
could be considered intact forest landscapes. These areas<br />
ranged from ,000 to 0,000 hectares ( 0- 00 km ) for the<br />
temperate forest ecozones and 0,000 to 0,000 hectares<br />
( 00- 00 km ) for the boreal and taiga ecozones.<br />
Since the completion of that report, GFWC received<br />
funding to refine this analysis and to map even smaller<br />
areas of potentially intact forest landscapes. This project,<br />
entitled “Where is the best of what’s left?” used satellite<br />
The intact forest landscape concept was advanced (and primarily<br />
originally funded) through the World Resources Institute, following<br />
definitions developed by Greenpeace Russia, Socio-Ecological Union<br />
International, and Biodiversity Conservation Center. A large intact forest<br />
landscape is defined by those groups as an area with the following characteristics:<br />
(i) it is situated within a forest zone; (ii) it is at least 0,000 ha;<br />
(iii) it contains a contiguous mosaic of natural ecosystems which may<br />
or may not be of different types; (iv) it is not broken or fragmented by<br />
infrastructure; (v) it does not display signs of significant transformation<br />
caused by human activity. There are a number of additional assumptions<br />
and decision rules that have been used in the actual mapping of large<br />
intact forest landscapes.<br />
GFWC | Atlas of <strong>Canada</strong>’s Intact <strong>Forest</strong> Landscapes| 1
imagery to map areas down to ,000 hectares ( 0 km ) for<br />
temperate forest ecozones and down to ,000 hectares ( 0<br />
km ) for boreal/taiga ecozones.<br />
GFWC’s newest dataset based on this work, “<strong>Canada</strong>’s<br />
<strong>Forest</strong> Landscape Fragments: A Second Approximation”<br />
( 009) provides a national perspective as well as forest<br />
ecozone and regional perspectives. This dataset was created<br />
by analyzing Landsat imagery from over multiple years,<br />
generally ranging from 988 to 00 , but up to 00 for<br />
some regional areas.<br />
GFWC has not previously published a comprehensive<br />
compilation of the results, nor analysis regarding how<br />
intact forest landscapes intersect with important ecological<br />
and social values that should be considered in sustainable<br />
forest management. That is one purpose of this Atlas, as<br />
discussed in more detail below.<br />
<strong>Global</strong> <strong>Forest</strong> <strong>Watch</strong> <strong>Canada</strong>’s rationale for our work is<br />
multifold:<br />
•<br />
•<br />
•<br />
The pace and scale of human activity in <strong>Canada</strong> is<br />
significant. In fact, several governments in <strong>Canada</strong> are<br />
of the opinion that some major regions have “reached<br />
a tipping point;”<br />
Concern about the economic, environmental and social<br />
impacts of human use of forest regions is increasing in<br />
<strong>Canada</strong> and world-wide; 7<br />
Monitoring and understanding the locations,<br />
concentrations and rates of human use in forest<br />
ecozones in efficient and effective ways will serve<br />
to better inform sustainable forest management<br />
decision making; 8<br />
Previous and ongoing research on and monitoring of<br />
<strong>Canada</strong>’s remaining intact forest landscapes, albeit detailed<br />
and sophisticated in many cases, is incomplete, not publicly<br />
available, local in scale, or species- or sector-specific: there<br />
is a need to report on broader national perspectives.<br />
( ) Alberta Government. 008. Land-use Framework. Available at:<br />
http://www.landuse.alberta.ca/ ( /0 / 009). ( ) Nova Scotia Department<br />
of Natural Resources. 997. Towards Sustainable <strong>Forest</strong>ry: A<br />
Position Paper. Working Paper, 997-0 . Available at: http://www.gov.<br />
ns.ca/natr/publications/forpubs.htm ( /0 / 009).<br />
7 Millennium Ecosystem Assessment (Hassan R, Scholes R, Ash N,<br />
eds.). 00 . Ecosystems and human well-being: current state and trends,<br />
Volume , Chapter : <strong>Forest</strong> and Woodland Systems. Available at:<br />
http://www.millenniumassessment.org/documents/document. 90.aspx.<br />
pdf ( /0 / 009).<br />
8 Gillis M, Omule AY, Brierly T. 00 . Monitoring <strong>Canada</strong>’s forests:<br />
the national forest inventory. The <strong>Forest</strong>ry Chronicle 8 : – .<br />
2 | Section 1. Introduction<br />
The importance of intact forest<br />
landscapes<br />
Fallen tree in cedar grove, BC (05/2006)<br />
Remaining tracts of relatively undisturbed, intact natural<br />
forest are important for several reasons:<br />
Conservation value. Small patches of undisturbed<br />
forest landscapes are an important component of<br />
conservation strategies, especially where they are the only<br />
option. 9 However, large patches of natural forest landscape<br />
provide sufficient area for natural ecological processes<br />
which shape the forest ecosystem and provide habitat<br />
for more species 0 and for far-ranging species, such as<br />
woodland caribou and grizzly bears.<br />
Ecosystem goods and services values. Intact<br />
forest landscapes provide a range of ecosystem services,<br />
such as water purification, climate regulation, and carbon<br />
storage.<br />
9 Smaller patches provide habitat for a wide range of species and<br />
are sometimes the only remaining forest landscapes in an ecological or<br />
administrative unit.<br />
0 Lindenmayer D, Fischer J. 00 . Habitat Fragmentation and Landscape<br />
Change: An Ecological and Conservation Synthesis. Washington:<br />
Island Press. 8 pp.<br />
Nogueran R with contributions by Bryant DA, Strittholt J, Kool J.<br />
00 . Low access forests and their level of protection in North America.<br />
Washington DC: World Resources Institute. pp. Available online<br />
at: http://pubs.wri.org/northamericalowaccessforests-pub- 7 .html<br />
( /0 / 009).<br />
Anielski M, Wilson S. 00 . Counting <strong>Canada</strong>’s Natural Capital:<br />
assessing the real value of <strong>Canada</strong>’s boreal ecosystems. A report of<br />
the Pembina Institute for Appropriate Development and the Canadian<br />
Boreal Initiative. 90 pp. Available online at: http://www.borealcanada.<br />
ca/research-cbi-reports-e.php (undergoing revision: /0 / 009).<br />
Map 1 - key data sources:<br />
•<br />
Terrestrial ecozones: Agriculture and Agri-Foods<br />
<strong>Canada</strong>. 1999. A National Ecological Framework for<br />
<strong>Canada</strong>. Available at: http://sis.agr.gc.ca/cansis/nsdb/<br />
ecostrat/intro.html (10/09/2008).
Map 1.
Recreational, aesthetic, spiritual and heritage<br />
values. As human populations grow and natural forest<br />
is converted to other uses, remaining tracts of relatively<br />
undisturbed forest are increasingly valued for their natural<br />
heritage, spiritual values, and recreational/wilderness<br />
opportunities.<br />
Economic value. Subsidence economies, especially<br />
those involving Aboriginal peoples or tourism, depend on<br />
intact forest landscapes. Tourism, for example, is the<br />
world’s largest industry (and nature/heritage tourism is<br />
the fastest growing component of the tourism sector<br />
worldwide). Although economic information specific<br />
to tourism in forests is not available, expenditures in<br />
<strong>Canada</strong> do depend on sustaining forests’ natural capital.<br />
In the United States, the <strong>Forest</strong> Service has estimated<br />
that recreational activities in national forests contribute<br />
$ 0 billion annually to the GDP, that wild, roadless lands<br />
generate an average value of $ .87 per visitor day, and<br />
that the economic value of recreation on the million<br />
acres of roadless areas in US national forests totals $ 00<br />
million annually.<br />
It is important to map remaining intact forest landscapes<br />
within <strong>Canada</strong>’s forest ecozones in order to provide better<br />
information for balancing industry needs and values with<br />
the need for recognition of non-market values, many of<br />
which are associated with relatively undisturbed forests.<br />
Mapping forest fragments provides a baseline from which<br />
future assessments of changes to <strong>Canada</strong>’s remaining forest<br />
fragments can be made and from which further analysis<br />
can be performed to assist forest conservation planning<br />
and decision-making.<br />
Cheakamus Lake, BC (08/2005)<br />
World Travel and Tourism Council. 008. Progress and Priorities<br />
007/ 008. Available at: http://www.wttc.org/bin/pdf/original_pdf_<br />
file/finpp_2007.pdf (14/04/2009).<br />
Worbets B, Berdahl L. 00 . Western <strong>Canada</strong>’s natural capital:<br />
toward a new public policy framework. Available at: http://www.cwf.<br />
ca/V2/files/natcap.pdf (14/04/2009).<br />
Kreiger DJ. 00 . The Economics of <strong>Forest</strong> Ecosystem Services:<br />
A Review. Analysis for the Wilderness Society. Washington, DC. 0 pp.<br />
Available online at: http://wilderness.org/files/Economic-Value-of-<strong>Forest</strong>-Ecosystem-Services.pdf<br />
( /0 / 009).<br />
4 | Section 1. Introduction<br />
Technical notes on GFWC’s intact<br />
forest landscapes methodology<br />
and data<br />
<strong>Global</strong> <strong>Forest</strong> <strong>Watch</strong>’s methodology for mapping intact<br />
forest landscapes involves excluding the following types of<br />
disturbances from potential intact forest landscapes:<br />
•<br />
•<br />
•<br />
•<br />
•<br />
Settlements;<br />
Infrastructure used for communication between<br />
settlements and industrial sites; or for industrial<br />
exploitation of natural resources (including roads,<br />
railways, navigable waterways, pipelines, trunk power<br />
transmission lines and other linear disturbances);<br />
Agricultural lands;<br />
Territories disturbed by economic activities during<br />
the last 0-70 years (logging, mining operation sites,<br />
abandoned agricultural lands, etc.);<br />
Artificially restored forests, or tree plantations, if their<br />
existence can be detected on Landsat satellite imagery.<br />
The ratio of forest and non-forest ecosystems within<br />
intact forest landscapes is not a factor in whether an area<br />
is defined as intact or non-intact. The key criteria are an<br />
absence of disturbed territories and infrastructure objects.<br />
Thus, intact forest landscapes may consist primarily of<br />
non-treed ecosystems that are minimally disturbed by<br />
human industrial activity (for example, treeless swamps<br />
or alpine and upper sub-alpine rocky areas in mountains<br />
that are fully surrounded by forest). The exception is<br />
large water bodies. Lakes larger than 0,000 hectares are<br />
excluded from the forest landscape data to avoid situations<br />
where intact forest landscapes are predominantly water.<br />
It should be noted that some human impacts are invisible<br />
from space, such as small forest roads and paths. Other<br />
smaller-scale impacts (including some selective logging)<br />
that occurred more than 0-70 years ago often become<br />
invisible on satellite imagery and indistinguishable from<br />
the natural dynamics of the forest. The maps of <strong>Canada</strong>’s<br />
intact forests in Section are based primarily on the visual<br />
interpretation of 988- 00 Landsat images, and some<br />
imagery from the 00 - 00 period. Therefore, only more<br />
recent human impacts are recorded, which means that<br />
there is some overestimation of intact forest landscape<br />
areas despite the buffer exclusion zones applied to the<br />
disturbance layers that were used to create the intact forest<br />
landscape data.
There are some differences between maps and figures in<br />
this Atlas compared to the maps and figures published<br />
in 00 and 00 . 7 Besides the mapping of smaller<br />
intact forest landscapes, there are a few other factors. One<br />
important change in our work involved the use of different<br />
northern boundaries for the forest landscapes. For the<br />
00 analysis, GFWC used a globally derived treeline<br />
boundary. For the 00 and 009 analysis GFWC used<br />
the forest ecozone boundaries as the northern boundary.<br />
The million hectare difference in the total area of intact<br />
forest landscapes between the 00 data and the 009<br />
data is only partially explained ( 0 million hectares) by the<br />
mapping of smaller forest fragments. The majority, 9<br />
million hectares, is due to using a different map projection<br />
for the 009 area calculations. The 00 and 00 analyses<br />
used a standard Lambert Conformal Conic Projection.<br />
The new 009 dataset used the Albers Equal-Area conic<br />
projection, which is consistent with Statistics <strong>Canada</strong>,<br />
who have concluded that Albers is more appropriate for<br />
calculating land area. The remaining million hectare<br />
difference is due to a combination of factors, including<br />
using more detailed lake and island datasets as well as<br />
interpretation improvements (and differences due to using<br />
a different selection of Landsat imagery).<br />
For further details on our intact forest landscape mapping<br />
methodology, please see Appendix .<br />
Lee P, Aksenov D, Laestadius L, Nogueron R, Smith W. 00 .<br />
<strong>Canada</strong>’s large intact forest landscapes. Edmonton, Alberta: <strong>Global</strong><br />
<strong>Forest</strong> <strong>Watch</strong> <strong>Canada</strong>. 8 pp.<br />
7 Lee P, Gysbers JD, Stanojevic Z. 00 . <strong>Canada</strong>’s <strong>Forest</strong> Landscape<br />
Fragments: A FirstApproximation (A <strong>Global</strong> <strong>Forest</strong> <strong>Watch</strong> <strong>Canada</strong><br />
Report). Edmonton, Alberta: <strong>Global</strong> <strong>Forest</strong> <strong>Watch</strong> <strong>Canada</strong>. 97 pp..<br />
Purpose and Structure of the<br />
Atlas<br />
This atlas of <strong>Canada</strong>’s intact forests is the direct result<br />
of <strong>Global</strong> <strong>Forest</strong> <strong>Watch</strong> <strong>Canada</strong>’s project to map the best<br />
remaining forest landscapes of <strong>Canada</strong>. The objective<br />
for this atlas is to provide visually compelling maps and<br />
information of <strong>Canada</strong>’s intact forest landscapes as well as<br />
a selection of key indicators related to conservation values<br />
in these areas. The Atlas provides an update on what is<br />
happening to <strong>Canada</strong>’s forests and where to find the best<br />
of what’s left.<br />
Section 1 introduces <strong>Canada</strong>’s changing forests, intact<br />
forest landscapes and why they are important, and the<br />
purpose and structure of the Atlas.<br />
Section 2 of the Atlas describes the concepts of intact<br />
forest landscapes in more detail. It also contains maps and<br />
key facts about <strong>Canada</strong>’s forests and intact forests, at both<br />
national and regional/provincial levels.<br />
Section 3 looks at the “best of what’s left” in intact forest<br />
landscapes in terms of key ecological values. The intact<br />
forest landscapes are evaluated and mapped with overlays<br />
and analyses of key ecological values including soil organic<br />
carbon, wetlands, lakes and major rivers, old growth<br />
forests, species diversity, and key focal species. A final<br />
map combines all of these ecological values indicators and<br />
identifies potential key opportunities for sustainable forest<br />
management in <strong>Canada</strong>.<br />
Section 4 provides an overview of the current state of<br />
<strong>Canada</strong>’s protected area network and how this network<br />
intersects with the distribution of <strong>Canada</strong>’s forest<br />
landscapes.<br />
Section 5 concludes with a summary of the project and its<br />
major findings, implications of this work, lessons learned<br />
and future research recommendations.<br />
GFWC | Atlas of <strong>Canada</strong>’s Intact <strong>Forest</strong> Landscapes| 5
Overview<br />
This section provides a series of maps<br />
that illustrates both a national and<br />
regional perspective on the distribution of<br />
<strong>Canada</strong>’s intact forest landscapes, a map<br />
that shows the distribution of tree cover<br />
within intact forest landscapes, and the<br />
key results of our analysis.<br />
<strong>Canada</strong>’s intact forest landscapes, as<br />
mapped by GFWC, are located where<br />
there is the least amount of human<br />
impact. To highlight the inverse, this<br />
section also includes a map of cumulative<br />
access within <strong>Canada</strong>’s forest ecozones<br />
and maps of changes in <strong>Canada</strong>’s forest<br />
landscape between 990 and 00 .<br />
As well as providing analysis and maps in the context of<br />
jurisdictions and forest ecozones, some additional analysis<br />
and maps are provided in the context of ecodistricts in<br />
order to understand finer levels of distributions of intact<br />
forest landscapes and anthropogenice changes to forest<br />
landscapes. Ecodistricts are subdivisions of ecoregions,<br />
which in turn are subdivisions of ecozones and they are<br />
characterized by distinctive assemblages of landform,<br />
relief, surficial geologic material, soil, water bodies,<br />
vegetation, and land uses.<br />
Map illustrates the distribution of intact forest landscapes<br />
within <strong>Canada</strong>. GFWC’s analysis has identified 488 million<br />
hectares of intact forest landscape in <strong>Canada</strong> within the<br />
eleven forest ecozones. This represents 7 % of the total<br />
area of these ecozones.<br />
It is important to note that GFWC has mapped a range of<br />
intact forest landscapes in terms of size. GFWC defines a<br />
large intact forest landscape as any area of at least 0,000<br />
hectares ( 00 km ) within a forest ecozone that contains<br />
forest and non-forest land cover minimally disturbed<br />
by human economic activity. An intact forest landscape<br />
fragment is any area between ,000 to 0,000 hectares ( 0<br />
to 00 km ) in a temperate forest ecozone and between<br />
,000 and 0,000 hectares ( 0 to 00 km ) in a boreal/taiga<br />
forest ecozone.<br />
6 | Section 2. Intact forest landscapes<br />
2. Intact forest landscapes<br />
Table 1. <strong>Canada</strong>’s intact forest landscapes by size class.<br />
Size class (ha)<br />
Number of Area (ha)<br />
intact forest Polygons of Islands<br />
landscape 1,000 ha and considered<br />
polygons larger intact<br />
Total area<br />
(ha)<br />
%<br />
Total<br />
area<br />
250,000 89 425,570,450 298,292 425,868,742 87.2<br />
Total 7,359 485,948,580 2,247,246 488,195,826 100.0<br />
Table provides statistics on the relative size of <strong>Canada</strong>’s<br />
intact forest landscapes. A total of million hectares<br />
(87%) of all intact forest landscapes are 0,000 hectares<br />
or larger while another . million hectares are between<br />
0,000 and 00,000 hectares in size.<br />
There are . million hectares of ,000 to ,000 hectare<br />
intact forest landscape fragments and 7.9 million hectares<br />
of ,000 to 0,000 hectare intact forest landscape<br />
fragments in temperate forest ecozones.<br />
There are also just over 00,000 hectares of intact forest<br />
landscapes in islands smaller than ,000 hectares. Islands<br />
were considered a special case for identification because<br />
of their setting in an aquatic environment (marine and<br />
freshwater). There are also many islands of larger size<br />
that are considered part of the total area of intact forest<br />
landscapes.<br />
Map 2 - key data source:<br />
•<br />
Intact forest landscapes: <strong>Global</strong> <strong>Forest</strong> <strong>Watch</strong> <strong>Canada</strong>.<br />
2009. <strong>Canada</strong>’s <strong>Forest</strong> Landscape Fragments: A<br />
Second Approximation. Available at: http://www.<br />
globalforestwatch.ca/datawarehouse/datawarehouse.<br />
htm (15/05/2009).
Map 2.
Tree cover<br />
As shown in Map , <strong>Canada</strong>’s forest ecozones are not<br />
completely covered with forest (defined as tree cover of<br />
more than 0%), thus neither are intact forest landscapes.<br />
As evident in Table , approximately % of intact forest<br />
landscapes are actually forested.<br />
Six ecozones (Atlantic Maritime, Boreal<br />
Shield, Hudson Plains, the Montane<br />
Cordillera, Taiga Plains and Boreal<br />
Plains) have more than 0% forest<br />
cover within their intact forest. The<br />
Taiga Cordillera ecozone is the least<br />
forested with only 0% tree cover and<br />
the Mixed Wood Plains ecozone is the<br />
second least forested at %.<br />
GFWC’s analysis reveals that the overall<br />
percentage of tree cover in intact forest<br />
landscapes is almost the same as the<br />
overall percentage of tree cover in<br />
forest ecozones (see Tables and ).<br />
However, there are some exceptions:<br />
•<br />
•<br />
Although the Mixed Wood Plains<br />
ecozone is only % tree covered<br />
in general, over % of its intact<br />
forest landscape area is treecovered.<br />
Both the Pacific Maritime and<br />
the Taiga Cordillera ecozones<br />
have high proportions of nontreed<br />
areas within intact forest<br />
landscapes compared to the other<br />
ecozones. The Pacific Maritime has<br />
just under 0% tree cover in intact<br />
The Spectrum Range in northern British Columbia (08/2006)<br />
8 | Section 2. Intact forest landscapes<br />
Table 2. Intact forest landscapes (IFL): treed and treeless area by ecozone.<br />
Ecozone<br />
Total IFL<br />
area (ha)<br />
Treed area<br />
(ha)<br />
Treeless area<br />
(ha)<br />
Percent<br />
treed<br />
Percent<br />
treeless<br />
Atlantic Maritime 1,836,928 1,704,961 131,967 92.2 7.2<br />
Boreal Cordillera 44,540,877 19,266,120 25,274,757 43.3 56.8<br />
Boreal Plains 27,517,456 19,062,822 8,454,634 69.3 30.7<br />
Boreal Shield 127,849,511 97,431,966 30,417,545 76.2 23.8<br />
Hudson Plains 36,797,505 24,819,293 11,978,212 67.5 32.6<br />
Mixed Wood Plains 175,258 116,555 58,703 66.5 33.5<br />
Montane Cordillera 26,672,966 13,806,738 12,866,228 51.8 48.2<br />
Pacific Maritime 14,380,619 4,287,111 10,093,508 29.8 70.2<br />
Taiga Cordillera 26,125,048 2,625,891 23,499,157 10.1 90.0<br />
Taiga Plains 48,124,275 29,926,595 18,197,680 62.2 37.8<br />
Taiga Shield 134,175,383 60,631,459 73,543,924 45.2 54.8<br />
Total 488,195,825 273,679,511 214,516,314 56.1 43.9<br />
Table 3. <strong>Forest</strong> ecozones: treed and treeless area.<br />
Ecozone<br />
Total area<br />
(ha)<br />
Treed area<br />
(ha)<br />
Treeless area Percent<br />
(ha) treed<br />
Percent<br />
treeless<br />
Atlantic Maritime 20,151,483 16,766,636 3,384,846 83.2 16.8<br />
Boreal Cordillera 47,071,039 20,782,040 26,289,000 44.2 55.9<br />
Boreal Plains 74,062,933 42,446,471 31,616,462 57.3 42.7<br />
Boreal Shield 188,640,692 146,991,133 41,649,559 77.9 22.1<br />
Hudson Plains 37,565,744 25,141,285 12,424,459 66.9 33.1<br />
Mixed Wood Plains 11,339,105 2,643,525 8,695,580 23.3 76.7<br />
Montane Cordillera 48,975,931 31,587,882 17,388,049 64.5 35.5<br />
Pacific Maritime 20,873,620 9,109,313 11,764,307 43.6 56.4<br />
Taiga Cordillera 26,695,320 2,766,180 23,929,140 10.4 89.6<br />
Taiga Plains 65,773,771 40,690,528 25,083,243 61.9 38.1<br />
Taiga Shield 139,314,737 61,444,990 77,869,747 44.1 55.9<br />
Total 680,464,374 400,372,056 280,092,319 58.8 41.2<br />
Map 3 - key data sources:<br />
•<br />
•<br />
forest landscapes despite having % tree cover overall<br />
throughout the ecozone. The Taiga Cordillera has 0%<br />
tree cover throughout the entire ecozone and 0% tree<br />
cover in intact forest landscapes.<br />
Intact forest landscapes: <strong>Global</strong> <strong>Forest</strong> <strong>Watch</strong> <strong>Canada</strong>.<br />
2009. <strong>Canada</strong>’s <strong>Forest</strong> Landscape Fragments: A<br />
Second Approximation. Available at: http://www.<br />
globalforestwatch.ca/datawarehouse/datawarehouse.<br />
htm (15/05/2009).<br />
Tree canopy cover: DeFries R, Hansen M, Townshend<br />
JRG, Janetos AC, Loveland TR. 2000. 1 Kilometer<br />
Tree Cover Continuous Fields, 1.0, Department of<br />
Geography, University of Maryland, College Park,<br />
Maryland, 1992-1993. Available at: http://glcf.umiacs.<br />
umd.edu/data/treecover/ (14/04/2009).
Map 3.
Regional analyses<br />
The following pages present maps and analyses on an<br />
ecozone and a provincial basis. These results highlight the<br />
variation in area of intact forest landscapes (see Tables<br />
and ). The distribution of the intact forest landscapes are<br />
illustrated regionally in Map Sheets I-XIII; Map provides<br />
the regional index for these maps.<br />
Ecozone analysis<br />
The Boreal Cordillera, Taiga Cordillera, Taiga Shield and<br />
Hudson Plains are the most intact of the eleven forest<br />
ecozones, with each having over 9 % of their total land<br />
area in intact forest landscapes.<br />
The Boreal Shield, the largest forest ecozone in <strong>Canada</strong>, is<br />
8% intact. By contrast, the the Boreal Plains is only 7%<br />
( . million ha) intact.<br />
The four temperate forest ecozones (Atlantic Maritime,<br />
Mixed Wood Plains, Montane Cordillera and Pacific<br />
Maritime) account for just under 9% of the intact forest<br />
landscapes in <strong>Canada</strong>. However, given the relatively small<br />
areas of these ecozones, the proportion of intact forest<br />
landscapes is of more importance than the total area.<br />
The Mixed Wood Plains of southern Ontario and Québec<br />
is not only the smallest forest ecozone, it is also the least<br />
intact (see Map on page 7 and Map Sheet XI). It has no<br />
large intact forest landscapes and only %, or 7 , 8 ha,<br />
is made up of intact forest landscape fragments of ,000 to<br />
0,000 ha.<br />
The Atlantic Maritime Ecozone is the second least intact<br />
forest ecozone. Only 9% (or . 7 million ha) of its area<br />
Table 4. Intact forest landscapes (IFL) by forest ecozone.<br />
Ecozone<br />
Ecozone area<br />
(ha)<br />
10 | Section 2. Intact forest landscapes<br />
Total area of<br />
intact forest<br />
landscapes (ha)<br />
Ecozone:<br />
percent<br />
intact<br />
comprises intact forest landscapes (see Map and Map<br />
Sheet XIII), most of which (80%) is made up of intact<br />
forest landscape fragments versus large intact forest<br />
landscapes.<br />
Relative to the Mixed Wood Plains and Atlantic Maritime<br />
ecozones, the Montane Cordillera and Pacific Maritime<br />
ecozones retain a greater degree of intact forest landscapes<br />
( % and 9% respectively).<br />
Provincial and territorial analysis<br />
There is significant variation in the percentage of<br />
intact forest landscapes by jurisdiction in <strong>Canada</strong>. Four<br />
jurisdictions - Québec, Northwest Territories, Ontario and<br />
British Columbia - each contain over 0% of the total area<br />
of large intact forest landscapes. Together, they contain<br />
% of all of <strong>Canada</strong>’s intact forest landscapes.<br />
Manitoba and the Yukon Territory each contain about<br />
9- 0% of <strong>Canada</strong>’s intact forest landscapes. Thus, six<br />
jurisdictions contain approximately 80% of <strong>Canada</strong>’s intact<br />
forest landscapes.<br />
Five other jurisdictions contain relatively little intact forest<br />
landscape. Prince Edward Island and Nova Scotia each<br />
contain less than % while Nunavut has % and Alberta<br />
has %. Newfoundland and Labrador contains less than<br />
7% of <strong>Canada</strong>’s intact forest landscapes.<br />
The territories have relatively high proportions of their<br />
forest ecozones in intact forest landscapes: the Yukon has<br />
9 % intact, the Northwest Territories has 87% intact and<br />
Nunavut has 00% intact. Together, the three territories<br />
account for almost 9% of the total intact<br />
forest landscapes in <strong>Canada</strong>.<br />
Proportion<br />
of total IFL<br />
area (%)<br />
Atlantic Maritime 20,151,483 1,836,928 9.1 0.4<br />
Boreal Cordillera 47,071,039 44,540,876 94.6 9.1<br />
Boreal Plains 74,062,933 27,517,456 37.2 5.6<br />
Boreal Shield 188,640,692 127,849,511 67.8 26.2<br />
Hudson Plains 37,565,744 36,797,504 98 .0 7.5<br />
Mixed Wood Plains 11,339,105 175,258 1.5 >0.1<br />
Montane Cordillera 48,975,931 26,672,966 54.5 5.5<br />
Pacific Maritime 20,873,620 14,380,619 68.9 3.0<br />
Taiga Cordillera 26,695,320 26,125,048 97.9 5.4<br />
Taiga Plains 65,773,771 48,124,275 73.2 9.8<br />
Taiga Shield 139,314,737 134,175,383 96.3 27.5<br />
Total 680,464,374 488,195,825 71.7 100.0<br />
Alberta has almost 0 million ha of intact<br />
forest landscape, which represents 9% of<br />
its forest ecozone area. This percentage<br />
places Alberta in tenth place in terms of<br />
percent intactness compared to the other<br />
provinces and territories. Alberta’s 0<br />
million ha represents % of <strong>Canada</strong>’s total<br />
intact forest landscapes.<br />
British Columbia has 9 .7 million ha<br />
of land area within forest ecozones.<br />
Approximately 8 million ha are considered<br />
intact, of which 0 million ha are large
intact forest landscapes and 7.7 million ha are intact forest<br />
landscape fragments. British Columbia’s intact forest<br />
landscapes account for almost % of <strong>Canada</strong>’s total intact<br />
forest landscapes – the fourth highest percentage overall<br />
after Québec, the Northwest Territories and Ontario.<br />
British Columbia has the largest amount of intact forest<br />
landscape fragments of all provinces and territories.<br />
In Saskatchewan, of million ha of forest ecozone<br />
area are considered intact, which represents 7 % of the<br />
total forest ecozone area. The province has just over %<br />
of the total intact forest landscapes in <strong>Canada</strong>. Trees cover<br />
just over 77% of the large intact forest landscapes and<br />
almost 78% of the intact forest landscape fragments.<br />
Manitoba has .8 million ha (or<br />
8 %) of intact forest landscape<br />
area within its 7.9 million ha of<br />
forest ecozone.<br />
Ontario has . million ha of<br />
intact forest landscapes in its 98.9<br />
million ha of forest ecozone area<br />
(representing 7% of the total<br />
area). The province has the third<br />
highest percentage (almost 9%)<br />
of <strong>Canada</strong>’s intact forest landscape<br />
fragments, after British Columbia<br />
and Québec.<br />
Québec has the largest total area<br />
composed of forest ecozones:<br />
0. million ha in total. Of<br />
this area, 9 . million ha (70%)<br />
is composed of intact forest<br />
landscapes.<br />
East of Québec City, QC (10/2004)<br />
Prince Edward Island has only 9 ,000 ha of forest<br />
ecozone area, none of which is intact. New Brunswick<br />
has 7. million ha of forest ecozone area, of which only<br />
7,000 ha (or %) are intact. These provinces only<br />
contain intact forest landscape fragments; there are no<br />
large intact forest landscapes of at least 0,000 hectares.<br />
Nova Scotia fares slightly better than New Brunswick.<br />
It contains . million ha of forest ecozones of which<br />
9 ,000 ha (or 7%) are intact forest landscapes. Of this,<br />
7 ,000 ha (almost 7 %) are large intact forest landscapes<br />
while 9,000 ( %) are intact forest landscape fragments.<br />
Table 5. Intact forest landscapes by province/territory.<br />
Province<br />
<strong>Forest</strong><br />
ecozone area<br />
(ha)<br />
Intact forest<br />
landscape<br />
area (ha)<br />
Percent of<br />
forest ecozones<br />
covered by<br />
intact forest<br />
landscapes<br />
Proportion<br />
of total<br />
intact forest<br />
landscapes<br />
area (%)<br />
Alberta 50,672,649 19,974,967 39.4 4.1<br />
British Columbia 94,709,033 58,119,773 61.4 11.9<br />
Manitoba 57,883,340 46,764,179 80.8 9.6<br />
New Brunswick 7,299,874 257,178 3.5 0.1<br />
Newfoundland and<br />
Labrador<br />
39,022,812 33,620,392 86 .2 6.9<br />
Northwest Territories 95,539,825 83,556,502 87.5 17.1<br />
Nova Scotia 5,562,603 943,188 17.0 0.2<br />
Nunavut 10,786,309 10,744,947 99.6 2.2<br />
Ontario 98,953,976 66,372,280 67 .1 13.6<br />
Prince Edward Island 593,012 0 0 0<br />
Québec 130,430,760 91,374,828 70.1 18.7<br />
Saskatchewan 41,158,212 31,092,779 75.5 6.4<br />
Yukon Territory 47,851,969 45,371,883 94.8 9.3<br />
Total 680,464,374 488,195,825 71.2 100.0<br />
Map 4 & Map Sheets I-XIII - key data sources:<br />
•<br />
•<br />
•<br />
Intact forest landscapes: <strong>Global</strong> <strong>Forest</strong> <strong>Watch</strong> <strong>Canada</strong>.<br />
2009. <strong>Canada</strong>’s <strong>Forest</strong> Landscape Fragments: A Second<br />
Approximation. Available at: http://www.globalforestwatch.<br />
ca/datawarehouse/datawarehouse.htm (15/05/2009).<br />
Land cover: Multi-temporal land cover maps of <strong>Canada</strong> using<br />
NOAA AVHRR 1-km data from 1985-2000. Available at: http://<br />
www.geogratis.ca/geogratis/en/download/thematic0.html<br />
(14/04/2009).<br />
Terrestrial ecozones: Agriculture and Agri-Foods <strong>Canada</strong>.<br />
1999. A National Ecological Framework for <strong>Canada</strong>. Available<br />
at: http://sis.agr.gc.ca/cansis/nsdb/ecostrat/intro.html<br />
(14/04/2009).<br />
GFWC | Atlas of <strong>Canada</strong>’s Intact <strong>Forest</strong> Landscapes| 11
Map 4.
Aboriginal treaties and settled land claims analysis<br />
Aboriginal people have rights and legal status concerning<br />
forested lands due to their historical presence in what<br />
is now <strong>Canada</strong>, and to the entrenchment of Aboriginal<br />
and treaty rights in the Constitution Act, 98 . However,<br />
although Aboriginal and treaty rights (including rights<br />
to fish, trap and hunt) were recognized in section 35 of<br />
the Constitution Act of 98 , these rights continue to be<br />
clarified and resolved today through negotiated treaties<br />
and court decisions. This situation exists in part because<br />
courts have declared that existing Aboriginal rights “must<br />
be interpreted flexibly so as to permit their evolution over<br />
time” (R v. Sparrow, [ 990] S.C.R. 07 ). The outcomes<br />
of these processes on Aboriginal rights, treaties, and land<br />
claims have the potential to change the way forests in<br />
<strong>Canada</strong> are owned and managed in the future.<br />
Map shows the locations of Aboriginal treaties and<br />
land claims in relation to the distribution of intact forest<br />
landscapes. Table (page 8) provides a summary of<br />
the area of intact forest landscape within each treaty. As<br />
the study area of GFWC’s project only covered the<br />
forest ecozones, the statistics do not refer to the complete<br />
coverage of land claim and treaty area in <strong>Canada</strong>.<br />
Three historic treaty areas each have over 90% of their<br />
area covered by intact forest landscapes: Treaties ( 908),<br />
9 ( 9 9/ 0), and 0 ( 90 ). These three treaty areas<br />
Smith W. and P. Lee, eds. <strong>Canada</strong>’s <strong>Forest</strong>s at a Crossroads: An Assessment<br />
in the Year 000. (World Resources Institute and <strong>Global</strong> <strong>Forest</strong><br />
<strong>Watch</strong> <strong>Canada</strong>.) Victoria BC: Beacon Hill Communications Gp. Inc.<br />
Available at: http://www.globalforestwatch.ca ( /0 / 009).<br />
26 | Section 2. Intact forest landscapes<br />
Bird feather, SK (10/2005)<br />
comprise just over 0% of all the historic treaties and<br />
almost % of all the intact forest landscapes within all<br />
historic treaties.<br />
Six other historic treaties have 0% to 90% of their area<br />
covered by intact forest landscape: Treaties ( 87 ),<br />
( 87 ), ( 889), 8 ( 899), 9 ( 90 /0 ), ( 9 ). These<br />
six treaty areas comprise almost % of all the historic<br />
treaties and 0% of intact forest landscapes within all<br />
historic treaties.<br />
<strong>Canada</strong> has more than 7,0 7, hectares of modern<br />
settled land claims with Aboriginal people. Of these land<br />
claims, 7, 78,70 hectares – or % of the entire area<br />
– are composed of intact forest landscapes.<br />
Map 5 - key data sources:<br />
•<br />
•<br />
•<br />
Intact forest landscapes: <strong>Global</strong> <strong>Forest</strong> <strong>Watch</strong> <strong>Canada</strong>.<br />
2009. <strong>Canada</strong>’s <strong>Forest</strong> Landscape Fragments: A<br />
Second Approximation. Available at: http://www.<br />
globalforestwatch.ca/datawarehouse/datawarehouse.<br />
htm (15/05/2009).<br />
Land cover: Multi-temporal land cover maps of <strong>Canada</strong><br />
using NOAA AVHRR 1-km data from 1985-2000. Available<br />
at: http://www.geogratis.ca/geogratis/en/download/<br />
thematic0.html (14/04/2009).<br />
Aboriginal Treaties and Land Claims: <strong>Canada</strong> Centre for<br />
Cadastral Management, Geomatics <strong>Canada</strong>, Natural<br />
Resources <strong>Canada</strong>. 2008. National Framework <strong>Canada</strong><br />
Lands Administrative Boundaries Level 1. Available at:<br />
http://www.geogratis.ca/ (14/04/2009).
Map 5.
Table 6. Intact forest landscapes by Aboriginal treaty.<br />
Treaty name<br />
28 | Section 2. Intact forest landscapes<br />
Treaty area<br />
(ha)<br />
Intact forest<br />
landscapes<br />
(ha)<br />
Percent<br />
intact<br />
Treaty 1 1871 4,907,721 152,192 3.1<br />
Treaty 2 1871 8,747,873 1,184,207 13.5<br />
Treaty 3 1873 12,638,255 7,510,679 59.4<br />
Treaty 4 1874 19,306,653 1,025,279 5.3<br />
Treaty 5 1875 16,648,621 12,364,512 74.3<br />
Treaty 5 1908 34,177,287 32,470,547 95.0<br />
Treaty 6 1876 29,904,766 3,506,947 11.7<br />
Treaty 6 1889 3,252,415 2,486,204 76.4<br />
Treaty 7 1877 10,848,100 1,110,174 10.2<br />
Treaty 8 1899 84,875,431 51,548,905 60.7<br />
Treaty 9 1905/06 23,021,590 15,337,147 66.6<br />
Treaty 9 1929/30 35,658,471 35,415,555 99.3<br />
Treaty 10 1906 20,504,188 19,449,598 94.9<br />
Treaty 11 1921 97,839,956 67,901,986 69.4<br />
Peace and Friendship Treaties 12,681,597 1,176,727 9.3<br />
Manitoulin Island Treaty 1862 306,600 51,144 16.7<br />
Robinson-Huron 1850 6,327,792 2,672,369 42.2<br />
Robinson-Superior 1850 8,394,349 4,003,855 47.7<br />
Upper <strong>Canada</strong> Treaties 8,373,831 387,928 4.6<br />
Chekonein (Shonghees) 30 April 1850 3,311 0 0.0<br />
Chewhaytsum (Beecher Bay) 1 May 1850 6,508 12 0.2<br />
Chilcowitch (Songhees) 30 April 1850 1,371 13 0.9<br />
Kakyaakan (Beecher Bay) 1 May 1850 5,246 0 0.0<br />
Kosampson (Esquimalt) 30 April 1850 5,017 0 0.0<br />
North Saanich 11 February 1852 22,226 0 0.0<br />
Quakeolth (Kwakiutl) 8 February 1851 4,085 97 2.4<br />
Queackar (Kwakiutl) 8 February 1851 4,084 330 8.1<br />
Saalequun (Nanaimo, Nanoose) 23 December 1854 4,076 0 0.0<br />
Soke (Sook) 1 May 1850 32,380 440 1.4<br />
South Saanich (Malahat) 7 February 1852 4,959 0 0.0<br />
Swengwhung (Songhees) 30 April 1850 2,234 0 0.0<br />
Teechamitsa (Songhees) 29 April 1850 5,499 0 0.0<br />
Whyomilth (Songhees) 30 April 1850 5,067 0 0.0<br />
Williams Treaties 1923 4,845,873 1,163,369 24.0<br />
Total 1 443,367,433 260,920,216 58.8<br />
1 As the study area of GFWC’s project only covered the 11 forest ecozones, these statistics do not refer<br />
to the complete coverage of land claim and treaty area in <strong>Canada</strong>.
Cumulative access in <strong>Canada</strong>’s forest ecozones<br />
Powerlines near Saguenay, QC (10/2004)<br />
Cumulative access is the combined impact of industrial<br />
activities, which include, but are not limited to, roads,<br />
mines, clearcuts, wellsites, pipelines, transmission lines, and<br />
agricultural clearings.<br />
GFWC has analyzed the extent to which <strong>Canada</strong>’s forest<br />
ecozones have been impacted by human activities. GFWC’s<br />
cumulative access layer was compiled by analyzing Landsat<br />
(TM and ETM) satellite images for the period 988 to<br />
00 . All visible infrastructure and other human activities<br />
on the images were mapped and buffered by 00 metres.<br />
Map provides a national picture of the cumulative extent<br />
of access within <strong>Canada</strong>’s forest ecozones. Table 7 presents<br />
the area and percentage results of access by forest ecozone<br />
as well as nationally.<br />
The results indicate that just over percent of the total<br />
area of <strong>Canada</strong>’s forest ecozones is accessed. From a<br />
Table 7. Cumulative access by forest ecozone.<br />
<strong>Forest</strong> ecozone<br />
Ecozone<br />
area (ha)<br />
Area of<br />
ecozone<br />
accessed<br />
(ha)<br />
Percent<br />
of<br />
ecozone<br />
accessed<br />
Atlantic Maritime 20,151,483 15,399,153 76.4<br />
Boreal Cordillera 47,071,039 2,236,683 4.8<br />
Boreal Plains 74,062,933 33,355,347 45.0<br />
Boreal Shield 188,640,692 45,948,003 24.4<br />
Hudson Plains 37,565,744 600,800 1.6<br />
Mixed Wood Plains 11,339,105 8,536,603 75.3<br />
Montane Cordillera 48,975,931 19,811,286 40.5<br />
Pacific Maritime 20,873,620 5,689,362 27.3<br />
Taiga Cordillera 26,695,320 499,065 1.9<br />
Taiga Plains 65,773,771 9,620,222 14.6<br />
Taiga Shield 139,314,737 3,915,278 2.8<br />
Total 680,464,374 145,611,802 21.4<br />
regional perspective, the most accessed are the eastern<br />
Atlantic Maritime and the Mixed Wood ecozones, with<br />
each being more than 7 % accessed. The Boreal Plains<br />
and the Montane Cordillera ecozones are also significantly<br />
accessed at % and 0%, respectively.<br />
The most northern and remote forest ecozones (the Boreal<br />
Cordillera, the Taiga Shield, the Taiga Cordillera and the<br />
Hudson Plains) each have less than % cumulative access.<br />
Table 8 provides statistics on the percentage of accessed<br />
forest ecozone by Province. Four jurisdictions – Alberta,<br />
British Columbia, Ontario and Québec – contain almost<br />
77% of <strong>Canada</strong>’s accessed forest ecozone area.<br />
The three maritime provinces (New Brunswick, Prince<br />
Edward Island and Nova Scotia) each have over 70% of<br />
their forest ecozones accessed. Alberta is the fourth most<br />
accessed province at 7%.<br />
Six jurisdictions – British Columbia, Ontario, Québec,<br />
Saskatchewan, Newfoundland and Labrador, and Manitoba<br />
– each have between 0% and % of their forest ecozone<br />
area accessed. The Northwest Territories, Yukon and<br />
Nunavut each have less than % of their forest areas<br />
accessed.<br />
Table 8. Cumulative access in forest ecozones by jurisdiction.<br />
Province/territory<br />
Provincial/<br />
territorial<br />
forest<br />
ecozone area<br />
(ha)<br />
Area of<br />
forest<br />
ecozone<br />
accessed<br />
(ha)<br />
Percent<br />
of forest<br />
ecozone<br />
accessed<br />
New Brunswick 7,299,874 5,911,681 81.0<br />
Prince Edward<br />
Island<br />
593,012 437,852 73.8<br />
Nova Scotia 5,562,603 3,948,814 71.0<br />
Alberta 50,672,649 23,837,235 47.0<br />
British Columbia 94,709,033 31,385,860 33.1<br />
Ontario 98,953,976 25,727,265 26.0<br />
Québec 130,430,760 30,875,057 23.7<br />
Saskatchewan 41,158,212 6,730,055 16.4<br />
Newfoundland and<br />
Labrador<br />
39,022,812 4,512,746 11.6<br />
Manitoba 57,883,340 5,909,506 10.2<br />
Northwest<br />
Territories<br />
95,539,825 4,243,873 4.4<br />
Yukon 47,851,969 2,090,600 4.4<br />
Nunavut 10,786,309 1,258 0.0<br />
Total 680,464,374 145,611,802 21.4<br />
GFWC | Atlas of <strong>Canada</strong>’s Intact <strong>Forest</strong> Landscapes| 29
30 | Section 2. Intact forest landscapes<br />
Map 6 - key data sources:<br />
•<br />
•<br />
Cumulative anthropogenic (primarily industrial) access<br />
dataset (“<strong>Canada</strong> Access- Combined”) created by <strong>Global</strong><br />
<strong>Forest</strong> <strong>Watch</strong> <strong>Canada</strong>. 2009. Available at: http://www.<br />
globalforestwatch.ca/datawarehouse/datawarehouse.<br />
htm (14/04/2009).<br />
Terrestrial ecozones: Agriculture and Agri-Foods <strong>Canada</strong>.<br />
1999. A National Ecological Framework for <strong>Canada</strong>.<br />
Available at: http://sis.agr.gc.ca/cansis/nsdb/ecostrat/<br />
intro.html (14/04/2009). (<strong>Forest</strong> ecozones are those<br />
11 terrestrial ecozones that have 15% or more forest<br />
cover and include: Atlantic Maritime, Mixed Wood<br />
Plains, Boreal Cordillera, Boreal Plains, Boreal Shield,<br />
Hudson Plains, Taiga Cordillera, Taiga Plains, Taiga Shield,<br />
Montane Cordillera, Pacific Maritime.)
Map 6.
Recent anthropogenic changes to <strong>Canada</strong>’s forest landscapes<br />
(1990-2001)<br />
As well as mapping and analyzing<br />
long term cumulative access due to<br />
human activities within <strong>Canada</strong>’s<br />
forest ecozones, GFWC has also<br />
mapped recent industrial-caused<br />
changes for a large study area, for<br />
which we measured the amount<br />
and rate of industrial change over<br />
time. GFWC selected a ,89 ,000<br />
km study area that covers %<br />
of <strong>Canada</strong>’s forest ecozones. This<br />
study area was selected as it is an<br />
“interface” zone, where major<br />
industrial activities are advancing<br />
into intact forest landscapes.<br />
GFWC employed a standard<br />
methodology to detect<br />
anthropogenic changes throughout<br />
these forested landscapes. Satellite images of earlier years<br />
(from the 98 to 99 period) were compared to more<br />
recent scenes (from the 000 to 00 period) to measure<br />
the changes to forest landscapes for an approximately -<br />
year period ( 990- 00 ).<br />
This study area includes portions of eight jurisdictions (British Columbia,<br />
Alberta, Saskatchewan, Manitoba, Ontario, Québec, Yukon and<br />
Northwest Territories) and portions of six forest ecozones (Montane<br />
Cordillera, Taiga Plains, Boreal Plains, Boreal Shield and Hudson Plains).<br />
32 | Section 2. Intact forest landscapes<br />
A<br />
Maps 7-9 - key data sources:<br />
•<br />
•<br />
•<br />
B C<br />
Figure 1. Example: satellite images and GFWC’s extracted changes. (A) September 15, 1990;<br />
(B) September 16, 1999; (C) GFWC’s extracted changes. (Landsat images, Path 45/Row 22)<br />
Maps 7-9 show that within some jurisdictions and<br />
ecological units there is significant recent anthropogenic<br />
change. For example:<br />
• Alberta, Ontario and Québec have had more than<br />
a 0% change in a number of their ecodistricts<br />
(five, five and three, respectively) in the 12 year<br />
period within the study area.<br />
• Ontario has had eleven watersheds and Québec<br />
has had five watersheds more than 10% changed<br />
during the year period).<br />
Anthropogenic change data: unpublished 2008 <strong>Global</strong><br />
<strong>Forest</strong> <strong>Watch</strong> <strong>Canada</strong> data mapped from Landsat<br />
imagery - multi-spectral scanner.<br />
Watersheds (Fundamental Drainage Areas):<br />
Government of <strong>Canada</strong>, Natural Resources <strong>Canada</strong>,<br />
<strong>Canada</strong> Centre for Remote Sensing, The Atlas of<br />
<strong>Canada</strong>. 2003. National Scale Frameworks Hydrology -<br />
Drainage Areas, <strong>Canada</strong>. Available at: http://geogratis.<br />
cgdi.gc.ca/download/frameworkdata/drainage_areas/<br />
(14/04/2009).<br />
Terrestrial ecozones: Agriculture and Agri-Foods<br />
<strong>Canada</strong>. 1999. A National Ecological Framework for<br />
<strong>Canada</strong>. Available at: http://sis.agr.gc.ca/cansis/nsdb/<br />
ecostrat/intro.html (14/04/2009).
Map 7.
Map 8.
Map 9.
Fragmentation as a result of recent anthropogenic change<br />
In addition to amount of change, fragmentation is an<br />
important measure of the impact of anthropogenic<br />
changes within ecological units. Fragmentation is the<br />
breaking up of a habitat, ecosystem or landscape into<br />
smaller, disconnected pieces. Although natural disturbances<br />
fragment the landscape, human activities are also agents of<br />
fragmentation. Examples of anthropogenic fragmentation<br />
include roads, cleared lands, urbanization and other human<br />
developments. Some conservationists identify habitat<br />
destruction (and its by-product, habitat fragmentation) by<br />
humans as the major cause of species extinctions in recent<br />
human history.<br />
( ) Cornell Laboratory of Ornithology. What is <strong>Forest</strong> Fragmentation<br />
and Why is it Important? Available online at: http://birds.cornell.<br />
edu/bfl/gen_instructions/fragmentation.html (2) Saunders D, Hobbs<br />
RJ, Margules CR. 99 . Biological consequences of ecosystem fragmentation:<br />
a review. Conservation Biology, ( ): 8- . ( ) Harrison S, Bruna<br />
E. 999. Habitat fragmentation and large-scale conservation: What do<br />
we know for sure? Ecography : - .<br />
( ) Millennium Ecosystem Assessment, 00 . Ecosystems and<br />
Human Well-being: Biodiversity Synthesis. World Resources Institute,<br />
Washington, DC. Available at: http://www.millenniumassessment.<br />
org/documents/document. .aspx.pdf ( /0 / 009). ( ) Tilman D,<br />
Lehman CL, Nowak MA. 99 . Habitat destruction and the extinction<br />
debt. Nature 7 ( 9 ): - . ( ) Wilcox BA, Murphy DD. 98 . Conservation<br />
strategy: the effects of fragmentation on extinction. American<br />
Naturalist : 879-887. See also: ( ) Wilcove DS, McLellen CH, Dobson<br />
A. 98 . Habitat fragmentation in the Temperate Zone. Pp 7- in:<br />
Soule M (ed.). Conservation Biology. Sunderland, MA: Sinauer Associates<br />
Inc. 8 pp. ( ) Harris LD. 988. The nature of cumulative impacts<br />
on biotic diversity of wetland vertebrates. Environmental Management<br />
( ): 7 - 9 . ( ) Saunders DA, Hobbs RJ, Margules CR. 99 . Biological<br />
consequences of ecosystem fragmentation: a review. Conservation<br />
Biology ( ): 8- . (7) Meffe GK, Carroll CR (and contributors). 99 .<br />
Principles of Conservation Biology. Sunderland, MA: Sinauer Associates<br />
Inc. 00 pp. (8) Hunter ML. 99 . Fundamentals of Conservation Biology.<br />
Cambridge, MA: Blackwell Science Inc. 8 pp.<br />
36 | Section 2. Intact forest landscapes<br />
Clearcuts and roads north of Kakwa, AB (07/2004)<br />
Using the assessment of anthropogenic changes to forest<br />
landscapes for the 990 to 00 period described in<br />
the previous section, the amount of fragmentation was<br />
analyzed within ecodistricts and within watersheds.<br />
The amount of fragmentation was calculated as follows:<br />
Change Area + Fragmented Area<br />
x<br />
Total <strong>Forest</strong> Ecozone Area<br />
100<br />
Maps 0 and show that Alberta has a much higher<br />
amount of fragmentation within both ecodistricts and<br />
watersheds than any other province or territory within<br />
the study area. If the anthropogenic changes over the<br />
year study period were considered as the only historic<br />
disturbances in Alberta’s forest regions, 9 out of 99<br />
ecodistricts (8. million ha) and out of 08 watersheds<br />
(7.7 million ha) would have more than 0% of their area<br />
no longer considered to be large intact forest landscapes<br />
(> 0,000 ha).<br />
Maps 10-11 - key data sources:<br />
•<br />
•<br />
•<br />
Anthropogenic change data: unpublished 2008 <strong>Global</strong><br />
<strong>Forest</strong> <strong>Watch</strong> <strong>Canada</strong> data mapped from Landsat imagery<br />
- multi-spectral scanner.<br />
Watersheds (Fundamental Drainage Areas): Government<br />
of <strong>Canada</strong>, Natural Resources <strong>Canada</strong>, <strong>Canada</strong> Centre<br />
for Remote Sensing, The Atlas of <strong>Canada</strong>. 2003. National<br />
Scale Frameworks Hydrology - Drainage Areas, <strong>Canada</strong>.<br />
Available at: http://geogratis.cgdi.gc.ca/download/<br />
frameworkdata/drainage_areas/ (14/04/2009).<br />
Terrestrial ecozones: Agriculture and Agri-Foods <strong>Canada</strong>.<br />
1999. A National Ecological Framework for <strong>Canada</strong>.<br />
Available at: http://sis.agr.gc.ca/cansis/nsdb/ecostrat/<br />
intro.html (14/04/2009).
Map 10.
38 | Section 2. Intact forest landscapes Map 11.
Recent anthropogenic changes (1990-2001) adjacent to intact forest<br />
landscape fragments<br />
Intact forest landscape fragments have been<br />
disconnected from larger areas of intact forest<br />
landscapes. To determine which fragments<br />
may be most threatened by potential future<br />
expansion of current human activities, we<br />
examined the amount of recent anthropogenic<br />
change for the 990 to 00 period that<br />
occurred within a 0 km radius of forest<br />
landscape fragments.<br />
Map illustrates the relationship between<br />
intact forest landscape fragments and recent<br />
anthropogenic changes adjacent to (that is,<br />
within 0 km of) them. Table 9 provides the<br />
statistics based on this analysis. These statistics<br />
show that the area of intact forest landscape<br />
fragments which are adjacent to recent<br />
anthropogenic changes is highest in Ontario<br />
and Québec.<br />
Table 9. Intact forest landscapes fragments adjacent to recent anthropogenic change (1900-2001) by province.<br />
0-10% change within 20 km radius >10% change within 20 km radius Total<br />
Number of<br />
intact forest<br />
landscape<br />
fragments<br />
Percent<br />
intact forest<br />
landscape<br />
fragments<br />
Area of<br />
intact forest<br />
landscape<br />
fragments<br />
(ha)<br />
Clearcuts in southern British Columbia (06/2006)<br />
Number<br />
of intact<br />
forest<br />
landscape<br />
fragments<br />
Percent<br />
intact forest<br />
landscape<br />
fragments<br />
Area of<br />
intact forest<br />
landscape<br />
fragments<br />
(ha)<br />
Number<br />
of intact<br />
forest<br />
landscape<br />
fragments<br />
Area of<br />
intact forest<br />
landscape<br />
fragments<br />
(ha)<br />
Alberta 299 97 3,999,556 8 3 93,361 307 4,092,917<br />
British<br />
Columbia<br />
190 99 2,710,777 2 1 28,914 192 2,739,691<br />
Manitoba 135 100 2,044,573 0 0 0 135 2,044,573<br />
Northwest<br />
Territories<br />
84 100 1,088,566 0 0 0 84 1,088,566<br />
Ontario 248 74 3,735,451 86 26 1,253,560 334 4,989,011<br />
Québec 228 72 3,157,375 88 28 1,309,448 316 4,466,823<br />
Saskatchewan 99 97 1,504,970 3 3 59,029 102 1,563,999<br />
Total 1,283 87 18,241,267 187 13 2,744,312 1,470 20,985,579<br />
Map 12 - key data sources:<br />
•<br />
•<br />
Anthropogenic change data: unpublished 2008 <strong>Global</strong><br />
<strong>Forest</strong> <strong>Watch</strong> <strong>Canada</strong> data mapped from Landsat<br />
imagery - multi-spectral scanner.<br />
Intact forest landscapes: <strong>Global</strong> <strong>Forest</strong> <strong>Watch</strong> <strong>Canada</strong>.<br />
2009. <strong>Canada</strong>’s <strong>Forest</strong> Landscape Fragments: A<br />
Second Approximation. Available at: http://www.<br />
globalforestwatch.ca/datawarehouse/datawarehouse.<br />
htm (14/04/2009).<br />
GFWC | Atlas of <strong>Canada</strong>’s Intact <strong>Forest</strong> Landscapes| 39
40 | Structure of the Atlas Map 12.
Section contained maps of <strong>Canada</strong>’s intact forest<br />
landscapes and a basic analysis of the extent and<br />
distribution of these areas. It also provided some key<br />
information on the distribution of these areas by ecozones<br />
and provinces, and in terms of tree cover.<br />
Section examines the extent and distribution of these<br />
intact forest landscapes in relation to key ecological values.<br />
In effect, this section attempts to establish a possible<br />
methodology for identifying what can be called “the best<br />
of what’s left,” that is, the most valuable of these areas<br />
from an ecological perspective. This section also includes<br />
a map of existing interim and fully protected areas to<br />
illustrate where intact forest landscapes are protected<br />
already and where gaps remain.<br />
Although intact forest landscapes have intrinsic value in<br />
themselves, identifying “where is the best of what’s left?”<br />
within intact forest landscapes is challenging due to the<br />
limited amount of information on most remaining intact<br />
areas. It is also difficult to evaluate trade-offs in various<br />
prioritization schemes, as value judgments are required<br />
and values vary widely. In addition, the methodologies that<br />
have been developed for identifying and prioritizing values<br />
may not yet be sufficiently refined in order to receive<br />
widespread acceptance.<br />
Because of these challenges, GFWC approached the identification<br />
of “where is the best of what’s left?” within intact<br />
forest landscapes using select indicators as illustrative only.<br />
We do not presume that this is the only, or the best,<br />
analytical approach possible. More detailed data on some<br />
indicators internally held by various governments and<br />
industrial sectors could provide a more accurate analysis,<br />
regardless of the approach taken. However, many<br />
indicators were not included in our map analysis simply<br />
because broad-scale inventories are not yet available or<br />
have not yet been undertaken. More consultation with<br />
Canadians is required in order to identify, categorize and<br />
prioritize key ecological values.<br />
We do not presume, either, that the geographic areas we<br />
present in this section are the only areas that deserve<br />
enhanced attention. For example, woodland caribou and<br />
grizzly bear ranges need enhanced attention as these<br />
species are in decline in significant areas nationwide.<br />
3. The best of what’s left<br />
Cedar trees near Whistler, BC (08/2005)<br />
Our results are a very broad landscape-scale illustration of<br />
focal areas that may warrant enhanced conservation and<br />
stewardship attention. But the approach we take in this<br />
section is not an exhaustive study on this topic.<br />
GFWC selected and mapped, in -kilometre grid cells,<br />
7 key ecological values for all of <strong>Canada</strong>’s intact forest<br />
landscapes: soil organic carbon; net biome productivity;<br />
wetlands; lakes and rivers; potential old-growth; species<br />
diversity (reptiles and amphibians, birds, mammals, trees);<br />
and, key focal species (woodland caribou). For more<br />
information on how we performed our analysis, please see<br />
page .<br />
GFWC | Atlas of <strong>Canada</strong>’s Intact <strong>Forest</strong> Landscapes| 41
Soil organic carbon<br />
It is estimated that nearly 0% of the earth’s soil organic<br />
carbon is locked in tundra and boreal ecosystems.<br />
Approximately 7 % of <strong>Canada</strong> consists of these<br />
ecosystems, which suggests that <strong>Canada</strong> contains a very<br />
significant portion of the world’s stored carbon. Most<br />
of the organic carbon found in Canadian soils occurs<br />
at mid and high latitudes (northward from the southern<br />
limit of the boreal forest) where cryosolic and organic<br />
soils dominate. Since much of <strong>Canada</strong>’s boreal and taiga<br />
is covered by intact forest landscapes, these areas are<br />
important repositories of soil organic carbon, especially in<br />
peatlands. Consequently, soil organic carbon was selected<br />
as a key ecological value for our “best of what’s left”<br />
mapping.<br />
Map illustrates the distribution of soil organic carbon<br />
within intact forest landscapes in <strong>Canada</strong>. The distribution<br />
of carbon in soils is identified as kilograms of carbon per<br />
square metre and is classified into five categories. The total<br />
amount of soil carbon are expressed in terms of billions<br />
of tonnes.<br />
<strong>Canada</strong>’s 9 million hectares of intact forest landscapes<br />
contain just over 77 billion tonnes of organic carbon<br />
within its soils (see Table 0). Approximately one-half of<br />
the intact forest landscapes of <strong>Canada</strong> contain almost 88%<br />
( .8 B tonnes) of the organic carbon present in all of<br />
the intact forest landscape soils. Most of this soil organic<br />
carbon is within just two jurisdictions – Ontario and the<br />
Northwest Territories.<br />
Natural Resources <strong>Canada</strong>. 007. Climate Change Impacts and<br />
Adaptations. Sensitivities to Climate Change in <strong>Canada</strong>: Soil Organic<br />
Carbon. Online at: http://adaptation.nrcan.gc.ca/sensitivities/8_e.php<br />
( /0 / 009)<br />
42 | Section 3. The best of what's left<br />
Map 13 - key data sources:<br />
•<br />
•<br />
Canadian Shield rock outcrop (little soil organic carbon) in Ontario<br />
(06/2005)<br />
Table 10. Soil organic carbon content within intact forest<br />
landscapes.<br />
Soil organic carbon<br />
category (kg/m2 )<br />
Area of intact<br />
forest landscape<br />
(ha)<br />
Organic carbon<br />
content (billion<br />
tonnes)<br />
0.00 - 6.9 90,336,418 3.57<br />
6.9 - 12.1 65,299,339 6.21<br />
12.1 - 19.7 77,745,913 12.04<br />
19.7 - 45.8 108,780,390 32.34<br />
45.8 - 356.7 127,152,849 123.46<br />
Total 469,314,909 177.62<br />
Soil organic carbon: Tarnocai C, Lacelle B. 1996. Soil Organic<br />
Carbon Digital Database of <strong>Canada</strong>. (Pers. comm.)<br />
Intact forest landscapes: <strong>Global</strong> <strong>Forest</strong> <strong>Watch</strong> <strong>Canada</strong>. 2009.<br />
<strong>Canada</strong>’s <strong>Forest</strong> Landscape Fragments: A Second Approximation.<br />
Available at: http://www.globalforestwatch.ca/datawarehouse/<br />
datawarehouse.htm (14/04/2009).
Map 13.
Net biome productivity<br />
Net biome productivity (NPB) is the net carbon balance<br />
of forest landscapes and is the difference between carbon<br />
dioxide (CO ) uptake by assimilation and CO losses<br />
through plant and soil respiration. Areas with a positive<br />
NPB balance are carbon sinks and play an important role<br />
in the amelioration of global warming.<br />
Map displays net biome productivity within <strong>Canada</strong>’s<br />
intact forest landscapes. Table provides a summary of<br />
the total area of intact forest landscapes according to their<br />
carbon status.<br />
Over million ha or % of <strong>Canada</strong>’s intact forest<br />
landscapes are identified as major carbon sinks while over<br />
million ha are major carbon sources, according to<br />
000- 00 data. Another million ha are considered to<br />
have neutral carbon flux. There is no data for 144 million<br />
ha as only forests and wetlands are considered – no data<br />
areas are mostly lakes, rivers, tundra in the northern<br />
portion of the Taiga ecozones and high elevation areas in<br />
the Rocky Mountains.<br />
44 | Section 3. The best of what's left<br />
Table 11. Net biome productivity of intact forest landscapes<br />
(2000-2003).<br />
Carbon<br />
(g of carbon / m2 / year)<br />
Intact area (ha) Percent of IFL<br />
Major carbon source<br />
(-1,170 - -6)<br />
116,921,600 34.0<br />
Neutral carbon flux<br />
(-6 - 26)<br />
115,608,400 33.6<br />
Major carbon sink<br />
(26 - 784)<br />
111,714,600 32.5<br />
Map 14 - key data sources:<br />
•<br />
•<br />
Fire-killed trees, north of Hinton, AB (06/2004)<br />
Net Biome Productivity: Dr. Jing Chen. 2007. University of<br />
Toronto. (pers. comm.)<br />
Intact forest landscapes: <strong>Global</strong> <strong>Forest</strong> <strong>Watch</strong> <strong>Canada</strong>. 2009.<br />
<strong>Canada</strong>’s <strong>Forest</strong> Landscape Fragments: A Second Approximation.<br />
Available at: http://www.globalforestwatch.ca/datawarehouse/<br />
datawarehouse.htm (14/04/2009).
Map 14.
Wetlands<br />
photo?<br />
Wetland in northeastern Ontario (06/2005)<br />
Wetlands are critical ecological components of forest<br />
landscapes. Wetlands sustain more life than any other<br />
ecosystem. Wetlands play a major role in maintaining the<br />
stability of the global environment. They nurture hundreds<br />
of different species and provide critical breeding and<br />
rearing habitat for a wide diversity of wildlife. <strong>Canada</strong> has<br />
% of the planet’s wetlands.<br />
Map illustrates wetland distribution in relation to the<br />
occurrence of intact forest landscapes. Table contains<br />
data on the percentage of wetlands per 00 ha, the total<br />
wetland area and the percentage found within intact<br />
forest landscapes. A significant portion (almost 18 %)<br />
of <strong>Canada</strong>’s intact forest landscapes are comprised of<br />
wetlands, primarily peatlands.<br />
Wetlands within <strong>Canada</strong>’s forest landscapes are not evenly<br />
distributed across the country, as evident in Table . The<br />
provinces with the highest proportion of wetlands within<br />
their intact forest landscapes are Ontario ( %), Manitoba<br />
( 0%), and Alberta ( %). The jurisdictions with the least<br />
wetland area are Prince Edward Island (0%), Yukon ( %),<br />
British Columbia ( %), and Nunavut ( %).<br />
Atlas of <strong>Canada</strong>. 00 . Wetlands. Available at: http://atlas.nrcan.<br />
gc.ca/site/english/learningresources/theme_modules/wetlands/index.<br />
html ( /0 / 009)<br />
46 | Section 3. The best of what's left<br />
Table 12. Wetlands within intact forest landscapes.<br />
Percent wetland per<br />
100 hectares<br />
Approximate<br />
wetland area (ha)<br />
Percent of<br />
IFL area<br />
1 - 8 2,176,506 0.5<br />
9 - 15 6,278,527 1.3<br />
16 - 28 9,357,124 1.9<br />
29 - 40 16,750,277 3.4<br />
41 - 100 52,747,191 10.8<br />
Total 87,309,625 17.9<br />
Table 13. Wetlands within intact forest landscapes by<br />
jurisdiction.<br />
Province<br />
Approximate<br />
wetland area<br />
(ha)<br />
IFL area (ha)<br />
Percent of<br />
IFL area<br />
Alberta 4,851,702 19,974,967 24.3<br />
British Columbia 1,804,756 58,119,773 3.1<br />
Manitoba 18,475,950 46,764,179 39.5<br />
New Brunswick 32,836 257,178 12.8<br />
Newfoundland<br />
and Labrador<br />
4,980,315 33,620,392 14.8<br />
Northwest<br />
Territories<br />
13,279,182 83,556,502 15.9<br />
Nova Scotia 162,567 943,188 17.2<br />
Nunavut 576,907 10,744,947 5.4<br />
Ontario 29,020,653 66,372,280 43.7<br />
Prince Edward<br />
Island<br />
0 0 0.0<br />
Québec 8,832,961 91,374,828 9.7<br />
Saskatchewan 4,312,536 31,092,779 13.9<br />
Yukon Territory 964,861 45,371,883 2.1<br />
Total 87,295,225 488,195,825 17.9<br />
Map 15 - key data sources:<br />
•<br />
•<br />
Land cover of <strong>Canada</strong>: Multi-Temporal Land Cover Maps<br />
of <strong>Canada</strong> using NOAA AVHRR 1-km data from 1985-2000.<br />
Available at: http://www.geogratis.ca/geogratis/en/download/<br />
thematic0.html (14/04/2009).<br />
Intact forest landscapes: <strong>Global</strong> <strong>Forest</strong> <strong>Watch</strong> <strong>Canada</strong>. 2009.<br />
<strong>Canada</strong>’s <strong>Forest</strong> Landscape Fragments: A Second Approximation.<br />
Available at: http://www.globalforestwatch.ca/datawarehouse/<br />
datawarehouse.htm (14/04/2009).
Map 15.
Lakes and rivers<br />
<strong>Canada</strong>’s intact forest landscapes contain an abundance<br />
of freshwater ecosystems, including lakes, ponds, rivers,<br />
streams, and wetlands. <strong>Canada</strong> has more lake area than<br />
any other country in the world, with lakes larger than<br />
00 square kilometres. The Great Lakes, straddling the<br />
<strong>Canada</strong>-US boundary, contain 8% of the world’s fresh<br />
lake water. <strong>Canada</strong> has two of the world’s 7 largest rivers<br />
(Mackenzie and St. Lawrence) in terms of drainage area,<br />
length and volume of discharge.<br />
Since aquatic areas are critical ecological components<br />
of forest landscapes, lakes and major rivers are mapped<br />
and analyzed within intact forest landscapes and forest<br />
fragments in Map .<br />
Table shows a range of lake and major river densities<br />
within watersheds along with the amount of intact forest<br />
landscape within each watershed category. The intact forest<br />
area(s) within a given watershed may not have the same<br />
density of lakes and rivers as the watershed as a whole;<br />
however, for our “best of what’s left” analysis, the areas<br />
of intact forest landscapes within each watershed were still<br />
all assigned the same value (i.e., the overall density for that<br />
watershed).<br />
Environment <strong>Canada</strong>. 008. Lakes. Available at: http://www.ec.gc.<br />
ca/water/en/nature/lakes/e_lakesl.htm ( /0 / 009)<br />
Environment <strong>Canada</strong>. 008. Rivers. Available at: http://www.ec.gc.<br />
ca/water/en/nature/rivers/e_riv.htm ( /0 / 009)<br />
48 | Section 3. The best of what's left<br />
Table 14. Intact forest landscapes within watersheds of<br />
varying densities of lakes and major rivers.<br />
Percent of watershed Area of intact forest landscapes<br />
covered by lakes and rivers within watershed (ha)<br />
0.0 - 1.0 51,183,000<br />
1.1 - 2.6 76,053,100<br />
2.7 - 5.1 70,452,300<br />
5.2 - 9.7 111,884,800<br />
9.8 - 38.7 158,379,200<br />
Map 16 - key data sources:<br />
•<br />
•<br />
Frosty morning near Chibougamau, QC (10/2004)<br />
Hydrology: Government of <strong>Canada</strong>, Natural Resources <strong>Canada</strong>,<br />
<strong>Canada</strong> Centre for Remote Sensing, The Atlas of <strong>Canada</strong>. 2008.<br />
National Scale Frameworks Hydrology - Drainage Network,<br />
<strong>Canada</strong>. Available at: http://geogratis.cgdi.gc.ca/download/<br />
frameworkdata/hydrology (14/04/2009).<br />
Intact forest landscapes: <strong>Global</strong> <strong>Forest</strong> <strong>Watch</strong> <strong>Canada</strong>. 2009.<br />
<strong>Canada</strong>’s <strong>Forest</strong> Landscape Fragments: A Second Approximation.<br />
Available at: http://www.globalforestwatch.ca/datawarehouse/<br />
datawarehouse.htm (14/04/2009).
Map 16.
Potential old growth<br />
Cedar grove, BC (06/2006)<br />
Old growth forests often contain endemic native<br />
species and are important areas of atmospheric<br />
carbon sequestration and carbon storehouses. Many<br />
Canadians highly value old-growth forests.<br />
Potential old growth deciduous, mixed, and conifer<br />
forest areas (the latter separated into high and low<br />
tree-canopy densities) were mapped and analyzed<br />
within intact forest landscapes. Non-treed land<br />
cover categories and areas burned between 980-<br />
000 were deleted from GFWC’s intact forest<br />
landscapes data layer. The residual treed area within<br />
intact forest landscapes was termed potential oldgrowth<br />
forest.<br />
According to our analysis, there are almost 0 million<br />
hectares of potential old growth forest in <strong>Canada</strong>’s intact<br />
forest landscapes.<br />
50 | Section 3. The best of what's left<br />
Table 15. Potential old growth deciduous, mixed, and conifer forest<br />
areas within intact forest landscapes by jurisdiction.<br />
Province<br />
Deciduous<br />
area (ha)<br />
Mixedwood<br />
area (ha)<br />
Coniferous<br />
area (ha)<br />
Total area<br />
(ha)<br />
Alberta 181,800 4,670,200 2,192,100 7,044,100<br />
British<br />
Columbia<br />
71,200 8,819,300 30,409,300 39,299,800<br />
Manitoba 15,800 1,535,900 11,039,100 12,590,800<br />
New<br />
Brunswick<br />
1,000 160,100 36,190,300 36,351,400<br />
Newfoundland<br />
and Labrador<br />
10,100 998,500 12,226,900 13,235,500<br />
Northwest<br />
Territories<br />
5,500 1,136,900 15,601,100 16,743,500<br />
Nova Scotia 32,100 594,400 4,801,400 5,427,900<br />
Nunavut 0 0 22,409,100 22,409,100<br />
Ontario 47,400 8,166,200 13,972,000 22,185,600<br />
Prince Edward<br />
Island<br />
0 0 39,989,500 39,989,500<br />
Québec 76,600 5,646,600 74,800 5,798,000<br />
Saskatchewan 29,800 2,158,300 292,500 2,480,600<br />
Yukon<br />
Territory<br />
0 791,400 0 791,400<br />
Total 471,300 34,677,800 189,198,100 224,347,200<br />
Map 17 - key data sources:<br />
•<br />
•<br />
•<br />
Land cover of <strong>Canada</strong>: Multi-Temporal Land Cover Maps<br />
of <strong>Canada</strong> using NOAA AVHRR 1-km data from 1985-2000.<br />
Available at: http://www.geogratis.ca/geogratis/en/download/<br />
thematic0.html (14/04/2009).<br />
Fire: Canadian <strong>Forest</strong>ry Service/Canadian fire management<br />
agencies (Yukon, Birtish Columbia, Alberta, Saskatchewan,<br />
Manitoba, Ontario, Québec, Newfoundland and Labrador, New<br />
Brunswick, Nova Scotia, Prince Edward Island). 2003. National<br />
Fire Database (NFDB). (Pers. comm., Canadian <strong>Forest</strong>ry Service)<br />
Intact forest landscapes: <strong>Global</strong> <strong>Forest</strong> <strong>Watch</strong> <strong>Canada</strong>. 2009.<br />
<strong>Canada</strong>’s <strong>Forest</strong> Landscape Fragments: A Second Approximation.<br />
Available at: http://www.globalforestwatch.ca/datawarehouse/<br />
datawarehouse.htm (14/04/2009).
Map 17.
Species diversity<br />
The maintenance of biodiversity is a key objective<br />
of sustainable forest management. One important<br />
component and measure of biodiversity is species diversity.<br />
As species are not evenly distributed across intact forest<br />
landscapes, the number of species within geographic<br />
areas can be assessed and mapped as another key<br />
ecological value.<br />
Using an available dataset that had been created by<br />
ecodistrict units, major species groups, each with<br />
a large variety of native common and rare species<br />
Species diversity: Environment <strong>Canada</strong>. 999. Dataset and<br />
report (Freemark K, Moore H, Forsyth DM, Sinclair ARE,<br />
White D, Barrett T, Pressey RL. 999. Identifying minimum<br />
sets of conservation sites for representing biodiversity in <strong>Canada</strong>:<br />
A complementarity approach. Technical Report Series No.<br />
xxx, Canadian Wildlife Service, Headquarters, Environment<br />
<strong>Canada</strong>, Ottawa K A 0H ). Available at: ftp://ftp.geogratis.<br />
gc.ca/Ecosystems/ ( /0 / 009).<br />
Reptile and amphibian species ranges<br />
As evident in Table 7, the intact forest landscape area<br />
covered by the two highest reptile and amphibian diversity<br />
categories (those with more than 0 species per ecodistrict)<br />
is approximately million hectares. These are mostly<br />
located in southern <strong>Canada</strong>, as evident in Map 8.<br />
Map 8 also illustrates that the intact forest landscapes in<br />
southern British Columbia (Pacific Maritime Ecozone),<br />
Ontario (Boreal Shield Ecozone), Québec (Boreal Shield<br />
Ecozone) and Nova Scotia (Atlantic Maritime Ecozone)<br />
contain the ecodistricts with the highest numbers of reptile<br />
and amphibian species.<br />
The ecodistricts with the lowest<br />
numbers of reptile and amphibian<br />
species in intact forest landscapes are<br />
found in the northern Taiga Ecozones<br />
and the Boreal Shield Ecozone of<br />
Newfoundland and Labrador.<br />
52 | Section 3. The best of what's left<br />
Table 16. Number of common, endangered, threatened and vulnerable<br />
taxa used in species diversity analyses.<br />
Status<br />
Taxonomic<br />
Common Endangered Threatened Vulnerable Total<br />
Group<br />
Mammals 123 5 5 19 152<br />
Birds 342 14 7 20 383<br />
Amphibians 37 2 0 7 46<br />
Reptiles 33 2 4 7 46<br />
Trees1 ? ? ? ? ?<br />
Total 535 23 16 53 627<br />
1 The original database did not contain information on numbers of tree species<br />
within each category.<br />
Map 18 - key data sources:<br />
•<br />
•<br />
(reptiles and amphibians; birds; mammals; trees), were<br />
selected to to provide variation within the animal and plant<br />
kingdoms. The species (excluding trees) consist of 7 taxa<br />
of common and rare species (see list in Appendix and<br />
summary in Table ).<br />
Table 17. Total intact forest landscape (IFL) area covered by<br />
varying levels of reptile and amphibian species diversity.<br />
Number of species in ecodistrict 1 IFL area (ha)<br />
0 – 2 158,459,300<br />
3 – 4 83,533,100<br />
5 – 10 169,408,600<br />
11 – 19 46,556,100<br />
20 – 41 9,820,600<br />
1 For this analysis, all the intact 1-km grid cells within each<br />
ecodistrict were assigned the same value range (the total<br />
number of species in that ecodistrict).<br />
Species diversity: Environment <strong>Canada</strong>. 1999. Dataset and report (Freemark<br />
K, Moore H, Forsyth DM, Sinclair ARE, White D, Barrett T, Pressey RL. 1999.<br />
Identifying minimum sets of conservation sites for representing biodiversity<br />
in <strong>Canada</strong>: A complementarity approach. Technical Report Series No. xxx,<br />
Canadian Wildlife Service, Headquarters, Environment <strong>Canada</strong>, Ottawa K1A<br />
0H3). Available at: ftp://ftp.geogratis.gc.ca/Ecosystems/ (14/04/2009).<br />
Intact forest landscapes: <strong>Global</strong> <strong>Forest</strong> <strong>Watch</strong> <strong>Canada</strong>. 2009. <strong>Canada</strong>’s<br />
<strong>Forest</strong> Landscape Fragments: A Second Approximation. Available at:<br />
http://www.globalforestwatch.ca/datawarehouse/datawarehouse.htm<br />
(14/04/2009).
Map 18.
Bird species ranges<br />
As evident in Table 8, the total intact forest landscape<br />
area with the highest bird species diversity category is<br />
approximately million hectares; these areas are mostly<br />
located in southern <strong>Canada</strong>.<br />
Map 9 illustrates that the intact forest landscapes in<br />
southern British Columbia (Pacific Maritime and Montane<br />
Cordillera Ecozones), the Boreal Plains Ecozone of<br />
Alberta, Saskatchewan and Manitoba, the southern Boreal<br />
Shield Ecozone of Manitoba, Ontario, and Québec contain<br />
portions of ecodistricts with the highest numbers of bird<br />
species.<br />
The intact forest landscapes of the Taiga Shield Ecozone,<br />
especially in northern Québec and northern Labrador<br />
contain ecodistricts with the lowest numbers of bird<br />
species.<br />
Table 18. Total area covered by varying levels of bird species<br />
diversity.<br />
Number of Species in Ecodistrict 1 Area (ha)<br />
38 – 81 69,473,600<br />
82 – 114 90,716,000<br />
115 - 144 130,559,600<br />
145 - 168 114,762,300<br />
169 - 218 62,266,200<br />
1 For this analysis, all the intact 1-km grid cells within each<br />
ecodistrict were assigned the same value range (the total number<br />
of species in that ecodistrict).<br />
54 | Section 3. The best of what's left<br />
Map 19- key data sources:<br />
•<br />
•<br />
Black-backed woodpecker<br />
Gerald Romanchuk<br />
Species diversity: Environment <strong>Canada</strong>. 1999. Dataset and<br />
report (Freemark K, Moore H, Forsyth DM, Sinclair ARE, White<br />
D, Barrett T, Pressey RL. 1999. Identifying minimum sets of<br />
conservation sites for representing biodiversity in <strong>Canada</strong>: A<br />
complementarity approach. Technical Report Series No. xxx,<br />
Canadian Wildlife Service, Headquarters, Environment <strong>Canada</strong>,<br />
Ottawa K1A 0H3). Available at: ftp://ftp.geogratis.gc.ca/<br />
Ecosystems/ (14/04/2009).<br />
Intact forest landscapes: <strong>Global</strong> <strong>Forest</strong> <strong>Watch</strong> <strong>Canada</strong>. 2009.<br />
<strong>Canada</strong>’s <strong>Forest</strong> Landscape Fragments: A Second Approximation.<br />
Available at: http://www.globalforestwatch.ca/datawarehouse/<br />
datawarehouse.htm (14/04/2009).
Map 19.
Mammal species ranges<br />
As evident in Table 9, the intact forest landscape area<br />
covered by the highest mammal species diversity category<br />
is approximately 8 million hectares; these areas are mostly<br />
located in southern <strong>Canada</strong>.<br />
Map 0 illustrates that the intact forest landscapes in<br />
southern British Columbia (Pacific Maritime and Montane<br />
Ecozones), northern British Columbia (Boreal Cordillera<br />
Ecozone), western Alberta (Montane Cordillera Ecozone),<br />
southern Manitoba (Boreal Plains and Boreal Shield<br />
Ecozones), large areas of southern and north central<br />
Ontario (Boreal Shield and Hudson Plains Ecozones),<br />
and small portions of southern Québec (Boreal Shield<br />
Ecozone) contain portions of ecodistricts with the highest<br />
numbers of mammal species.<br />
The intact forest landscapes in northern Taiga Shield<br />
Ecozone, especially of Québec, and the Boreal Shield<br />
Ecozone of Newfoundland contain the ecodistricts with<br />
the lowest numbers of mammal species.<br />
Table 19. Total area covered by varying levels of mammal<br />
species diversity.<br />
Number of Species in Ecodistrict 1 Area (ha)<br />
10 – 28 35,175,100<br />
29 – 34 121,108,600<br />
35 – 39 139,218,600<br />
40 – 44 104,350,600<br />
45 – 71 67,924,800<br />
1 For this analysis, all the intact 1-km grid cells within each<br />
ecodistrict were assigned the same value range (the total number<br />
of species in that ecodistrict).<br />
56 | Section 3. The best of what's left<br />
Map 20 - key data sources:<br />
•<br />
•<br />
Dragomir Vujnovic<br />
Grizzly bear mother and cub, Willmore Wilderness Park, AB (05/2008)<br />
Species diversity: Environment <strong>Canada</strong>. 1999. Dataset and<br />
report (Freemark K, Moore H, Forsyth DM, Sinclair ARE, White<br />
D, Barrett T, Pressey RL. 1999. Identifying minimum sets of<br />
conservation sites for representing biodiversity in <strong>Canada</strong>: A<br />
complementarity approach. Technical Report Series No. xxx,<br />
Canadian Wildlife Service, Headquarters, Environment <strong>Canada</strong>,<br />
Ottawa K1A 0H3). Available at: ftp://ftp.geogratis.gc.ca/<br />
Ecosystems/ (14/04/2009).<br />
Intact forest landscapes: <strong>Global</strong> <strong>Forest</strong> <strong>Watch</strong> <strong>Canada</strong>. 2009.<br />
<strong>Canada</strong>’s <strong>Forest</strong> Landscape Fragments: A Second Approximation.<br />
Available at: http://www.globalforestwatch.ca/datawarehouse/<br />
datawarehouse.htm (14/04/2009).
Map 20.
Tree species ranges<br />
As shown in Table 0, the total area covered by the highest<br />
tree species diversity category is approximately million<br />
hectares; these high diversity areas are mostly located in<br />
southern <strong>Canada</strong>.<br />
Map illustrates that the intact forest landscapes in<br />
southern British Columbia (Pacific Maritime Ecozone),<br />
southern Ontario (Boreal Shield Ecozone), small portions<br />
of southern Québec (Boreal Shield Ecozone) and Nova<br />
Scotia (Atlantic Maritime Ecozone) contain ecodistricts<br />
with the highest numbers of tree species.<br />
The intact forest landscapes in northern Taiga Ecozones,<br />
and all of the Boreal Cordillera contain ecodistricts with<br />
the lowest numbers of reptile and amphibian species.<br />
Table 20. Total area covered by varying levels of tree species<br />
diversity.<br />
Number of Tree Species<br />
in Ecodistrict1 Area within intact Percent of<br />
forest landscapes intact forest<br />
(ha)<br />
landscapes<br />
1 – 11 113,569,027 23.26<br />
12 – 18 214,294,390 43.90<br />
19 – 23 77,397,090 15.85<br />
24 – 37 68,527,651 14.04<br />
37 – 76 12,703,653 2.60<br />
1 For this analysis, all the intact 1-km grid cells within each<br />
ecodistrict were assigned the same value range (the total<br />
number of species in that ecodistrict).<br />
58 | Section 3. The best of what's left<br />
White spruce in northern Ontario (2003)<br />
Map 21 - key data sources:<br />
•<br />
•<br />
Species diversity: Environment <strong>Canada</strong>. 1999. Dataset and<br />
report (Freemark K, Moore H, Forsyth DM, Sinclair ARE, White<br />
D, Barrett T, Pressey RL. 1999. Identifying minimum sets of<br />
conservation sites for representing biodiversity in <strong>Canada</strong>: A<br />
complementarity approach. Technical Report Series No. xxx,<br />
Canadian Wildlife Service, Headquarters, Environment <strong>Canada</strong>,<br />
Ottawa K1A 0H3). Available at: ftp://ftp.geogratis.gc.ca/<br />
Ecosystems/ (14/04/2009).<br />
Intact forest landscapes: <strong>Global</strong> <strong>Forest</strong> <strong>Watch</strong> <strong>Canada</strong>. 2009.<br />
<strong>Canada</strong>’s <strong>Forest</strong> Landscape Fragments: A Second Approximation.<br />
Available at: http://www.globalforestwatch.ca/datawarehouse/<br />
datawarehouse.htm (14/04/2009).
Map 21.
Woodland caribou<br />
Table 21. Extent of woodland caribou occurrence in jurisdictions and intact forest<br />
landscapes.<br />
Province<br />
Total caribou<br />
occurrence area<br />
(ha)<br />
Percent of<br />
total<br />
Area of caribou<br />
occurrence within<br />
intact (ha)<br />
Percent within<br />
intact forest<br />
landscapes<br />
Alberta 22,557,904 4.1 11,131,554 49.3<br />
British Columbia 36,972,609 6.8 27,222,147 73.6<br />
Manitoba 41,151,652 7.5 37,178,828 90.3<br />
Newfoundland and<br />
Labrador<br />
34,996,859 6.4 29,973,042 85.6<br />
Northwest Territories 110,577,020 20.3 81,904,788 74.1<br />
Nunavut 57,087,498 10.5 10,351,202 18.1<br />
Ontario 56,552,508 10.4 53,101,030 93.9<br />
Québec 112,916,094 20.7 84,435,308 74.8<br />
Saskatchewan 33,854,932 6.2 29,824,085 88.1<br />
Yukon Territory 38,886,439 7.1 36,621,014 94.2<br />
Total 545,553,515 100.0 401,742,998 73.6<br />
A species identified as being most sensitive to a threat in<br />
a landscape is termed a focal species. It is assumed that<br />
because the most demanding species are selected as focal<br />
species, a landscape designed and managed to meet their<br />
needs will encompass the requirements of all other species<br />
similarly threatened.<br />
Woodland caribou are considered a key focal species<br />
because they are wide-ranging, sensitive to landscape<br />
disturbances, and considered by many scientists to be an<br />
umbrella species. 7 As well, relatively recent occurrence<br />
extent information is available for woodland caribou.<br />
Lambeck RJ. 997. Focal Species: A Multi-Species Umbrella for<br />
Nature Conservation. Conservation Biology ( ):8 9-8 .<br />
7 Canadian Council on Ecological Areas. 00 . Designing Protected<br />
Areas: Wild Places for Wild Life – Proceedings Summary of the Canadian<br />
Council on Ecological Areas (CCEA) and Circumpolar Protected<br />
Areas Network (CPAN) Workshop, September 9- 0, 00 , Yellowknife,<br />
Northwest Territories. Available at: http://www.ccea.org/Downloads/<br />
en_archive 00 _workshop 00 .pdf#page=88 ( /0 / 009)<br />
60 | Section 3. The best of what's left<br />
Information has been<br />
available for many years<br />
concerning ongoing<br />
population declines in<br />
<strong>Canada</strong>’s herds. A recent<br />
science study released by<br />
Environment <strong>Canada</strong> reports<br />
that 0 of 7 woodland<br />
caribou herds across <strong>Canada</strong>’s<br />
boreal region were considered<br />
to be not self-sustaining. 8<br />
A self-sustaining caribou<br />
herd is a local population<br />
of boreal caribou that on<br />
average demonstrates stable<br />
or positive population growth<br />
(λ ≥ 1.0) over the short<br />
term, and is large enough<br />
to withstand stochastic events and persist over the longterm,<br />
without the need for ongoing intensive management<br />
intervention (e.g. predator management or transplants from<br />
other populations.<br />
The remaining occurrences of this sensitive species were<br />
mapped and analyzed in relation to intact forest landscapes;<br />
see Map . Québec and the Northwest Territories each<br />
contain over 0% of the woodland caribou occurrence<br />
within intact forest landscapes (see Table ).<br />
8 Environment <strong>Canada</strong>. 2008. Scientific Review for the Identification<br />
of Critical Habitat for Woodland Caribou (Rangifer tarandus caribou),<br />
Boreal Population, in <strong>Canada</strong>. August 008. Ottawa: Environnent<br />
<strong>Canada</strong>. 7 pp. plus 80 pp Appendices. Available at: https://www.registrelep-sararegistry.gc.ca/document/default_e.cfm?documentID=<br />
7<br />
( /0 / 009).<br />
Map 22 - key data sources:<br />
•<br />
•<br />
Woodland caribou range: Canadian BEACONs Project, University<br />
of Alberta. 2007. Occurrence of Woodland and Barren-Ground<br />
Caribou (Rangifer tarandus) and Herds of Woodland Caribou in<br />
the Boreal Region of <strong>Canada</strong>.<br />
Intact forest landscapes: <strong>Global</strong> <strong>Forest</strong> <strong>Watch</strong> <strong>Canada</strong>. 2009.<br />
<strong>Canada</strong>’s <strong>Forest</strong> Landscape Fragments: A Second Approximation.<br />
Available at: http://www.globalforestwatch.ca/datawarehouse/<br />
datawarehouse.htm (14/04/2009).
Map 22.
Where is the best of what’s left?<br />
Our approach in mapping the best of what’s left involved<br />
the following steps. (We have noted in italics areas where<br />
this approach likely requires improvement.).<br />
•<br />
•<br />
•<br />
•<br />
<strong>Forest</strong> landscapes that remain ecologically intact<br />
(> 0,000 ha) and the remaining intact forest landscape<br />
fragments ( ,000- 0,000 ha for boreal ecozones;<br />
,000- 0,000 ha for temperate ecozones) were initially<br />
selected as the primary units of analysis.<br />
A short list of seven key ecological values (Soil<br />
Organic Carbon; Net Biome Productivity; Species<br />
Diversity - Combined Trees, Birds, Mammals, Reptiles<br />
and Amphibians; Key focal species – woodland<br />
caribou; Potential Old-growth; Aquatic density per<br />
watershed, and; Wetlands) (see Table a) was selected<br />
based on the availability of geospatial data. These<br />
ecological values included: physical and biological<br />
components, a range of species groups, a focus on<br />
climate amelioration values, a selection of wetland,<br />
aquatic and terrestrial values.<br />
It is important to emphasize that there are other<br />
ecological values that may be considered “key” and for<br />
which there is available geospatial data (e.g., topographic<br />
diversity). In addition, there are challenges in obtaining<br />
equally reliable spatial data of similar resolution to<br />
represent these key ecological values. They could, indeed,<br />
be misleading with respect to prioritizing conservation<br />
efforts. This is one reason why we are presenting this<br />
merely as an approach.<br />
Data for each of the seven key ecological values was<br />
acquired and clipped to the boundary of intact forest<br />
landscapes and the intact forest landscape fragments,<br />
subjected to a ranking process, and assigned into a -<br />
km grid. The resulting values were then combined into<br />
a single conservation value index.<br />
Overlaying datasets of vastly differing resolutions reduces<br />
the validity of the resulting product.<br />
Each of the seven key ecological values were ranked,<br />
based on an assumed even spread of relative ecological<br />
values, between (lowest in ecological value) and<br />
(highest in ecological value). For all seven ecological<br />
values, ranks were determined by classifying their<br />
particular unit of measurement into a maximum of<br />
quantile classes (each class, or quantile, contains an<br />
approximately equal number, or count, of features).<br />
There are many other categorization options (e.g.,<br />
equal interval; standard deviation; natural breaks).<br />
62 | Section 3. The best of what's left<br />
•<br />
•<br />
This approach is subject to scrutiny without a strong<br />
justification of the rankings based on relative ecological<br />
values. For example, the justification for equating a Rank<br />
1 of carbon with a Rank 1 of number of species of trees<br />
would need to be explicitly documented.<br />
The ranked ecological values were then combined<br />
into a single conservation value index by summing<br />
their geographical coincidence. In other words, the<br />
km grids of each ecological value were overlayed and<br />
added to calculate the combined value.<br />
There is an implicit bias when the values are combined<br />
into a single index. For example, a portion of caribou<br />
range that intersects other values receives a high ranking<br />
but loses its value for caribou if treated in isolation<br />
The resulting range of numerical sums within the<br />
conservation value index grid was then grouped<br />
into five quantile classes in order to illustrate focal<br />
areas that may warrant enhanced conservation and<br />
stewardship attention.<br />
Some indicators were not mapped because broad-scale<br />
inventories (i.e., at the scale of interest of this atlas)<br />
are either not logistically feasible or just haven’t been<br />
undertaken in enough localized areas.<br />
Maps and show that Ontario and Northwest<br />
Territories have the largest area of intact forest landscapes<br />
that contain the highest combined conservation value.<br />
The Boreal Shield, Hudson Plains and Taiga Plains are the<br />
ecozones with the largest area of intact forest landscapes<br />
that contain the highest combined conservation value.<br />
Maps 23-24 - key data sources:<br />
•<br />
•<br />
Seven key ecological values: see data sources for maps<br />
13-22.<br />
Protected areas: <strong>Global</strong> <strong>Forest</strong> <strong>Watch</strong> <strong>Canada</strong>. 2009.<br />
Protected areas of <strong>Canada</strong>. Unpublished dataset.
Table 22a. The seven key Where is the Best of What’s Left? ecological values and their categorization and ranking.<br />
Key Ecological Value Units Description Categories Ranking<br />
Soil Organic Carbon kg of carbon / m 2 Amount of carbon in the soils 0.00 - 6.9 1<br />
6.9 - 12.1 2<br />
12.1 - 19.7 3<br />
19.7 - 45.8 4<br />
Net Biome Productivity g of carbon / m 2 / year Net carbon balanace of forest<br />
landscapes<br />
Potential Old-growth<br />
<strong>Forest</strong>s<br />
Species Diversity -<br />
Combined Trees, Birds,<br />
Mammals, Reptiles<br />
and Amphibians<br />
Intact treed land cover<br />
not burned between<br />
1980 and 2000<br />
Average species<br />
diversity rank<br />
Based on forest land and<br />
transition treed shrubland<br />
categories circa 2000 not burned<br />
between 1980-2000<br />
45.8 - 356.7<br />
Major carbon source<br />
5<br />
(-1,170 - -6) 1<br />
Neutral carbon flux (-6 - 26) 3<br />
Major carbon sink (26 - 784) 5<br />
Potential old-growth based on<br />
treed intact forests not recently<br />
burned<br />
5<br />
Nearest whole value of the average species diversity rank.<br />
Individual diversity ranking was derived from quantile classification<br />
of number of species as shown in table 22b below.<br />
Key focal species Caribou occurence Present caribou occurrence Caribou occurrence 5<br />
Aquatic Density per<br />
Watershed<br />
Percent per watershed Lakes and major rivers 0.0 - 1.0 1<br />
1.1 - 2.6 2<br />
2.7 - 5.1 3<br />
5.2 - 9.7 4<br />
9.8 - 38.7 5<br />
Wetlands Percent per watershed Bogs, fens, swamps and marshes 1 - 8 1<br />
9 - 15 2<br />
16 - 28 3<br />
29 - 40 4<br />
41 - 100 5<br />
Table 22b. Individual species diversity ranks that were combined for the species diversity ecological value.<br />
Species Diversity - Number of species Based on ranges 1 - 11 1<br />
Trees<br />
12 - 18 2<br />
19 - 23 3<br />
24 - 37 4<br />
38 - 76 5<br />
Species Diversity - Number of species Based on ranges 38 - 81 1<br />
Birds<br />
82 - 114 2<br />
115 - 144 3<br />
145 - 168 4<br />
169 - 218 5<br />
Species diversity - Number of species Based on ranges 10 - 28 1<br />
Mammals<br />
29 - 34 2<br />
35 - 39 3<br />
40 - 44 4<br />
45 - 71 5<br />
Species diversity Number of species Based on ranges 0 - 2 1<br />
- Reptiles and<br />
3 - 4 2<br />
Amphibians<br />
5 - 10 3<br />
11 - 19 4<br />
20 - 41 5<br />
GFWC | Atlas of <strong>Canada</strong>’s Intact <strong>Forest</strong> Landscapes| 63<br />
1<br />
2<br />
3<br />
4<br />
5
Map 23.
Map 24.
Protected areas<br />
Protected areas provide an important and unique<br />
contribution to the conservation of natural capital. They<br />
act as benchmarks by which we can assess the sustainability<br />
of uses on the broader landscape and marine environment<br />
and measure the impacts of climate change. They conserve<br />
representative samples of natural areas and preserve<br />
ecological features and processes. They provide habitat for<br />
a diversity of wildlife. They support important regional<br />
goals, from community recreation and health to land claims<br />
settlements. Adequately connected and buffered protected<br />
areas are at the core of ecosystem-based management.<br />
<strong>Canada</strong> recognizes the International Union for the<br />
Conservation of Nature’s definition of protected areas<br />
as “an area of land and/or sea especially dedicated to the<br />
protection and maintenance of biological diversity, and<br />
of natural and associated cultural resources, and managed<br />
through legal or other effective means.” 9<br />
Protected areas are a high priority for Canadians. Protected<br />
areas in <strong>Canada</strong> are managed for multiple values, including<br />
resource conservation, public education, preservation of<br />
culturally significant sites, research, and wildlife and habitat<br />
conservation.<br />
<strong>Canada</strong> currently has over 80 million hectares of protected<br />
area and almost 9 million hectares of interim protected<br />
area for a total of 9. million hectares of protected<br />
area. This area amounts to % of <strong>Canada</strong>’s 998.9 million<br />
hectares of land area.<br />
Recognizing the important role of protected areas,<br />
GFWC has compiled an updated protected area data layer<br />
which includes both permanent and interim protected<br />
areas (see Map ). We have analyzed our intact forest<br />
landscapes data layer in relation to this protected area<br />
layer to examine how much protection exists for retaining<br />
<strong>Canada</strong>’s remaining intact forest landscapes. This analysis is<br />
presented in Tables and (page 8).<br />
We present results from our analysis in two forms. The<br />
first focuses on the total area protected within each forest<br />
ecozone. The second focuses on the area and percentage<br />
of protected areas and intact forest landscapes.<br />
Table shows the status of each forest ecozone in terms<br />
of total area protected. The results show that two<br />
9 Environment <strong>Canada</strong>. 00 . Canadian Protected Areas Status Report<br />
000- 00 . Available at: http://www.cws-scf.ec.gc.ca/publications/habitat/cpa-apc/index_e.cfm<br />
(08/09/ 008).<br />
66 | Section 3. The best of what's left<br />
ecozones are more than 20% protected (Pacific Maritime<br />
and Taiga Plain) while another four (Montane Cordillera,<br />
Taiga Cordillera, Boreal Cordillera and Taiga Shield) are<br />
more than % protected. The Mixed Wood Plain, Atlantic<br />
Maritime, Boreal Plain and Boreal Shield all have less than<br />
0% of their area with protected status, with the Mixed<br />
Wood Plain being least protected at %.<br />
Table presents results for the area of intact forest<br />
landscape layer in relation to protected areas and for<br />
area and percentage of protected areas in intact forest<br />
landscapes. The table highlights that protected areas are<br />
often composed largely of intact forest landscapes, with<br />
the exception of protected areas in the Mixed Wood Plains.<br />
The Taiga Cordillera, Boreal Cordillera, the Taiga Shield,<br />
the Hudson Plains and the Montane Cordillera have<br />
more than 90% of their protected areas in intact forest<br />
landscapes. In four other ecozones (Boreal Plains, Boreal<br />
Shield, Pacific Maritime, Taiga Plains), more than 75% of<br />
the protected area is composed of intact forest landscape<br />
while the the Atlantic Maritime’s protected area is only<br />
0% intact forest landscapes and the Mixedwood Plains’<br />
protected area is only 8% intact forest landscapes.<br />
When examined from the perspective of what percentage<br />
of intact forest landscapes are protected, the results<br />
indicate that intact forest landscapes in some ecozones are<br />
considerably less protected than in some other ecozones.<br />
The ecozones with the smallest percentage of intact<br />
forest landscapes in protected areas are the Mixed Wood<br />
Plains ( 0%), Boreal Shield ( 0%) and Hudson Plains<br />
( 0%). By contrast, four ecozones (the Atlantic Maritimes,<br />
the Montane Cordillera, the Pacific Maritime and the<br />
Taiga Plains) have more than % of their intact forest<br />
landscapes protected.<br />
The average percent protection for intact forest landscapes<br />
is %. This is higher than the overall average of %<br />
protection for the forest ecozones (see Table ).<br />
However, it is clear that challenges for the protection of<br />
intact forest landscapes in some ecozones remain (e.g.,<br />
Boreal Shield, Mixedwood Plain, Hudson Plains and Taiga<br />
Shield).<br />
Map 25- key data source:<br />
•<br />
Protected areas: <strong>Global</strong> <strong>Forest</strong> <strong>Watch</strong> <strong>Canada</strong>. 2009.<br />
Protected areas of <strong>Canada</strong>. Unpublished dataset.
Map 25.
Table 23. Total protected area (permanent and interim) by ecozone.<br />
Ecozone<br />
Permanent<br />
Area protected (ha)<br />
Interim Total<br />
Total area (ha) % protected<br />
Atlantic Maritime 1,077,304 42,285 1,119,590 20,151,483 5.6<br />
Boreal Cordillera 6,412,359 1,129,240 7,541,598 47,071,039 16.0<br />
Boreal Plains 5,212,957 772,739 5,985,697 74,062,933 8.1<br />
Boreal Shield 10,571,946 5,663,738 16,235,684 188,640,692 8.6<br />
Hudson Plain 4,018,806 362,447 4,381,254 37,565,744 11.7<br />
Mixed Wood Plains 232,304 0 232,304 11,339,105 2.0<br />
Montane Cordillera 9,358,515 0 9,358,515 48,975,931 19.1<br />
Pacific Maritime 5,338,845 0 5,338,845 20,873,620 25.6<br />
Taiga Cordillera 2,491,935 2,014,476 4,506,411 26,695,320 16.9<br />
Taiga Plain 2,935,265 11,859,264 14,794,529 65,773,771 22.5<br />
Taiga Shield 2,738,299 15,529,834 18,268,133 139,314,737 13.1<br />
Total 80,483,691 38,785,425 119,269,116 988,918,117 12.1<br />
Table 24. Status of intact forest landscapes with regards to protected area status.<br />
<strong>Forest</strong> ecozone<br />
Intact forest<br />
landscapes (ha)<br />
68 | Section 3. The best of what's left<br />
Protected intact<br />
forest landscapes<br />
area (ha)<br />
Protected intact<br />
forest landscapes<br />
(%)<br />
Protected areas<br />
in intact forest<br />
landscapes (%)<br />
Atlantic Maritime 1,836,928 558,635 30.4 49.9<br />
Boreal Cordillera 44,540,876 7,392,763 16.6 98.0<br />
Boreal Plains 27,517,456 5,038,505 18.3 84.2<br />
Boreal Shield 127,849,511 12,800,923 10.0 78.8<br />
Hudson Plains 36,797,504 4,104,907 11.2 93.7<br />
Mixed Wood Plains 175,258 17,808 10.2 7.7<br />
Montane Cordillera 26,672,966 8,533,894 32.0 91.2<br />
Pacific Maritime 14,380,619 4,680,965 32.6 87.7<br />
Taiga Cordillera 26,125,048 4,440,821 17.0 98.5<br />
Taiga Plains 48,124,275 12,592,778 26.2 85.1<br />
Taiga Shield 134,175,383 17,591,326 13.1 96.3<br />
Total 488,195,825 77,753,325 15.9 88.6
Whitebark pine, Bas-Saint-Laurent, QC (08/2004)<br />
Sustainable management needs to occur at a range of<br />
scales. In order to achieve sustainable forest management<br />
at the forest landscape level, as well as provincial and national<br />
levels, it is necessary to assemble and assess key forest<br />
conservation data, such as on forest intactness, forest<br />
fragmentation, anthropogenic disturbances, forest extent,<br />
forest structure, and species information. The intact forest<br />
landscape and human-change data generated by <strong>Global</strong><br />
<strong>Forest</strong> <strong>Watch</strong> <strong>Canada</strong>’s work will continue to assist in the<br />
broader effort to achieve sustainable forest management at<br />
multiple scales.<br />
The maps and data in this Atlas highlight that <strong>Canada</strong><br />
contains globally significant intact forest landscapes in both<br />
its boreal and temperate forests. However, the maps of<br />
cumulative access illustrate that large areas of <strong>Canada</strong>’s forest<br />
landscapes have undergone significant transformation,<br />
including much recent change (between 990 and 00 )<br />
resulting from an expansion of industrial activities. Thus,<br />
<strong>Canada</strong> has both challenges and opportunities in terms of<br />
its remaining forest resources and how to manage them<br />
sustainably for a range of ecological and human values.<br />
As evident in the protected areas maps (Maps - ) and<br />
tables (Tables - ) in Section , <strong>Canada</strong> has a solid<br />
foundation for its protected areas network. However, given<br />
the extent of its publicly-owned forest lands, <strong>Canada</strong> has<br />
an opportunity to expand its system of protected areas<br />
to more adequately protect the wildlife, habitat and other<br />
ecological values contained in its remaining intact forest<br />
landscapes.<br />
GFWC’s goal is to help achieve more sustainable forest<br />
management through the provision of maps and data. In<br />
the interests of transparency and accountability, our policy<br />
is to make data products that result from our work freely,<br />
easily and widely available for others to use and refine.<br />
4. Conclusion<br />
GFWC has undertaken mapping intact forest landscapes<br />
at smaller and smaller scales as there has been no other<br />
attempt to map intact forest landscapes for all of <strong>Canada</strong>’s<br />
forest ecozones using consistent national data. In addition<br />
to being one of few attempts world-wide to map remaining<br />
intact forest landscapes within such a large forest region<br />
( .8 million hectare area), the mapping of recent human<br />
caused changes (mainly industrial) in .9 million km of<br />
forest lands may be one of the largest geographic areas<br />
mapped in the world for anthropogenic change using such<br />
a detailed and fine-scale methodology.<br />
GFWC has identified a number of key challenges, however,<br />
to the provision of accessible data for sustainable forest<br />
management. These lessons include:<br />
• The availability of up-to-date medium-high resolution,<br />
cloud free satellite imagery at reasonable cost may<br />
be the major limiting factor in future updates and<br />
refinements to this work.<br />
•<br />
Some intensive anthropogenic disturbances, such as<br />
narrow seismic lines, and many older anthropogenic<br />
disturbances cannot be detected on more readily<br />
available and affordable satellite imagery. Therefore,<br />
we have almost certainly overestimated the amount of<br />
remaining intact forest landscapes.<br />
GFWC recognizes that conducting a project of this magnitude<br />
(mapping of intact forest landscapes within the<br />
80 million hectares of <strong>Canada</strong>’s forest ecozones cannot<br />
be achieved error-free. Thus, we continue to encourage<br />
reviewers and users of our data to send us comments.<br />
In the future, it would be desirable to both refine and expand<br />
upon our work. An obvious approach to refinement<br />
would be to use more detailed regional datasets of key<br />
conservation values and to formalize and expand a consultation<br />
process to rank various values.<br />
An important future research direction would be to map<br />
and analyze various existing and future threats to <strong>Canada</strong>’s<br />
intact forest landscapes, including industrial activities and<br />
the effects of global warming.<br />
It would also be useful to incorporate the results of this<br />
and similar studies into social, economic, and environmental<br />
analyses to aid in the improvement of forest management<br />
and conservation decisions.<br />
GFWC | Atlas of <strong>Canada</strong>’s Intact <strong>Forest</strong> Landscapes| 69
Aboriginal Treaties: The Government of <strong>Canada</strong> and<br />
the courts understand treaties between the Crown and<br />
Aboriginal people to be solemn agreements that set out<br />
promises, obligations and benefits for both parties. Starting<br />
in 70 , in what was to eventually become <strong>Canada</strong>, the<br />
British Crown entered into solemn treaties to encourage<br />
peaceful relations between Aboriginal and non-Aboriginal<br />
people. Over the next several centuries, treaties were<br />
signed to define, among other things, the respective rights<br />
of Aboriginal people and governments to use and enjoy<br />
lands that Aboriginal people traditionally occupied. Treaties<br />
include historic treaties made between 70 and 9 and<br />
modern-day treaties known as comprehensive land claim<br />
settlements. Treaty rights already in existence in 98<br />
(the year the Constitution Act was passed), and those that<br />
arose afterwards, are recognized and affirmed by <strong>Canada</strong>’s<br />
Constitution.<br />
Anthropogenic changes/disturbances: All changes or<br />
disturbances caused by humans, including (but not limited<br />
to): clearcut logging, salvage logging in burned areas, road<br />
building, reservoir construction, agricultural clearing, and<br />
petroleum and natural gas exploration and development.<br />
Disturbance: Any moderately isolated event in time<br />
that disrupts the structure of a population, community<br />
or ecosystem, and which modifies the availability of the<br />
resources in the substrate or in the physical environment.<br />
In many types of naturally-functioning intact forest<br />
landscapes, disturbances such as fires, pests and diseases<br />
are spontaneous events that shape the landscape. Human,<br />
or anthropogenic, disturbances, such as the fragmentation<br />
of landscapes and ecosystems by roads and land use, differ<br />
ecologically from natural disturbances.<br />
Focal Species: The species identified as being most<br />
sensitive to a threat in the landscape is termed the “focal”<br />
species. For example, the most area-limited species is used<br />
<strong>Canada</strong> Indian and Northern Affairs. 000. Treaties With Aboriginal<br />
People in <strong>Canada</strong>. March 000. Available at: http://www.ainc-inac.<br />
gc.ca/pr/info/is 0_e.html ( 0/0 / 009)<br />
Biology Online: http://www.biology-online.org/dictionary/Biome<br />
( 0/0 / 009)<br />
Haeussler S, Kneeshaw D. 00 . Comparing forest management to<br />
natural processes. In Burton PJ, Messier C, Smith DW, Adamowicz WL,<br />
eds. Towards sustainable management of the boreal forest. Ottawa, ON:<br />
National Research Council Research Press. Pp. 07- 8.<br />
70 | Glossary<br />
Glossary<br />
to define the minimum areas required for various habitat<br />
patches, and the most dispersal-limited species defines<br />
the configuration of patches and the characteristics of<br />
connecting vegetation. It is assumed that because the<br />
most demanding species are selected, a landscape designed<br />
and managed to meet their needs will encompass the<br />
requirements of all other species similarly threatened.<br />
<strong>Forest</strong>: <strong>Forest</strong> is a minimum area of land of 0.0 - .0<br />
hectares with tree crown cover (or equivalent stocking<br />
level) of more than 0- 0 per cent with trees with the<br />
potential to reach a minimum height of - metres at<br />
maturity in situ. A forest may consist either of closed<br />
forest formations where trees of various storeys and<br />
undergrowth cover a high proportion of the ground or<br />
open forest. Young natural stands and all plantations which<br />
have yet to reach a crown density of 0- 0 per cent or tree<br />
height of - metres are considered to be forest, as are<br />
areas normally forming part of the forest area which are<br />
temporarily unstocked as a result of human intervention<br />
such as harvesting or natural causes but which are expected<br />
to revert to forest.<br />
<strong>Forest</strong> Ecozones and Ecodistricts: <strong>Forest</strong> Ecozones:<br />
<strong>Canada</strong> has a defined hierarchical classification of<br />
ecosystems. At a simple level there are 20 ecozones: fifteen<br />
terrestrial and five marine. An ecozone is an area of the<br />
earth’s surface that represents a large ecological zone and<br />
has characteristic landforms and climate. Each ecozone<br />
is distinguished from others by its unique mosaic of<br />
plants, wildlife, climate, landforms, and human activities.<br />
Ecozones are useful for general national reporting and for<br />
placing <strong>Canada</strong>’s ecosystem diversity in a North American<br />
or global context. Of the 0 ecozones, there are that<br />
Lambeck RJ. 997. Focal Species: A Multi-Species Umbrella for<br />
Nature Conservation Author(s): Source: Conservation Biology ( ):<br />
8 9-8 .<br />
United Nations Framework Convention on Climate Change. 00 .<br />
FCCC/CP/2001/13/Add.1 (Annex – Definitions). Available at: http://<br />
unfccc.int/files/meetings/workshops/other_meetings/application/<br />
pdf/ cp7.pdf ( 0/0 / 009).<br />
( ) Natural Resources <strong>Canada</strong>. 00 . Atlas of <strong>Canada</strong> – Terrestrial<br />
Ecozones. Available online at: http://atlas.gc.ca/site/english/maps/environment/ecology/framework/terrestrialecozones<br />
( 0/0 / 009). ( )<br />
Terrestrial Ecozones of <strong>Canada</strong>. As defined and mapped by Agriculture<br />
and Agri-Food <strong>Canada</strong>. 00 . Available online at: http://sis.agr.gc.ca/<br />
cansis/nsdb/ecostrat/gis_data.html ( 0/0 / 009).
are generally considered forest ecozones based a minimum<br />
of % tree cover. 7<br />
<strong>Forest</strong> Landscape: A contiguous mosaic of ecosystems<br />
within <strong>Canada</strong>’s forested ecozones. A forest landscape<br />
may contain naturally treeless areas (see Intact <strong>Forest</strong><br />
Landscape).<br />
Fragmentation: The breaking up of a habitat, ecosystem<br />
or landscape into smaller, disconnected pieces. Although<br />
natural disturbances fragment the landscape, human<br />
activities are also agents of fragmentation. Examples of<br />
anthropogenic fragmentation include roads, cleared lands,<br />
urbanization and other human developments. 8<br />
Intact <strong>Forest</strong> Landscape Fragment: A remnant of<br />
an intact forest landscape. It is a contiguous mosaic of a<br />
naturally occurring ecosystem, including forest, bog, water,<br />
tundra, and rock outcrops, that is within a forest ecozone,<br />
and that is essentially undisturbed by significant human<br />
influence. A intact forest landscape fragment is different<br />
from an “intact forest landscape” in that it alone may not<br />
be large enough to support viable populations of most<br />
native species associated with the ecosystem and may not<br />
necessarily be large enough to be resilient to edge effects<br />
or to survive most natural disturbance events; a forest<br />
landscape fragment may be of any size. For the purposes<br />
of this <strong>Global</strong> <strong>Forest</strong> <strong>Watch</strong> <strong>Canada</strong> atlas, intact forest<br />
landscape fragments are between ,000 and 0,000 hectares<br />
for the boreal and taiga ecozones and between ,000 and<br />
0,000 hectares for the temperate forest ecozones.<br />
Indicator: Indicators are statistics or parameters that,<br />
tracked over time, provide information on trends in<br />
the condition of a phenomenon and have significance<br />
extending beyond that associated with the properties<br />
of the statistics themselves. Environmental indicators are<br />
selected key statistics which represent or summarize a<br />
significant aspect of the state of the environment, natural<br />
resource sustainability and related human activities. They<br />
focus on trends in environmental changes, the stresses<br />
causing them, how the ecosystem and its components are<br />
responding to these changes, and societal responses to<br />
prevent, reduce or ameliorate these stresses. Environmental<br />
7 Natural Resources <strong>Canada</strong>. 000. The State of <strong>Canada</strong>’s <strong>Forest</strong>s<br />
999- 000. Available at: http://bookstore.cfs.nrcan.gc.ca/detail_<br />
e.php?recid= 0 ( 0/0 / 009)<br />
8 ( ) Cornell Laboratory of Ornithology. What is <strong>Forest</strong> Fragmentation<br />
and Why is it Important? Available online at: http://birds.cornell.<br />
edu/bfl/gen_instructions/fragmentation.html (30/04/2009). (2) Saunders<br />
D, RJ Hobbs, and CR Margules. 99 . Biological consequences of<br />
ecosystem fragmentation: a review. Conservation Biology, ( ): 8- .<br />
( ) Harrison S and E Bruna. 999. Habitat fragmentation and large-scale<br />
conservation: What do we know for sure? Ecography : - .<br />
indicators are important tools for translating and delivering<br />
concise, scientifically credible information in a manner that<br />
can be readily understood and used by decision-makers at<br />
all levels of society. 9<br />
Intact <strong>Forest</strong> Landscape: A contiguous mosaic of<br />
naturally occurring ecosystems in a forest ecozone,<br />
essentially undisturbed by significant human influence.<br />
An intact forest landscape does not necessarily consist of<br />
oldgrowth trees and may not even be entirely forested.<br />
Intact forest landscapes consist of a mosaic of natural<br />
ecosystems including forest, bog, water, tundra, and rock<br />
outcrops.<br />
In some cases, such as the bog-dominated landscapes of<br />
<strong>Canada</strong>’s taiga ecozones and the mountainous landscapes<br />
of western <strong>Canada</strong>, only 0- 0% of the total area may<br />
consist of trees. 0 An intact forest landscape has the<br />
following characteristics:<br />
•<br />
•<br />
•<br />
•<br />
It is free from substantial anthropogenic fragmentation<br />
(such as settlements, roads, clearcuts, pipelines,<br />
powerlines, mines, etc.);<br />
It is free from substantial human influence for periods<br />
that ensure that it is formed by naturally occurring<br />
ecological processes (including fires, wind, and pests);<br />
It contains only naturally seeded indigenous plant<br />
species and supports viable populations of most native<br />
species associated with the ecosystem;<br />
It is large enough to be resilient to edge effects and to<br />
survive most natural disturbance events.<br />
Key conservation values: For the purposes of this atlas,<br />
key conservation values include a range of outstanding<br />
and critically important physical (e.g., lakes and rivers) and<br />
biological components (e.g., old-growth forests), a range of<br />
species groups, a focus on climate amelioration values (e.g.,<br />
carbon source and sink areas), and a selection of wetland,<br />
aquatic and terrestrial (intact forest landscapes) values for<br />
which there was spatially explicit <strong>Canada</strong>-wide information.<br />
Net Biome Productivity: the annual net absorption (or<br />
release) of carbon by forests and wetlands.<br />
9 Environment <strong>Canada</strong>. What are environmental indicators and why<br />
are they important? Available at: http://www.ec.gc.ca/soer-ree/English/<br />
Indicators/what/default.cfm#what ( 0/0 / 009)<br />
0 Lee P, Akesenov D, Laestadius L, Noguerón R, Smith W. 00 .<br />
<strong>Canada</strong>’s large intact forest landscapes. Edmonton, Alberta: <strong>Global</strong><br />
<strong>Forest</strong> <strong>Watch</strong> <strong>Canada</strong>. 8 pp. Available online at: http://www.globalforestwatch.ca<br />
( 0/0 / 009).<br />
Chen JM. 008. Net Biome Production dataset ( 9 - 00 ).<br />
GFWC | Atlas of <strong>Canada</strong>’s Intact <strong>Forest</strong> Landscapes| 71
Old-growth forests:<br />
Defining Characteristics: The unifying feature of old-growth is<br />
not age per se, but the set of characteristics shared by most<br />
forest types in the later stages of succession. A key feature<br />
is breakup of the canopy due to the mortality of individual<br />
trees as they reach maturity. This process in turn leads to<br />
the release of understory plants, accumulation of snags<br />
and downed logs, and in some cases, the emergence of<br />
secondary canopy species. Relative to younger stages, old<br />
stands have trees of many ages and sizes and have more<br />
large canopy trees, large snags, and large downed logs.<br />
Overall, structural diversity is highest in old stands, and this<br />
is reflected in unique plant and animal communities as well<br />
as high overall species richness, relative to younger stands.<br />
A Working Definition: Although it would be preferable to<br />
identify old-growth forest stands directly on the basis<br />
of the previously described structural criteria, timber<br />
inventories do not contain the required attributes.<br />
An alternative approach is to develop simple working<br />
definitions of old-growth based on known relationships<br />
between stand age and successional stage. Age-based<br />
definitions of old-growth must be defined separately for<br />
each stand type because tree species mature at different<br />
rates (see table below). Also, it should be understood that<br />
age-based definitions provide only a coarse assessment of<br />
old growth forests. 7 There is substantial variability in the<br />
rate of stand development due to local variations in soil<br />
and climate, among other factors, and timber inventories<br />
Schneider RR. 00 . Alternative Futures: Alberta’s Boreal <strong>Forest</strong>s<br />
at the Crossroads. Edmonton AB: Alberta Centre for Boreal Research.<br />
pp. Old-growth forests chapter available at: http://www.borealcentre.ca/reports/book/8%<br />
0Old% 0growth.pdf ( 0/0 / 009)<br />
Burton P, Kneeshaw D, Coates D. 999. Managing forest harvesting<br />
to maintain old growth in boreal and sub-boreal forests. For. Chron.<br />
7 : - .<br />
Stelfox JB. 99 . Relationships between stand age, stand structure,<br />
and biodiversity in aspen mixedwood <strong>Forest</strong>s in Alberta. Alberta Environmental<br />
Centre, Vegreville, AB. pp. Available at: www.borealcentre.ca/reports/reports.html<br />
( 0/0 / 009)<br />
( ) Burton P, Kneeshaw D, Coates D. 999. Managing forest<br />
harvesting to maintain old growth in boreal and sub-boreal forests.<br />
For. Chron. 7 : - . ( ) Lee P, Hanus S, Grover B. 000. Criteria<br />
for estimating old growth in boreal mixedwoods from standard timber<br />
inventory data. For. Ecol. Manage. 9: - 0.<br />
Stelfox JB. 99 . Relationships between stand age, stand structure,<br />
and biodiversity in aspen mixedwood <strong>Forest</strong>s in Alberta. Alberta Environmental<br />
Centre, Vegreville, AB. pp. (Available at: www.borealcentre.ca/reports/reports.html)<br />
( 0/0 / 009) ( ) Timoney K. 00 . Types<br />
and attributes of old-growth forests in Alberta, <strong>Canada</strong>. Nat. Areas J.<br />
: 8 - 00.<br />
7 Lee P, Hanus S, Grover B. 000. Criteria for estimating old growth<br />
in boreal mixedwoods from standard timber inventory data. For. Ecol.<br />
Manage. 9: - 0.<br />
72 | Glossary<br />
are known to systematically underestimate the age of older<br />
stands. 8<br />
Protected area: As defined by the International Union of<br />
Nature Conservation (IUCN), a protected area is an area<br />
of land and/or sea especially dedicated to the protection<br />
and maintenance of biological diversity, and of natural and<br />
associated cultural resources, managed through legal or<br />
other effective means. 9<br />
Significant human influences: Includes anthropogenic<br />
disturbances that are visible on recent (~ 990 to ~ 00 )<br />
Landsat satellite images and which are identified in<br />
available <strong>Canada</strong>-wide datasets of linear disturbances and<br />
reservoirs. There are many human uses occurring within<br />
forest landscape fragments that are not detected using<br />
Landsat images. For example: remote camps/lodges/<br />
cottages; off-highway vehicles use; hunting/fishing/<br />
trapping use.<br />
Sustainable forest management: Management that<br />
maintains and enhances the long-term health of forest<br />
ecosystems for the benefit of all living things while<br />
providing environmental, economic, social and cultural<br />
opportunities for present and future generations. 0<br />
Umbrella Species: A wide-ranging species whose<br />
requirements include those of many other species.<br />
8 Cumming S, F Schmiegelow, and P Burton. 000. Gap dynamics<br />
in boreal aspen stands: is the forest older than we think? Ecol. Appl.<br />
0:7 -7 9.<br />
19 (1) FAO - RAP. 2004. RAP Publication 2000/07. Asia-Pacific<br />
<strong>Forest</strong>ry Commission: development of national-level criteria and indicators<br />
for the sustainable management of dry forests of Asia: workshop<br />
report. (Annex 6: Definitions and basic principles of sustainable forest<br />
management in relation to criteria and indicators.) Available at: http://<br />
www.fao.org/documents/show_cdr.asp?url_file=/docrep/003/x6896e/<br />
x 89 e0e.htm ( 0/0 / 009). ( ) Environment <strong>Canada</strong>. 00 . Canadian<br />
Protected Areas Status Report 000- 00 . Available at: http://www.cwsscf.ec.gc.ca/publications/habitat/cpaapc/index_e.cfm<br />
( 0/0 / 009)<br />
0 Canadian <strong>Forest</strong> Service. 007. <strong>Forest</strong> conditions, monitoring, and<br />
reporting glossary. Natural Resources <strong>Canada</strong>, Ottawa, ON. Available at:<br />
http://cfs.nrcan.gc.ca/glossary/ /s ( 0/0 / 009).<br />
Roberge J-M, Angelstam P. 00 . “Usefulness of Umbrella Species<br />
Concept as a Conservation Tool.” Conservation Biology 18(1): 76-85
Appendix 1. Who is GFWC?<br />
<strong>Global</strong> <strong>Forest</strong> <strong>Watch</strong> <strong>Canada</strong> (GFWC) is an organization<br />
whose role is to support the stewardship and conservation<br />
of <strong>Canada</strong>’s remaining forests, by providing decision<br />
makers and civil society with timely, accurate information<br />
on their location, state, and change.<br />
In particular, this mission includes monitoring<br />
development activities occurring within and around<br />
<strong>Canada</strong>’s forests, which influence the current and future<br />
conditions of these ecosystems as well as the people who<br />
live within them. We contribute to a shift toward greater<br />
ecological sustainability in the management of natural<br />
areas by creating a compelling visual picture and analysis of<br />
current conditions, historical changes and future trends.<br />
Our vision is that <strong>Canada</strong>’s forests will be increasingly<br />
well-managed through better information that supports<br />
improved decision-making and, thereby, will provide a full<br />
range of benefits for both present and future generations.<br />
Gaspé region, QC (08/2004)<br />
GFWC | Atlas of <strong>Canada</strong>’s Intact <strong>Forest</strong> Landscapes| 73
A. Intact forest landscapes<br />
In undertaking this project, GFWC presumed all forest<br />
landscapes were unfragmented by significant (mainly<br />
industrial) human influence (see Glossary) at the outset of<br />
the study. Once the study area was defined, areas within<br />
the forest ecozones were then eliminated systematically<br />
through a mapping methodology which employed a<br />
stratified approach and increasingly detailed datasets.<br />
Step 1. Setting Study Boundary<br />
We used the Ecozones of <strong>Canada</strong> to determine the regions<br />
of interest. The study area initially covered all of <strong>Canada</strong>’s<br />
forest ecozones, for a total of 80 million hectares.<br />
Step 2. Elimination of anthropogenic<br />
disturbed areas using existing datasets<br />
The second step involved the elimination of anthropogenic<br />
disturbances through the use of readily available existing<br />
datasets that identify major industrial and other human<br />
activities (e.g., roads, other linear features, and reservoirs).<br />
This step made it possible to exclude large areas from<br />
further analysis on the basis of affordable information,<br />
which led to substantial savings in work time and in data<br />
costs.<br />
To undertake this work, GFWC applied buffers to these<br />
disturbance datasets. A zone of influence of 500 metres<br />
was applied to local roads (i.e. subdivision roads in a city<br />
or gravel roads in rural areas), airports, mines, pipelines,<br />
powerlines, reservoirs, and clearcuts. A zone of influence<br />
of ,000 metres was applied to the Trans-<strong>Canada</strong> Highway<br />
and other principal roads. The width of the zone of<br />
influence was considered conservative, given that many<br />
studies have shown that the effects of disturbance greatly<br />
exceed ,000 metres for birds, predators, and ungulates,<br />
as well as smaller wildlife. For example, one Ontario<br />
government study on wildlife areas used - and 0kilometre<br />
buffers.<br />
Davidson RJ, Gray PA, Boyd S, Cordiner GS. 000. State-of-thewilderness<br />
reporting in Ontario: Models, tools, and techniques. USDA<br />
<strong>Forest</strong> Service Proceedings RMRS-P- -Vol- : - 9.<br />
74 | Appendix 2. Methods<br />
Appendix 2. Methods<br />
The resulting layers of buffered features were combined<br />
to create an anthropogenic disturbance layer. These areas<br />
were then removed from further consideration as intact<br />
forest landscapes. Additionally, residual areas smaller than<br />
,000 hectares for the boreal/taiga ecozones and smaller<br />
than ,000 hectares for the temperate forest ecozones were<br />
removed according to the threshold sizes selected.<br />
A draft map layer of intact forest landscapes was then<br />
generated.<br />
Step 3. Elimination of further disturbed<br />
areas using satellite imagery<br />
The third (and most labour- and time-intensive) step<br />
involved using satellite imagery to identify anthropogenic<br />
disturbances in the candidate intact forest landscapes.<br />
The anthropogenic disturbance layer was overlaid with<br />
the study area layer in order to crop candidate areas.<br />
The manual identification and digitization of additional<br />
anthropogenic disturbances on satellite imagery was<br />
completed in all blocks of ,000+ hectares in the boreal/<br />
taiga ecozones and in all ,000+ hectare blocks for the<br />
temperate ecozones within the study area.<br />
This step allowed us to detect additional industrial<br />
activities, including logging, mining, roads and oil and<br />
gas facilities, for which comprehensive publicly available<br />
digital datasets do not exist. Medium-resolution satellite<br />
imagery was useful for identifying and digitizing a number<br />
of human activities for which publicly available detailed<br />
datasets were not available. For example, we were able to<br />
use Landsat images to identify and eliminate areas affected<br />
by agriculture, forestry, and road building.<br />
Note: Included in the disturbance layers that were manually created<br />
were various types of “cut lines” (relatively narrow, straight, linear disturbances).<br />
The most prevalent of these were the seismic lines that are<br />
mainly associated with oil and gas development and that are pervasive<br />
throughout much of Alberta. The simple decision rule that these linear<br />
disturbances had to be visible in the Landsat imagery to qualify for exclusion<br />
means that many areas mapped as “intact forest landscapes and<br />
forest landscape fragments” may still contain disturbances that are only<br />
clearly visible “on-the-ground.”
Various band combinations were used to enhance visibility<br />
in the satellite images (the most common combination<br />
being , , ). Visual interpretation was normally<br />
performed at a : 0,000– : 0,000 scale. Final checks were<br />
performed at : 0,000- : 00,000 and corrections were<br />
made at : 0,000- : 0,000. Areas associated with the<br />
following main types of human disturbances were excluded<br />
in Step . These areas were excluded only if positive signs<br />
of disturbance could be detected in satellite images:<br />
1. Linear and polygonal infrastructure and<br />
associated zones of influence: roads of<br />
all types; railroads; seismic and other cutlines<br />
clearly visible in satellite images; power lines and<br />
communication lines (assuming there was clearing<br />
of vegetation long the lines); pipelines; recently<br />
completely anthropogenically-converted areas, such<br />
as settlements; built-up populated and industrial<br />
areas; croplands (both current and abandoned); and<br />
reservoirs.<br />
2. Areas affected by land use in addition to<br />
those noted above: clearcuts; all types of mining<br />
and drilling activity areas; and other areas affected by<br />
industrial activity.<br />
After one interpreter completed the visual interpretation of<br />
disturbances, a second interpreter checked the accuracy of<br />
the mapping. Questionable areas were highlighted, checked<br />
and, where necessary, corrected by a third interpreter using<br />
a variety of scales and image dates. Areas of uncertainty<br />
were resolved through discussion within the interpretation<br />
team and by the use of ancillary data.<br />
Digitized linear and polygonal disturbances were buffered<br />
by an automatic process according to the nature of the<br />
disturbance before they were excluded from the dataset.<br />
Residual fragments smaller than the threshold sizes were<br />
eliminated. The result was a secondary draft map layer of<br />
forest landscape fragments.<br />
Analysis was conducted in a Geographic Information<br />
System (GIS) environment using ESRI’s ArcView v.<br />
series and Leica Geosystems’ Geographic Imaging software<br />
(formerly ERDAS). All vector and raster layers were<br />
projected in the Lambert Conformal Conic projection.<br />
This projection is used in ellipsoidal form for large-scale<br />
mapping of regions of predominantly east-west extent,<br />
including many maps in the International Map of the<br />
World ( : ,000,000-scale) series, and for topographic<br />
mapping in many nations.<br />
Step 4. Verification of results<br />
In step four, a combination of field checks, aerial photo<br />
checks, and expert review was conducted to verify the draft<br />
map of forest landscape fragments. Field expeditions were<br />
conducted in the 00 - 007 period in the unfragmented/<br />
fragmented fringe to verify the result of the image<br />
interpretation. Field teams made up of <strong>Global</strong> <strong>Forest</strong><br />
<strong>Watch</strong> <strong>Canada</strong> staff were equipped with GPS receivers and<br />
laptop computers containing relevant satellite imagery and<br />
the preliminary draft forest fragments data layer.<br />
The field verification was not based on random or<br />
systematic sampling. Rather, the strategy was to seek out<br />
points that were easily accessible by road or trail near<br />
the unfragmented/fragmented fringe, but which were<br />
within the fragmented area, and which occurred over a<br />
broad geographic range. This process allowed the general<br />
accuracy of the unfragmented/fragmented fringe to be<br />
verified. Areas of uncertainty or difficulty of interpretation<br />
were also examined.<br />
Step 5. Final analysis<br />
GIS analysis of the intact forest landscape data layer was<br />
conducted to assess their status in terms of their area and<br />
distribution by administrative and geographic units.<br />
The result of our step-wise analysis was a final map (GIS)<br />
data layer comprised of a selection of forest landscape<br />
fragments without detectable signs of human disturbance,<br />
larger than ,000 hectares.<br />
Accuracy<br />
The accuracy of the intact forest landscapes map varies<br />
across <strong>Canada</strong> depending largely on the quality and<br />
quantity of available information, primarily Landsat<br />
imagery. The Landsat imagery that was used as the<br />
basic data source has a pixel resolution of 8. metres.<br />
This means that many small and narrow anthropogenic<br />
disturbances were not detected.<br />
This might be considered by some as a disadvantage or<br />
weakness in the methodology. On the other hand, we<br />
assumed that small and narrow disturbances generally,<br />
but not universally, have less of an ecological impact than<br />
larger disturbances. We concluded that there was value in a<br />
mapping project that uses a consistent data source even if<br />
it discriminates against small disturbances.<br />
GFWC | Atlas of <strong>Canada</strong>’s Intact <strong>Forest</strong> Landscapes| 75
Owing primarily to geometric correction issues, it appears<br />
the maximum error on-the-ground was approximately 00<br />
metres although this is limited to only a few images. We<br />
therefore estimate the overall accuracy of the final dataset<br />
will be in the range of : ,000,000 - : , 00,000.<br />
Overall, the analysis is more likely to overestimate than<br />
underestimate the total area of remaining forest landscape<br />
fragments. This is inherent in the basic approach, which<br />
presumes all areas to be unfragmented by anthropogenic<br />
disturbances unless the opposite can be proven. Signs of<br />
disturbance are more likely to have been missed than to<br />
have been mistakenly found where none exist. However,<br />
it is probable that the both categories of error did occur.<br />
3 For example, there is the difficulty of distinguishing human-caused<br />
forest change such as old clearcuts, areas of selective logging where<br />
there are no roads visible on satellite images. There are other areas of<br />
human use that are not detectable on Landsat images as well, such as<br />
hunting/fishing/trapping locations, remote camps/lodges/cottages, and<br />
other “fly-in” and winter access uses.<br />
B. Cumulative access and recent anthropogenic change<br />
<strong>Global</strong> <strong>Forest</strong> <strong>Watch</strong> <strong>Canada</strong> prepared a national<br />
cumulative access dataset titled “<strong>Canada</strong> Access -<br />
Combined” that includes all the disturbances that were<br />
digitized using satellite imagery during the intact forest<br />
landscape and forest fragments mapping process plus other<br />
existing datasets of human access such as roads, mines<br />
and reservoirs. This dataset is currently unpublished and<br />
copyright-restricted.<br />
<strong>Global</strong> <strong>Forest</strong> <strong>Watch</strong> <strong>Canada</strong> employs a standard<br />
methodology to detect anthropogenic changes throughout<br />
forested landscapes. Because landscape features reflect<br />
distinctive patterns to optical remote sensing platforms,<br />
remote sensing software algorithms, in combination with<br />
human editing, were used to reliably process anthropogenic<br />
change. This methodology is described in detail in previous<br />
<strong>Global</strong> <strong>Forest</strong> <strong>Watch</strong> <strong>Canada</strong> publications.<br />
The first step is to employ a change detection algorithm<br />
in remote sensing based software; for this analysis we<br />
used Leica Geosystem’s ERDAS Imagine. This algorithm<br />
compares the spectral reflectance of the images in a<br />
spectral band (we chose band ) and, if the values exceed a<br />
set threshold, the area is marked as change. We repeat this<br />
process numerous times, setting the percent differencing<br />
E.g., see: Lee P, Gysbers JD. 008. Recent Anthropogenic Changes<br />
within the Inland Temperate Rainforest of British Columbia: Interim<br />
Report (A <strong>Global</strong> <strong>Forest</strong> <strong>Watch</strong> <strong>Canada</strong> Report). Edmonton, Alberta:<br />
<strong>Global</strong> <strong>Forest</strong> <strong>Watch</strong> <strong>Canada</strong>. 9 pp.<br />
76 | Appendix 2. Methods<br />
West of Chapleau, ON. (06/2005)<br />
at different levels in order to best extract these change<br />
features, depending on the image quality. Once this<br />
automated change detection process is completed for<br />
each image, the change detection files are passed on to an<br />
analyst who then manually reviews the images. The first<br />
manual pass over each of the change analysis results is<br />
to identify and remove features which do not represent<br />
anthropogenic change between the time periods. It also<br />
provides the opportunity to identify changes that were<br />
not picked up through the automatic processing. To do<br />
so the image analyst views the earlier and recent period<br />
Landsat images and traces anthropogenic features that<br />
are not visible in the first period image. The general band<br />
combinations for reviewing the images are either false<br />
colour , , or natural colour , , composites.<br />
Another analyst then reviews the completed product and<br />
interprets the image again for any inclusions or exclusions<br />
that should not form part of the dataset. Areas where there<br />
is a discrepancy in interpretation are discussed and resolved<br />
by the analysts, sometimes with the use of ancillary data.
Appendix 2. Data<br />
A. List of Landsat images used in intact forest landscape mapping<br />
Note: Landsat TM and ETM+ imagery; exact dates were not available for all images used.<br />
Path Row Date 1 Date 2 Date 3 Date 4<br />
2 26 03/07/2000 12/10/1993<br />
2 27 01/07/1999 12/10/1993<br />
3 25 02/09/2002 03/08/1994<br />
3 26 01/10/2001 27/08/2000 31/07/1987<br />
3 27 01/10/2001 24/06/2000 09/09/1990<br />
4 25 21/08/2001 25/08/1988<br />
4 26 05/08/2001 31/08/1990<br />
4 27 21/06/2002 31/08/1990<br />
5 23 16/09/2002 22/07/1999 20/09/1989<br />
5 24 16/09/2002 13/09/2001 06/08/1990<br />
5 25 13/09/2001 06/08/1990<br />
5 26 15/08/2002 13/09/2001 09/08/1991<br />
5 27 15/08/2002 09/08/1991<br />
6 22 20/09/2001 06/09/1993<br />
6 23 20/09/2001 18/08/1992<br />
6 24 20/09/2001 15/06/1992<br />
6 27 20/09/2001 20/07/1987<br />
6 28 22/08/2002 16/06/2001 20/07/1987<br />
6 29 22/08/2002 16/06/2001 17/07/1992<br />
7 22 28/07/2002 21/08/1999 13/09/1987<br />
7 23 28/07/2002 21/08/1999 26/09/1992<br />
7 24 28/07/2002 21/08/1999 26/09/1992<br />
7 25 28/07/2002 26/09/1992<br />
7 28 09/05/2002 04/06/2000 26/09/1992<br />
7 29 22/05/2001 26/09/1992<br />
8 22 27/07/1999 04/07/1988<br />
8 23 01/10/2000 20/09/1987<br />
8 24 14/06/2001 16/06/1993<br />
8 25 29/09/1999 15/09/1991<br />
8 26 13/07/2000 04/07/1988<br />
8 28 13/07/2000 10/05/1991<br />
8 29 13/07/2000 04/07/1988<br />
9 21 19/08/1999 11/09/1987<br />
9 22 19/08/1999 11/09/1987 18/06/2000<br />
9 23 18/06/2000 07/08/1992<br />
9 24 18/06/2000 21/08/1991<br />
9 25 24/08/2001 03/09/1990<br />
9 26 09/09/2001 18/06/2000 16/09/1989<br />
9 27 06/09/2000 07/08/1992<br />
9 28 06/09/2000 07/08/1992<br />
9 29 18/06/2000 18/06/1991<br />
9 30 20/07/2000 18/06/1991<br />
10 20 30/07/2001 01/08/1987<br />
Path Row Date 1 Date 2 Date 3 Date 4<br />
10 21 30/07/2001 01/08/1987<br />
10 22 30/07/2001 24/06/1986<br />
10 23 12/08/2000 04/09/1988<br />
10 24 27/09/1999 04/09/1988<br />
10 25 27/05/2001 04/09/1988<br />
10 26 27/09/1999 02/09/1993<br />
10 27 12/08/2000 27/09/1999 02/09/1993<br />
10 28 28/06/2001 21/07/1989<br />
10 29 29/09/2000 19/08/1988<br />
11 20 05/07/2001 09/09/1987<br />
11 21 19/06/2001 09/09/1987<br />
11 22 22/06/2002 09/09/1987<br />
11 23 22/06/2002 06/09/1992<br />
11 24 22/06/2002 16/06/1991<br />
11 25 22/06/2002 16/06/1991<br />
11 26 22/06/2002 16/06/1991<br />
11 27 09/08/2002 16/06/1991<br />
12 20 26/06/2001 27/07/1992<br />
12 22 30/09/2001 04/08/1989<br />
12 23 30/09/2001 30/09/1990<br />
12 24 29/06/2002<br />
12 25 29/06/2002 27/07/1986<br />
12 26 25/05/2001 27/07/1986<br />
12 27 25/05/2001 27/07/1986<br />
12 29 29/09/2000 19/08/1988<br />
13 19 07/08/2002 24/08/1988<br />
13 20 07/08/2002 24/08/1988<br />
13 21 21/09/2001 24/08/1988<br />
13 22 06/07/2002 05/07/1993<br />
13 23 20/06/2002 07/07/1988<br />
13 24 23/06/1905 12/06/1905<br />
13 25 23/06/1905 11/06/1905<br />
13 26 23/06/1905 11/06/1905<br />
13 27 04/08/2001 27/08/1989 23/08/2002<br />
13 28 01/06/2001 06/08/1987<br />
13 29 31/08/1999 16/06/1992<br />
14 21 21/07/1999 09/07/1992<br />
14 22 13/07/2002 19/09/1989<br />
14 23 23/05/2001 19/09/1989<br />
14 24 05/06/2000 30/06/1989<br />
14 25 22/06/1905 30/05/1989<br />
14 26 22/06/1905 08/06/1905<br />
14 27 20/05/2000 10/06/1987<br />
GFWC | Atlas of <strong>Canada</strong>’s Intact <strong>Forest</strong> Landscapes| 77
Path Row Date 1 Date 2 Date 3 Date 4<br />
14 28 08/06/2006 01/08/1989<br />
14 29 08/06/2001 13/08/1987<br />
15 19 17/07/2001 06/08/1988<br />
15 20 17/07/2001<br />
15 21 17/07/2001<br />
15 22 15/06/2001 20/07/1991<br />
15 23 30/07/2000 27/07/1990<br />
15 24 19/09/2001 21/09/1987<br />
15 25 19/09/2001 21/09/1993<br />
15 26 23/06/1905 10/06/1905 21/08/2002<br />
15 27 23/06/1905 08/06/1905<br />
15 28 15/06/2001 05/09/1987<br />
15 29 15/06/2001 29/05/1992 28/07/1999<br />
16 19 21/07/2000 12/09/1987<br />
16 21 22/08/2000 10/07/1987<br />
16 22 22/08/2000 05/07/1991<br />
16 23 06/06/2001 11/08/1987<br />
16 24 28/08/2000 25/09/1992<br />
16 25 28/08/2002 25/09/1992 27/05/2006<br />
16 26 25/08/2001 03/08/1990 27/05/2006<br />
16 27 25/08/2001 03/08/1990<br />
16 28 25/08/2001 19/08/1990<br />
16 29 22/08/2000 05/07/2000 07/10/1999 03/08/1990<br />
17 19 10/07/1999 17/07/1993<br />
17 20 15/07/2001 03/07/1988<br />
17 21 15/07/2001 03/07/1988<br />
17 22 18/07/2002 25/07/1990<br />
17 23 18/07/2002 20/06/1989<br />
17 24 13/06/2001 17/06/1988<br />
17 25 13/06/2001 17/06/1988<br />
17 26 12/06/2005 18/07/2002<br />
17 27 18/07/2002 17/06/1988<br />
17 28 15/05/2002 12/07/2000 11/05/1992<br />
17 29 12/07/2000 17/07/1993<br />
18 22 25/07/2002 18/09/1990<br />
18 23 20/08/2000 24/07/1993<br />
18 24 20/08/2000 01/06/1991<br />
18 25 25/07/2002 20/08/1991<br />
18 26 22/05/2002 20/08/1991<br />
18 27 01/05/2002 01/08/1991<br />
18 28 22/05/2002 19/09/1999 01/06/1991<br />
18 29 19/09/1999 25/08/1993<br />
18 30 29/06/2007 03/09/1999 05/05/1987<br />
18 31 10/08/2002 24/06/1988<br />
19 19 29/07/2001<br />
19 21 29/07/2001 29/06/1993<br />
19 22 29/07/2001 13/06/1993<br />
19 23 14/06/2002 03/09/1988<br />
19 24 26/06/2002 25/05/1986<br />
19 25 01/08/2000 01/09/1989<br />
19 26 27/08/2000 1989<br />
19 27 27/08/2000 14/05/1988<br />
19 28 27/08/2000 12/05/1987<br />
78 | Appendix 3. Data<br />
Path Row Date 1 Date 2 Date 3 Date 4<br />
19 29 30/10/2000 30/05/1988<br />
19 30 30/08/2001<br />
19 31 30/08/2001 11/08/1991<br />
20 22 07/07/2002 01/07/1991<br />
20 23 21/08/2001 01/07/1991<br />
20 24 14/07/1990<br />
20 26 01/06/2003 04/07/2002<br />
20 27 06/09/2001 20/06/1987<br />
20 28 06/09/2001 03/05/1987<br />
20 29 29/05/2003<br />
21 24 09/08/2000<br />
21 27 24/04/1987<br />
21 28 21/05/2000<br />
22 23 15/07/2000 23/07/1989<br />
22 24 15/07/2000 19/05/1988<br />
22 25 31/05/2001 15/07/2000<br />
22 26 13/06/2001 31/05/2001<br />
22 27 31/05/2001 22/05/1989<br />
23 22 22/07/2000<br />
23 23 10/10/2000 13/07/1991<br />
23 24 29/05/2003 17/07/2002<br />
23 25 11/12/2002 21/06/2001<br />
23 26 10/10/2000 03/07/1996 05/09/1990 27/07/1987<br />
23 27 23/06/2001 06/09/1987<br />
24 23 16/07/2001 13/07/1991<br />
24 24 18/09/2001 13/07/1991<br />
24 26 29/07/2000 21/08/1988<br />
25 21 05/06/2001<br />
25 22 06/06/2001 04/07/1991<br />
25 23 05/06/2001 14/07/1989<br />
25 24 05/06/2001 1989<br />
25 25 05/06/2001 24/10/2000 1989<br />
25 26 04/07/2000 1988<br />
26 21 11/07/2000<br />
26 22 11/07/2000 13/07/1986<br />
26 23 11/07/2000 1986<br />
26 24 11/07/2000 1987<br />
26 25 16/09/2001 1986<br />
26 26 01/07/2002 16/06/1987<br />
27 21 19/08/2000<br />
27 22 03/06/2001 21/08/1986<br />
27 23 04/09/2000 1990<br />
27 24 03/06/2001 02/05/1990<br />
27 25 18/07/2000 01/08/1999 1991<br />
27 26 22/10/2000 01/08/1991<br />
28 20 10/08/2000<br />
28 21 26/08/2000<br />
28 22 07/08/1990<br />
28 23 24/08/1999 07/08/1990<br />
28 24 26/08/2000 1988<br />
28 25 26/08/2000 1988<br />
28 26 15/07/2002 01/08/1990<br />
29 20 05/09/2001 19/06/1987
Path Row Date 1 Date 2 Date 3 Date 4<br />
29 21 05/09/2001 19/06/1987<br />
29 22 05/09/2001 26/05/1990<br />
29 23 07/10/2001 1990<br />
29 24 06/07/2002 01/05/1992<br />
29 25 16/05/2001 16/09/1999 03/08/1990<br />
29 26 07/10/2001 30/08/1990<br />
30 20 08/08/2000 14/09/1993<br />
30 21 08/08/2000 05/06/1993<br />
30 22 04/05/2000 08/08/2000 21/08/1990<br />
30 23 24/08/2000 23/09/1999 05/06/1991<br />
30 24 28/09/2001 2000 1990<br />
30 25 13/07/2005 28/09/2001 05/06/1991<br />
30 26 23/09/1999 23/07/1991<br />
31 19 18/08/2001 04/08/1993<br />
31 20 18/08/2001 20/08/1993<br />
31 21 18/08/2001 20/08/1993<br />
31 22 14/07/2000 14/06/1992<br />
31 23 14/07/2000 29/08/1999 26/05/1990<br />
31 24 31/08/1999 31/08/1991<br />
31 25 30/07/2000 31/08/1991<br />
32 18 26/09/2001<br />
32 19 26/09/2001<br />
32 20 26/09/2001 19/07/1999 26/07/1987<br />
32 21 21/07/2000 03/06/1991<br />
32 22 21/07/2000 16/06/1990<br />
32 23 26/09/2001 16/06/1990<br />
32 24 21/09/1999 07/09/1991<br />
32 25 21/09/1999 08/08/1992<br />
33 18 15/07/2001 20/08/1988<br />
33 19 17/09/2001 20/08/1988<br />
33 20 10/06/2000 20/08/1988<br />
33 21 10/07/1999 12/06/1992<br />
33 22 10/07/1999 13/08/1991<br />
33 23 27/08/1999 13/08/1991<br />
33 24 27/08/1999 07/10/1988<br />
33 25 02/07/2002 28/07/2000 15/08/1989<br />
34 17 04/06/2001<br />
34 18 09/07/2002<br />
34 19 20/06/2001<br />
34 20 03/07/2000 19/08/1985<br />
34 21 23/06/2002 19/08/1985<br />
34 22 17/06/2000 1988<br />
34 23 1999 1990<br />
34 24 06/07/2001 29/05/1990<br />
35 16 10/07/2000 26/07/1991<br />
35 17 10/07/2000 26/07/1991<br />
35 18 13/07/2001 10/07/2000 26/07/1991<br />
35 19 11/08/1991<br />
35 20 25/08/1999 05/08/1989<br />
35 21 25/08/1999 05/08/1989<br />
35 22 15/09/2001 1999 11/08/1991 1991<br />
35 23 24/07/1999 04/07/1989<br />
35 24 24/07/1999 26/07/1991<br />
Path Row Date 1 Date 2 Date 3 Date 4<br />
36 18 03/09/2000<br />
36 19 03/09/2000<br />
36 20 22/09/2001 02/06/2001 16/09/1990<br />
36 21 09/06/2001 18/08/1991<br />
36 22 22/09/2001 07/08/1993<br />
36 23 18/08/2000 27/05/1990<br />
37 16 27/07/2001 27/06/1993<br />
37 17 29/09/2001 01/09/1988<br />
37 18 29/09/2001 27/06/1993<br />
37 19 29/09/2001 30/08/1987<br />
37 20 29/09/2001<br />
37 21 29/09/2001 30/08/1987<br />
37 22 12/08/2001 30/08/1987<br />
37 23 12/08/2001 08/09/1991<br />
38 19 22/09/1993<br />
38 20 04/09/2001 02/06/1993<br />
38 21 03/08/2001 15/06/1992<br />
38 22 03/08/2001 22/09/1993 15/06/1992<br />
38 23 08/03/2001 23/08/1988<br />
39 16 06/07/2000 02/09/1989<br />
39 17 25/07/2001 02/09/1989<br />
39 18 10/06/2002<br />
39 19 10/06/2002 02/09/1989<br />
39 20 10/06/2002 06/06/1992<br />
39 21 22/09/1999 06/06/1992<br />
39 22 22/09/1999 19/05/1991<br />
39 23 23/08/2000 16/09/1994<br />
40 15 30/06/2001<br />
40 16 30/06/2001<br />
40 18 17/08/2001<br />
40 19 17/08/2001<br />
40 20 17/10/2000 13/06/1989<br />
40 21 13/07/2000 13/06/1989<br />
40 22 17/08/2001 17/10/2000 13/07/2000 22/09/1993<br />
40 23 17/08/2001 13/06/1989<br />
41 15 03/08/1999 31/08/1989<br />
41 16 05/06/2001 05/08/1991<br />
41 17 05/06/2001 25/07/1987<br />
41 18 18/07/1999 05/08/1991<br />
41 19 05/06/2001 05/08/1991<br />
41 20 02/06/2000 11/09/1987<br />
41 21 08/10/2000 1999 1992<br />
41 22 03/08/1999 11/09/1987<br />
41 26 20/09/1999 28/08/1988<br />
42 19 11/06/1992<br />
42 20 21/08/2006 14/05/2002 15/08/2001 11/06/1992<br />
42 21 22/04/2000 09/04/1988<br />
42 22 15/08/2001 13/09/2000 1990<br />
42 25 05/08/2006 28/08/2000 26/07/1985<br />
42 26 15/08/2001 10/09/1990<br />
43 15 18/07/2000 16/06/2000 20/07/1992<br />
43 16 04/09/2000 08/06/1994<br />
43 17 16/06/2000 08/06/1994<br />
GFWC | Atlas of <strong>Canada</strong>’s Intact <strong>Forest</strong> Landscapes| 79
Path Row Date 1 Date 2 Date 3 Date 4<br />
43 18 16/06/2000 20/07/1992 13/08/1989<br />
43 19 17/08/1999 06/09/1992<br />
43 20 1999 1993<br />
43 21 23/09/2001 11/10/1993<br />
43 22 23/09/2001 11/09/1988<br />
43 23 06/10/2000 11/09/1988<br />
43 24 23/09/2001 2000 1993<br />
43 25 25/06/2006 06/10/2000 04/09/1991<br />
44 18 13/06/2002<br />
44 20 15/05/2006<br />
44 21 14/09/2001 25/07/1991<br />
44 22 14/09/2001 02/09/1988<br />
44 23 14/09/2001 02/09/1988<br />
44 24 14/09/2001 02/09/1988<br />
44 25 14/09/2001 09/09/1999 02/09/1988<br />
44 26 09/09/1999 14/07/1987<br />
45 15 02/09/2000 16/07/1991<br />
45 16 30/06/2000 16/07/1991<br />
45 17 03/07/2001 07/09/1987<br />
45 18 03/07/2001 15/09/1990<br />
45 19 29/05/2000 15/09/1990<br />
45 20 2000 1990<br />
45 21 16/09/1999 1988<br />
45 22 16/09/1999 15/09/1990<br />
45 23 23/08/2002 1990<br />
45 24 17/08/2000 15/09/1990<br />
45 25 03/07/2001 09/16/1999 24/08/1988<br />
45 26 16/07/2000 2000 1998<br />
46 18 28/09/2001<br />
46 19 06/08/2001 23/05/2001 7/21/1999<br />
46 20 01/10/2002 23/07/1991<br />
46 21 22/08/1999 31/08/1988<br />
46 22 25/09/2000 23/07/1991<br />
46 23 25/09/2000 22/09/1990<br />
46 25 11/08/2001 22/09/1990<br />
46 26 11/08/2001 22/09/1990<br />
47 14 20/07/2002 14/07/1991<br />
47 15 20/07/2002 11/07/1990<br />
47 16 14/09/1999 11/07/1990<br />
47 17 14/09/1999 11/07/1990<br />
47 18 14/09/1999 11/07/1990<br />
47 19 2000 1990<br />
47 20 30/07/2000 2000 1990<br />
47 21 21/08/2002 05/10/2001 1991<br />
47 22 21/08/2002 1999 09/10/1988 1988<br />
47 23 21/08/2002 2001 1999 09/10/1988<br />
47 24 21/08/2002 1999 1988<br />
47 25 05/10/2001 13/09/1990<br />
47 26 30/07/2000 15/08/1991<br />
48 14 24/07/2001<br />
48 15 24/07/2001<br />
48 16 24/07/2001<br />
48 17 13/09/2002<br />
80 | Appendix 3. Data<br />
Path Row Date 1 Date 2 Date 3 Date 4<br />
48 18 04/08/1999<br />
48 19 04/08/1999<br />
48 20 04/08/1999 24/08/1992<br />
48 21 04/06/2006 24/08/1992<br />
48 22 23/09/2000 24/08/1992<br />
48 23 23/09/2000 24/08/1992<br />
48 24 23/09/2000 03/10/1989<br />
48 25 23/09/2000 21/07/2000 20/09/1990<br />
48 26 23/09/2000 20/09/1990<br />
49 13 20/08/1988<br />
49 14 12/07/1991<br />
49 15 16/08/2001 10/06/1991<br />
49 16 02/06/1994 28/06/1992<br />
49 17 12/06/1992<br />
49 18 16/08/2001 12/06/1992<br />
49 19 16/08/2001 19/08/1993<br />
49 20 16/08/2001 1999 19/09/1993<br />
49 21 16/08/2001 15/08/1992<br />
49 22 16/08/2001 12/09/1999 15/08/1992<br />
49 23 03/10/2001 12/09/1999 15/08/1992<br />
49 24 03/10/2001 26/06/2000 15/08/1992<br />
49 25 13/08/2000 26/06/2000 07/08/1989<br />
49 26 03/10/2001 07/08/1989<br />
50 13 03/09/1999<br />
50 14 24/09/2001<br />
50 15 24/09/2001<br />
50 16 21/09/2000<br />
50 17 21/09/2000<br />
50 18 21/09/2000 17/07/1999<br />
50 19 21/09/2000<br />
50 20 29/10/2002 10/09/1987<br />
50 22 1999 1992<br />
50 23 1999 1992<br />
50 24 1999<br />
50 25 21/09/2000 16/06/1985<br />
51 13 28/07/1992<br />
51 14 13/08/1992<br />
51 15 11/08/1991<br />
51 16 10/06/1992<br />
51 17 24/06/1991<br />
51 18 21/09/2000 11/08/1991<br />
51 19 14/08/2001<br />
51 20 14/08/2001 03/09/1999 03/09/1988<br />
51 21 14/08/2001 03/10/1993<br />
51 22 15/09/2001 14/08/2001 03/10/1993<br />
51 23 15/09/2001 24/06/2000 29/06/1987<br />
51 24 01/10/2001 14/09/1992<br />
51 25 24/06/2000 17/07/1988<br />
52 13 05/08/2001<br />
52 14 17/07/2000<br />
52 15 17/07/2000<br />
52 16 17/07/2000<br />
52 17 15/07/1999
Path Row Date 1 Date 2 Date 3 Date 4<br />
52 18 17/07/2000 16/08/1999<br />
52 19 19/09/1999 05/09/1992<br />
52 21 21/06/2002 25/08/1988<br />
52 22 01/09/2000 30/05/2000 25/08/1988<br />
52 23 23/07/2002 19/07/1992<br />
53 13 10/07/1992 07/08/1999<br />
53 16 24/07/1991<br />
53 18 07/08/1999 21/09/1995<br />
53 19 12/08/2001<br />
53 20 06/07/1999 15/09/1993<br />
53 21 12/08/2001 1999 17/08/1994<br />
53 22 06/07/1999 24/06/1992<br />
53 23 06/07/1999 24/06/1992<br />
53 24 12/06/2002 24/06/1992<br />
54 14 07/09/2002<br />
54 15 07/09/2002<br />
54 17 07/09/2002 21/08/1993<br />
54 18 23/09/2002 06/08/2002 03/01/2000 20/07/1987<br />
54 19 16/08/1991<br />
54 21 26/08/1989<br />
54 22 01/09/2000 26/08/1989<br />
54 23 15/03/2002 16/08/1991<br />
55 14 05/08/1999 08/07/1992<br />
55 15 11/09/2001 06/07/1991<br />
55 16 11/09/2001 07/08/1991<br />
55 17 05/08/1999<br />
55 18 05/08/1999<br />
55 19 10/08/2001 05/08/1999<br />
55 20 05/08/1999 09/08/1986<br />
55 21 30/09/2002 24/09/2000 26/10/1991<br />
55 22 10/08/2001 26/10/1991<br />
55 23 10/08/2001 26/10/1991<br />
56 13 11/06/2000<br />
56 14 11/06/2000 11/07/1999<br />
56 16 29/06/1992 09/09/1989<br />
56 17 17/08/2001 29/06/1992<br />
56 18 09/09/1989<br />
56 19 13/09/1999 09/09/1989<br />
56 20 12/08/1999 09/09/1989<br />
57 12 27/08/2002 08/06/2002 09/07/1987<br />
57 13 12/09/2002 09/07/1987<br />
57 14 12/09/2002 01/07/1990<br />
57 15 03/08/1999 17/09/1995<br />
57 16 03/08/1999 17/09/1995<br />
57 17 03/08/1999 17/09/1995<br />
57 18 03/08/1999 18/06/1991<br />
57 19 08/08/2001 03/08/1999<br />
58 14 17/07/2002<br />
58 18 25/06/1991<br />
58 19 15/08/2001 25/06/1991<br />
59 12 16/07/1999 07/07/1993<br />
59 13 02/09/1999 21/08/1992<br />
59 14 21/05/2002 21/08/1992<br />
Path Row Date 1 Date 2 Date 3 Date 4<br />
59 15 01/08/1999 21/08/1992<br />
59 16 01/08/1999 21/08/1992<br />
59 17 01/08/1999 24/08/1987<br />
59 18 20/09/2000 01/08/1999<br />
59 19 01/08/1999<br />
60 17 23/08/1990<br />
60 18 13/08/2001 23/08/1990<br />
60 19 09/06/1992<br />
61 12 16/07/2000 18/07/1992<br />
61 13 16/07/2000 18/07/1992<br />
61 14 17/08/2000 27/08/1989<br />
61 15 17/06/2001 22/08/1987<br />
61 16 14/07/1999 22/08/1987<br />
61 17 19/07/2001<br />
61 18 19/07/2001<br />
62 13 31/08/2000 30/06/1992<br />
62 17 26/05/2002 16/08/1994<br />
62 18 08/06/2001 12/07/1993<br />
63 12 31/08/2000 30/06/1992<br />
63 13 31/08/2000 30/06/1992<br />
63 14 31/08/2000 20/08/1993 14/06/1986<br />
63 15 31/08/2000 20/08/1993<br />
63 16 18/06/2002 22/07/1994<br />
63 17 12/08/1990<br />
65 13 18/07/2002 10/07/1999 23/08/1989<br />
65 14 12/09/1999 28/06/1992<br />
65 15 03/08/2002 28/06/1992<br />
66 12 26/08/2002 29/07/1989<br />
66 13 16/09/1995 29/07/1989<br />
66 14 16/09/1995<br />
67 11 30/08/2001 23/06/1985<br />
67 12 27/08/1991<br />
69 11 28/08/2001 07/07/1985<br />
GFWC | Atlas of <strong>Canada</strong>’s Intact <strong>Forest</strong> Landscapes| 81
B. List of species (reptiles and amphibians, mammals, and birds) used<br />
in species diversity analysis<br />
(A) Reptiles (46)<br />
(i) Common Reptiles (33)<br />
Atlantic Ridley Lepidochelys kempi<br />
northern brown snake Storeria dekayi dekayi<br />
Butler’s garter snake Thamnophis butleri<br />
common garter snake Thamnophis sirtalis<br />
common snapping turtle Chelydra serpentina<br />
eastern ribbon snake Thamnophis sauritus<br />
eastern box turtle Terrapene caolina<br />
fox snake Elaphe vulpina<br />
gopher snake Pituophis melanoleucus<br />
green turtle Chelonia mydas<br />
map turtle Graptemys geographica<br />
milk snake Lampropeltis triangulum<br />
night snake Hypsiglena torquata<br />
northern alligator lizard Gerrhonotus coeruleus<br />
northern water snake Nerodia sipedon<br />
northwestern garter snake Thamnophis elegans<br />
painted turtle Chrysemys picta<br />
plains garter snake Thamnophis radix<br />
queen snake Regina septemvitta<br />
racer Coluber constrictor<br />
redbelly snake Storeria occipitomaculata<br />
ringneck snake Diadophis punctatus<br />
rubber boa snake Charina bottae<br />
sharptail snake Contia tenuis<br />
short-horned lizard Phrynosoma douglassi<br />
smooth green snake Opheodrys vernalis<br />
stinkpot Sternotherus odoratus<br />
timber rattlesnake Crotalus horridus<br />
western skink Eumeces skiltonianus<br />
western rattlesnake Crotalus viridis<br />
western garter snake Thamnophis elegans<br />
western pond turtle Clemmys marmorata<br />
western hognose snake Heterodon nasicus<br />
(ii) Endangered Reptiles (2)<br />
blue racer Coluber constrictor foxi<br />
Lake Erie water snake Nerodia sipedon insularum<br />
(iii) Threatened Reptiles (4)<br />
eastern massasauga rattlesnake Sistrurus catenatus<br />
Blanding’s turtle (Nova Scotia) Emydoidea blandingi<br />
spiny softshell turtle Trionyx spiniferus<br />
black rat snake Elaphe obsoleta obsoleta<br />
(iv) Vulnerable Reptiles (7)<br />
eastern hognose snake Heterodon platyrhinos<br />
82 | Appendix 3. Data<br />
eastern short-horned lizard Phrynosoma douglassi<br />
eastern yellow-bellied racer Coluber constrictor flaviventris<br />
northern prairie skink Eumeces septentrionalis<br />
spotted turtle Clemmys guttata<br />
wood turtle Clemmys insculpta<br />
five-lined skink Eumeces fasciatus<br />
(B) Amphibians (46)<br />
(i) Common Amphibians (37)<br />
American toad Bufo americanus<br />
blue spotted salamander Ambystoma laterale<br />
bullfrog Rana catesbeiana<br />
clouded salamander Aneides ferreus<br />
diploid grey treefrog Hyla chrysoscelis<br />
northern dusky salamander Desmognathus fuscus<br />
eastern newt Notophthalmus viridescens<br />
eschscholtz’s salamander Ensatina eschscholtzii<br />
eastern redback salamander Plethodon cinereus<br />
four-toed salamander Hemidactylium scutatum<br />
green frog Rana clamitans<br />
great plains toad Bufo cognatus<br />
jefferson salamander Ambystoma jeffersonianum<br />
long-toe salamander Ambystoma macrodactylum<br />
mink frog Rana septentrionalis<br />
mudpuppy Necturus maculosus<br />
northern leopard frog Rana pipiens<br />
northern cricket frog Acris crepitans<br />
northwestern salamander Ambystoma gracile<br />
pacific tree frog Hyla regilla<br />
pickerel frog Rana palustris<br />
plains spadefoot toad Spea bombifrons<br />
red-legged frog Rana aurora<br />
roughskin newt Taricha granulosa<br />
spotted frog Rana pretiosa<br />
spring peeper Pseudacris crucifer<br />
spring salamander Gyrinophilus porphyriticus<br />
striped chorus frog Pseudacris maculata<br />
tailed frog Ascaphus truei<br />
tetraploid grey treefrog Hyla versicolor<br />
tiger salamander Ambystoma tigrinum<br />
northern two-lined salamander Eurycea bislineata<br />
western toad Bufo boreas<br />
wood frog Rana sylvatica<br />
Woodhouse’s toad Bufo woodhousei<br />
western redback salamander Plethodon vehiculum<br />
yellow-spotted salamander Ambystoma aculatum
(ii) Endangered Amphibians (2)<br />
Blanchard’s cricket frog Acris crepitans blanchardi<br />
northern leopard frog (B.C. pop.) Rana pipiens<br />
(iii) Threatened Amphibians (0)<br />
(iv) Vulnerable Amphibians (7)<br />
Fowler’s Toad Bufo fowleri<br />
Pacific giant salamander Dicamptodon tenebrosus<br />
smallmouth salamander Ambystoma texanum<br />
northern leopard frog Rana pipiens<br />
coeurd’Alene salamander Plethodon idahoensis<br />
mountain dusky salamander Desmognathus orcophaeus<br />
great basin spadefoot toad Spea intermontanus<br />
(C) Mammals (152)<br />
(i) Common Mammals (123)<br />
Virginia opossum Didelphis virginiana<br />
masked shrew Sorex cinereus<br />
dusky shrew Sorex obscurus<br />
vagrant shrew Sorex vagrans<br />
American water shrew Sorex palustris<br />
Bendire’s shrew Sorex bindirii<br />
smokey shrew Sorex fumeus<br />
Arctic shrew Sorex arcticus<br />
Trowbridge’s shrew Sorex trowbridgii<br />
pigmy shrew Microsorex hoyi<br />
short-tailed shrew Blarina brevicauda<br />
least shrew Cryptotis parva<br />
American shrew-mole Neürotrichus gibbsii<br />
Pacific coast mole Scapanus orarius<br />
hairy-tailed mole Parascalops breweri<br />
star-nosed mole Condylura cristata<br />
little brown bat Myotis lucifugus<br />
Yuma bat Myotis yumanensis<br />
Keen’s bat Myotis keenii<br />
long-eared bat Myotis evotis<br />
long-legged bat Myotis volans<br />
California bat Myotis californicus<br />
small-footed bat Myotis leibii<br />
silver-haired bat Lasionycteris noctivagans<br />
Townsend’s big-eared bat Plecotus townsendii<br />
eastern pipistrelle Pipistrellus subflavus<br />
big brown bat Eptesicus fuscus<br />
evening bat Nycticeius humeralis<br />
red bat Lasiurus borealis<br />
hoary bat Lasiurus cinerus<br />
big free-tailed bat Tadarida macrotis<br />
American pika Ochotona princeps<br />
eastern cottontail Sylvilagus floridanus<br />
snowshoe hare Lepus americanus<br />
Arctic hare Lepus arcticus<br />
white-tailed jack rabbit Lepus townsendii<br />
mountain beaver Aplodontia rufa<br />
eastern chipmunk Tamias striatus<br />
least chipmunk Eutamias minimus<br />
yellow pine chipmunk Eutamias amoenus<br />
Townsend’s chipmunk Entamias townsendii<br />
red-tailed chipmunk Eutamias ruficaudus<br />
woodchuck Marmota monax<br />
yellow-bellied marmot Marmota flaviventris<br />
hoary marmots Marmota caligata<br />
Richardson’s ground squirrel Spermophilus richardsonii<br />
Columbian ground squirrel Spermophilus columbianus<br />
Arctic ground squirrel Spermophilus parryii<br />
thirteen-lined ground squirrel Spermophilus tridecemlineatus<br />
Franklin’s ground squirrel Spermophilus franklinii<br />
golden-mantled ground squirrel Spermophilus lateralis<br />
grey or black squirrel Sciurus carolinensis<br />
fox squirrel Sciurus niger<br />
American red squirrel Tamiasciurus hudsonicus<br />
Douglas’s squirrel Tamiasciurus douglasii<br />
northern flying squirrel Glaucomys sabrinus<br />
northern pocket gopher Thomomys talpoides<br />
olive-backed pocket mouse Perognathus fasciatus<br />
great basin pocket mouse Perognathus parvus<br />
American beaver Castor canadensis<br />
deer mouse Peromyscus maniculatus<br />
Sitka mouse Peromyscus sitkensis<br />
white-footed mouse Peromyscus leucopus<br />
Cascade deer mouse Peromyscus oreas<br />
northern grasshopper mouse Onychomys leucogaster<br />
bushy-tailed wood rat Neotoma cinerea<br />
red-backed vole Clethrionomys rutilus<br />
western red-backed vole Clethrionomys occidentalis<br />
Gapper’s red-backed vole Clethrionomys gapperi<br />
brown lemming Lemmus lemmus<br />
southern bog lemming Synaptomys cooperi<br />
northern bog lemming Synaptomys borealis<br />
heather vole Phenacomys intermedius<br />
collared lemming Dicrostonyx torquatus<br />
Ungava lemming Dicrostonyx hudsonius<br />
Muskrat Ondrata zibethicus<br />
sagebush vole Lagurus curtatus<br />
Richardson’s water vole Arvicola richardsoni<br />
prairie vole Microtus ochrogaster<br />
singing vole Microtus miurus<br />
meadow vole Microtus pennsylvanicus<br />
Monane vole Microtus montanus<br />
Townsend’s vole Microtus townsendii<br />
tundra vole Microtus oeconomus<br />
long-tailed vole Microtus longicaudus<br />
rock vole Microtus chrotorrhinus<br />
chestnut-cheeked vole Microtus xanthognathus<br />
GFWC | Atlas of <strong>Canada</strong>’s Intact <strong>Forest</strong> Landscapes| 83
creeping vole Microtus oregoni<br />
Pacific jumping mouse Zapus trinotatus<br />
western jumping vole mouse Zapus princeps<br />
meadow jumping vole mouse Zapus hudsonius<br />
woodland jumping vole mouse Napaeozapus insignis<br />
American porcupine Erethizon dorsatum<br />
coyote Canis latrans<br />
wolf Canis lupus<br />
Arctic fox Alopex lagopus<br />
red fox Vulpes vulpes<br />
American black bear Ursus americanus<br />
Raccoon Procyon lotor<br />
American marten Martes americana<br />
Fisher Martes pennanti<br />
Ermine Mustela erminea<br />
long-tailed weasel Mustela frenata<br />
least weasel Mustela nivalis<br />
American mink Mustela vison<br />
Wolverine Gulo gulo<br />
American badger Taxidea taxus<br />
western spotted skunk Spilogale gracilis<br />
Striped skunk Mephitis mephitis<br />
river otter Lontra canadensis<br />
cougar Felis concolor<br />
lynx Lynx lynx<br />
bobcat Lynx rufus<br />
caribou Rangifer tarandus<br />
mule deer Odocoileus hemionus<br />
white-tailed deer Odocoileus virginianus<br />
moose Alces alces<br />
wapiti Cervus elaphus<br />
pronghorn Antilocapra americana<br />
mountain goat Oreamnos americanus<br />
muskox Ovibos moschatus<br />
bighorn sheep Ovis canadensis<br />
Dall’s sheep Ovis dalli<br />
(ii) Endangered Mammals (5)<br />
Peary Banks Island Rangifer tarandus pearyi<br />
Peary High Arctic Rangifer tarandus pearyi<br />
Vancouver Island marmot Marmota vancouverensis<br />
Marten (Newfoundland) Martes americana<br />
Wolverine (eastern population) Gulo gulo<br />
(iii) Threatened Mammals (5)<br />
Wood bison Bison bison athabascae<br />
Caribou (Low Arctic Peary) Rangifer tarandus pearyi<br />
Woodland caribou Rangifer tarandus caribou<br />
Townsend’s mole Scapanus townsendii<br />
Pacific water shrew Sorex bendirii<br />
(iv) Vulnerable Mammals (19)<br />
Black Tailed Prairie Dog Cynomys ludovicianus<br />
Eastern Mole Scalopus aquaticus<br />
84 | Appendix 3. Data<br />
Fringed Bat Myotis thysanodes<br />
Gaspé Shrew Sorex gaspensis<br />
Grey fox Urocyon cinereoargenteus<br />
Grizzly bear Ursus arctos<br />
Keen’s Long-eared bat Myotis keenii<br />
Nuttall’s cottontail Sylvilagus nuttallii<br />
Ord’s Kangaroo rat Dipodomys ordii<br />
Pallid bat Antrozous pallidus<br />
Plains pocket gopher Geomys bursarius<br />
Polar bear Ursus maritimus<br />
Southern flying squirrel Glaucomys volans<br />
Spotted bat Euderma maculata<br />
Western harvest mouse Reithrodontomys megalotis<br />
Woodland caribou Rangifer tarandus caribou<br />
Queen Charlotte’s ermine Mustela erminea haidarum<br />
New Foundland wolverine Gulo gulo<br />
Woodland vole Microtus pinetorum<br />
(D) Birds (383)<br />
(i) Common Birds (342)<br />
American Black Duck Anas rubripes<br />
Green-winged Teal Anas crecca<br />
Alder Flycatcher Empidonax alnorum<br />
American Avocet Recurvirostra americana<br />
American Bittern Botaurus lentiginosus<br />
American Coot Fulica americana<br />
American Crow Corvus brachyrhynchos<br />
American Dipper Cinclus mexicanus<br />
American Goldfinch Carduelis tristis<br />
American Kestrel Falco sparverius<br />
American Redstart Setophaga ruticilla<br />
American Robin Turdus migratorius<br />
American Wigeon Anas americana<br />
American Woodcock Scolopax minor<br />
Anna’s Hummingbird Calypte anna<br />
Arctic Tern Sterna paradisea<br />
Atlantic Brant Branta bernicla<br />
American Tree Sparrow Spizella arborea<br />
American White Pelican Pelecanus erythrorhynchos<br />
Bald Eagle Haliaeetus leucocephalus<br />
Barrow’s Goldeneye Becephala islandica<br />
Baird’s Sparrow Ammodramus bairdii<br />
Bank Swallow Riparia riparia<br />
Barn Swallow Hirundo rustica<br />
Baird’s Sandpiper Calidris bairdii<br />
Black-and-White Warbler Mniotilta varia<br />
Black-billed Cuckoo Coccyzus erythopthalmus<br />
Black-billed Magpie Pica pica<br />
Black-bellied Plover Pluvialis squatarola<br />
Buff-breasted Sandpiper Tryngites subruficollis<br />
Bay-breasted Warbler Dendoica castanea
Black-backed Woodpecker Picoides arcticus<br />
Black-capped Chickadee Parus atricapillus<br />
Black-crowned Night Heron Nycticorax nycticorax<br />
Barred Owl Strix varia<br />
Belted Kingfisher Ceryle alcyon<br />
Bewick’s Wren Thromanes bewickii<br />
Blue-gray Gnatcatcher Polioptila caerulea<br />
Brown-headed Cowbird Molothrus ater<br />
Black-headed Grosbeak Pheuticus melanocephalus<br />
Blackburnian Warbler Dendroica fusca<br />
Blue Jay Cyanocitta cristata<br />
Blackpoll Warbler Dendroica striata<br />
Black Scoter Melanitta nigra<br />
Black Swift Cypseloides niger<br />
Black Tern Chlidonias niger<br />
Blue Grouse Dendragapus obscurus<br />
Bobolink Dolichonyx oryzivorus<br />
Boreal Chickadee Parus hudsonicus<br />
Bonaparte’s Gull Larus philadelphia<br />
Boreal Owl Aegolius funereus<br />
Bohemian Waxwing Bombycilla garrulus<br />
Brandt’s Cormorant Phalacrocorax penicillatus<br />
Brewer’s Blackbird Euphagus cyanocephalus<br />
Brown Creeper Certhia americana<br />
Brewer’s Sparrow Spizella breweri<br />
Brown Thrasher Toxostoma rufum<br />
Black-throated Blue Warbler Dendroica caerulescens<br />
Black-throated Green Warbler Dendroica virens<br />
Band-tailed Pigeon Columba fasciata<br />
Black-throated Gray Warbler Dendroica nigrescens<br />
Bufflehead Bucephala albeola<br />
Broad-winged Hawk Buteo platypterus<br />
Blue-winged Teal Anas discors<br />
Blue-winged Warbler Vermivora pinus<br />
Cassin’s Finch Carpodacus cassinii<br />
<strong>Canada</strong> Goose Branta canadensis<br />
California Gull Larus californicus<br />
Calliope Hummingbird Stellula calliope<br />
Canvasback Aythya valisineria<br />
Canyon Wren Catherpes mexicanus<br />
<strong>Canada</strong> Warbler Wilsonia canadensis<br />
Carolina Wren Thryothorus ludovicianus<br />
Chestnut-backed Chickadee Parus rufescens<br />
Chestnut-collared Longspur Calcarius ornatus<br />
Clay-colored Sparrow Spizella pallida<br />
Cedar Waxwing Bombycilla cedrorum<br />
Chipping Sparrow Spizella passerina<br />
Chimney Swift Aeronautes saxatalis<br />
Cinnamon Teal Anas cyanoptera<br />
Clark’s Grebe Aechmophorus clarkii<br />
Clark’s Nutcracker Nucifraga columbiana<br />
Cliff Swallow Hirundo pyrrhonota<br />
Cape May Warbler Dendroica tigrina<br />
Common Bushtit Psaltriparus minimus<br />
Common Goldeneye Bucephala clangula<br />
Common Grackle Quiscalus quiscula<br />
Cooper’s Hawk Accipiter cooperii<br />
Common Loon Gavia immer<br />
Common Merganser Mergus merganser<br />
Common Moorhen Gallinula chloropus<br />
Common Nighthawk Chordeiles minor<br />
Connecticut Warbler Oporornis agilis<br />
Common Poorwill Phalaenoptilus nuttalii<br />
Common Raven Corvus corax<br />
Common Redpoll Carduelis flammea<br />
Common Snipe Gallinago gallinago<br />
Common Tern Sterna hirundo<br />
Common Yellowthroat Geothlypis trichas<br />
Common Ringed Plover Charadrius hiaticula<br />
Chestnut-sided Warbler Dendroica pensylvanica<br />
Chuck-will’s-widow Caprimulgus carolinensis<br />
Double-crested Cormorant Pelecanus erythorhynchos<br />
Dark-eyed Junco Junco hyemalis<br />
Dickcissel Spiza americana<br />
Downy Woodpecker Picoides pubescens<br />
Dusky Flycatcher Empidonax oberholseri<br />
Dunlin Calidris alpina<br />
Eastern Bluebird Sialia sialis<br />
Eared Grebe Podiceps nigricollis<br />
Eastern Kingbird Tyrannus tyrannus<br />
Eastern Meadowlark Sturnella magna<br />
Eastern Phoebe Sayornis phoebe<br />
Eastern Screech Owl Otus asio<br />
Eastern Wood-Pewee Contopus sordidulus<br />
Evening Grosbeak Coccothraustes vespertinus<br />
Field Sparrow Spizella pusilla<br />
Fox Sparrow Passerella iliaca<br />
Forster’s Tern Sterna forsteri<br />
Franklin’s Gull Larus pipixcan<br />
Gadwall Anas strepera<br />
Great Crested Flycatcher Myiarchus crinitus<br />
Golden-crowned Kinglet Regulus satrapa<br />
Golden-crowned Sparrow Zonotrichia atricapilla<br />
Gray-cheeked Thrush Catharus minimus<br />
Great Gray Owl Strix nebulosa<br />
Great Horned Owl Bubo virginianus<br />
Glaucous Gull Larus hyperboreus<br />
Green-backed Heron Butorides striatus<br />
Golden Eagle Aquila chrysaetos<br />
Gray Jay Perisoreus canadensis<br />
Gray Catbird Dumetella carolinensis<br />
Greater Scaup Aythya marila<br />
Grasshopper Sparrow Ammodramus savannarum<br />
Greater Yellowlegs Tringa melanoleuca<br />
Great Blue Heron Ardea herodias<br />
Greater White-fronted Goose Anser albifrons<br />
GFWC | Atlas of <strong>Canada</strong>’s Intact <strong>Forest</strong> Landscapes| 85
Golden-winged Warbler Vermivora chrysoptera<br />
Gyrfalcon Falco rusticolus<br />
Hammond’s Flycatcher Empidonax hammondii<br />
Harlequin Duck Histrionicus histrionicus<br />
Harris’ Sparrow Zonotrichia querula<br />
Hairy Woodpecker Picoides villosus<br />
Herring Gull Larus argentatus<br />
Hermit Thrush Catharus guttatus<br />
House Finch Carpodacus mexicanus<br />
Horned Grebe Podiceps auritus<br />
Horned Lark Eremophila alpestris<br />
Hooded Merganser Lophodytes cucullatus<br />
Hoary Redpoll Carduelis hornemanni<br />
House Wren Troglodytes troglodytes<br />
Hudsonian Godwit Limosa haemastica<br />
Hutton’s Vireo Vireo huttoni<br />
Iceland Gull Larus glaucoides<br />
Indigo Bunting Passerina cyanea<br />
Killdeer Charadrius vociferus<br />
Lapland Longspur Calcarius lapponicus<br />
Lark Bunting Calamospiza melanocorys<br />
Lark Sparrow Chondestes grammacus<br />
Lazuli Bunting Passerina amoena<br />
Long-billed Dowitcher Limnodromus scolopaceus<br />
Le Conte’s Sparrow Ammodramus leconteii<br />
Least Flycatcher Empidonax minimus<br />
American Golden-Plover Pluvialis dominica<br />
Long-eared Owl Asio otus<br />
Least Sandpiper Calidris minutilla<br />
Lesser Scaup Aythya affinis<br />
Lewis’ Woodpecker Melanerpes lewis<br />
Lesser Yellowlegs Tringa flavipes<br />
Lincoln’s Sparrow Melospiza lincolnii<br />
Loggerhead Shrike Lanius ludovicianus<br />
Lesser Snow Goose Chen caerulescens<br />
Marbled Godwit Limosa fedoa<br />
Mallard Anas platyrhynchos<br />
Magnolia Warbler Dendroica magnolia<br />
Marsh Wren Cistothorus palustris<br />
McCown’s Longspur Calcarius mccownii<br />
Mew Gull Larus canus<br />
Merlin Falco columbarius<br />
MacGillivray’s Warbler Oporornis tolmiei<br />
Mountain Bluebird Sialia currucoides<br />
Mountain Chickadee Parus gambeli<br />
Mourning Dove Zenaida macroura<br />
Mourning Warbler Oporornis philadelphia<br />
Nashville Warbler Vermivora ruficapilla<br />
Northern Cardinal Cardinalis cardinalis<br />
Northwestern Crow Corvus caurinus<br />
Northern Flicker Colaptes auratus<br />
Northern Goshawk Accipiter gentilis<br />
Northern Harrier Circus cyaneus<br />
86 | Appendix 3. Data<br />
Northern Hawk Owl Surnia ulula<br />
Northern Mockingbird Mimus polyglottos<br />
Northern Oriole Icterus galbula<br />
Northern Parula Parula americana<br />
Northern Pintail Anas acuta<br />
Northern Pygmy-Owl Glaucidium gnoma<br />
Northern Waterthrush Seiurus noveboracensis<br />
Northern Wheatear Oenanthe oenanthe<br />
Northern Rough-winged Swallow Stelgidopteryx serripennis<br />
Northern Shoveler Anas clypeata<br />
Northern Shrike Lanius excubitor<br />
Northern Saw-whet Owl Aegolius acadicus<br />
Orange-crowned Warbler Vermivora celata<br />
Oldsquaw Clangula hyemalis<br />
Orchard Oriole Icterus spurius<br />
Olive-sided Flycatcher Contopus borealis<br />
Osprey Pandion haliaetus<br />
Ovenbird Seiurus aurocapillus<br />
Pacific Loon Gavia pacifica<br />
Pied-billed Grebe Podilymbus podiceps<br />
Peregrine Falcon Falco peregrinus<br />
Pectoral Sandpiper Calidris melanotos<br />
Philadelphia Vireo Vireo philadelphicus<br />
Pine Grosbeak Pinicola enucleator<br />
Pine Siskin Carduelis pinus<br />
Pine Warbler Dendroica pinus<br />
Pileated Woodpecker Dryocopus pileatus<br />
Palm Warbler Dendroica palmarum<br />
Prairie Falcon Falco mexicanus<br />
Purple Finch Carpodacus purpureus<br />
Purple Martin Progne subis<br />
Purple Sandpiper Calidris maritima<br />
Pygmy Nuthatch Sitta pygmaea<br />
Rose-breasted Grosbeak Pheuticus ludovicianus<br />
Ring-billed Gull Larus delawarensis<br />
Red-breasted Merganser Mergus serrator<br />
Red-breasted Nuthatch Sitta canadensis<br />
Red-breasted Sapsucker Sphyrapicus ruber<br />
Red-bellied Woodpecker Melanerpes carolinus<br />
Ruby-crowned Kinglet Regulus calendula<br />
Red Crossbill Loxia curvirostra<br />
Redhead Aythya americana<br />
Red Knot Calidris canutus<br />
Red Phalarope Phalaropus fulicaria<br />
Red-eyed Vireo Vireo olivaceus<br />
Rough-legged Hawk Buteo lagopus<br />
Ring-necked Duck Aythya collaris<br />
Red-necked Grebe Podiceps grisegena<br />
Red-necked Phalarope Phalaropus lobatus<br />
Red-naped Sapsucker Sphyrapicus nuchalis<br />
Rock Ptarmigan Lagopus mutus<br />
Rock Wren Salpinctes obsoletus<br />
Rufous-sided Towhee Pipilo erythrophthalmus
Red-tailed Hawk Buteo jamaicensis<br />
Ruby-throated Hummingbird Archilochus colubris<br />
Red-throated Loon Gavia stellata<br />
Rusty Blackbird Euphagus carolinus<br />
Ruddy Duck Oxyura jamaicensis<br />
Ruffed Grouse Bonasa umbellus<br />
Rufous Hummingbird Selasphorus rufus<br />
Ruddy Turnstone Arenaria interpres<br />
Red-winged Blackbird Agelaius phoeniceus<br />
Sandhill Crane Grus canadensis<br />
Sage Grouse Centrocercus urophasianus<br />
Sabine’s Gull Xema sabini<br />
Sanderling Calidris alba<br />
Say’s Phoebe Sayornis saya<br />
Savannah Sparrow Passerculus sandwichensis<br />
Short-billed Dowitcher Limnodromus griseus<br />
Scarlet Tanager Piranga olivacea<br />
Semipalmated Plover Charadrius semipalmatus<br />
Semipalmated Sandpiper Calidris pusilla<br />
Sedge Wren Cistothorus platensis<br />
Sharp-tailed Grouse Tympanuchus phasianellus<br />
Siberian Tit Parus cinctus<br />
Smith’s Longspur Calcarius pictus<br />
Snow Bunting Plectrophenax nivalis<br />
Snowy Owl Nyctea scandiaca<br />
Sora Porzana carolina<br />
Solitary Sandpiper Tringa solitaria<br />
Song Sparrow Melospiza melodia<br />
Solitary Vireo Vireo solitarius<br />
Spruce Grouse Dendragapus canadensis<br />
Sprague’s Pipit Anthus spragueii<br />
Spotted Sandpiper Actitus macularia<br />
Sharp-shinned Hawk Accipiter striatus<br />
Stellar’s Jay Cyanocitta stelleri<br />
Stilt Sandpiper Calidris himantopus<br />
Sharp-tailed Sparrow Ammodramus caudacutus<br />
Surfbird Aphriza virgata<br />
Surf Scoter Melanitta perspicillata<br />
Swainson’s Hawk Buteo swainsoni<br />
Swamp Sparrow Melospiza georgiana<br />
Swainson’s Thrush Catharus ustulatus<br />
Tennessee Warbler Vermivora peregrina<br />
Townsend’s Solitaire Myadestes townsendi<br />
Townsend’s Warbler Dendroica townsendi<br />
Tree Swallow Tachycineta bicolor<br />
Trumpeter Swan Cygnus buccinator<br />
Three-toed Woodpecker Picoides tridactylus<br />
Tufted Titmouse Parus bicolor<br />
Turkey Vulture Cathartes aura<br />
Upland Sandpiper Bartramia longicauda<br />
Vaux’s Swift Chaetura vauxi<br />
Varied Thrush Ixoreus naevius<br />
Veery Catharus fuscescens<br />
Vesper Sparrow Pooecetes gramineus<br />
Violet-green Swallow Tachycineta thalassina<br />
Viginia Rail Rallus limicola<br />
American Pipit Anthus rubescens<br />
Wandering Tattler Heteroscelus incanus<br />
Warbling Vireo Vireo gilvus<br />
White-breasted Nuthatch Sitta carolinensis<br />
White-crowned Sparrow Zonotrichia leucophrys<br />
Western Bluebird Sialia mexicana<br />
Pacific-slope Flycatcher Empidonax difficilis<br />
Western Grebe Aechmophorus occidentalis<br />
Western Kingbird Tyrannus verticalis<br />
Western Meadowlark Sturnella neglecta<br />
Western Screech Owl Otus kennicottii<br />
Western Tanager Piranga ludoviciana<br />
White-eyed Vireo Vireo griseus<br />
Western Wood-Pewee Contopus sordidulus<br />
Whimbrel Numenius phaeopus<br />
Tundra Swan Cygnus columbianus<br />
White-headed Woodpecker Picoides albolarvatus<br />
Willow Flycatcher Empidonax trailii<br />
Willet Catoptrophorus semipalmatus<br />
Wilson’s Phalarope Phalaropus tricolor<br />
Willow Ptarmigan Lagopus lagopus<br />
Williamson’s Sapsucker Sphyrapicus thyroideus<br />
Wilson’s Warbler Wilsonia pusilla<br />
Winter Wren Troglodytes troglodytes<br />
Wood Duck Aix sponsa<br />
Wood Thrush Hylocichla mustelina<br />
Whip-poor-will Caprimulgus vociferus<br />
White-rumped Sandpiper Calidris fuscicollis<br />
White-throated Sparrow Zonotrichia albicollis<br />
White-throated Swift Aeronautes saxatalis<br />
White-winged Crossbill Loxia leucoptera<br />
White-winged Scoter Melanitta fusca<br />
Yellow-breasted Chat Icteria virens<br />
Yellow-billed Cuckoo Coccyzus americanus<br />
Yellow-bellied Flycatcher Empidonax flaviventris<br />
Yellow-billed Loon Gavia adamsii<br />
Yellow-bellied Sapsucker Sphyrapicus varius<br />
Yellow Rail Coturnicops noveboracensis<br />
Yellow-headed Blackbird Xanthocephalus anthocephalus<br />
Yellow-rumped Warbler Dendroica coronata<br />
Yellow-throated Vireo Vireo flavifrons<br />
Yellow Wagtail Motacilla flava<br />
Yellow Warbler Dendroica petechia<br />
(iii) Endangered Birds (14)<br />
whooping crane Grus americana<br />
northern bobwhite Colinus virginianus<br />
harlequin duck Histrionicus histrionicus<br />
anatum peregrine falcon Falco peregrinus anatum<br />
acadian flycatcher Empidonax virescens<br />
GFWC | Atlas of <strong>Canada</strong>’s Intact <strong>Forest</strong> Landscapes| 87
urrowing owl Athene cunicularia<br />
spotted owl Strix occidentalis<br />
mountain plover Charadrius montanus<br />
piping plover Charadrius wilsonia<br />
king rail Rallus elegans<br />
loggerhead shrike (Eastern) Lanius ludovicianus<br />
Henslow’s sparrow Ammodramus henslowii<br />
sage thrasher Oreoscoptes montanus<br />
prothonotary warbler Protonotaria citrea<br />
(iv) Threatened Birds (7)<br />
Yellow-breasted chat (B.C.) Icteria virens<br />
sage grouse (Prairie) Centrocercus urophasianus<br />
marbled murrelet Brachyramphus marmoratus<br />
loggerhead shrike (Prairie) Lanius ludovicianus<br />
roseate tern Sterna dougallii<br />
hooded warbler Wilsonia citrina<br />
white-headed woodpecker Picoides albolarvatus<br />
(iv) Vulnerable Birds (20)<br />
Ancient Murrelet Synthliboramphus antiquus<br />
Barn Owl Tyto alba<br />
Caspian Tern Sterna caspia<br />
Cerulean Warbler Dendroica cerulea<br />
Ferruginous Hawk Buteo regalis<br />
Flammulated Owl Otus flammeolus<br />
Ivory Gull Pagophila eburnea<br />
Least Bittern Ixobrychus exilis<br />
Long-billed Curlew Numenius americanus<br />
Louisiana Waterthrush Seiurus motacilla<br />
Pacific Great Blue Heron Ardea herodias fannini<br />
Peale’s Peregrine Falcon Falco peregrinus pealei<br />
Prairie Warbler Dendroica discolor<br />
Queen Charlotte Goshawk Accipiter gentilis laingi<br />
Red-headed Woodpecker Melanerpes erythrocephalus<br />
Red-shouldered Hawk Buteo lineatus<br />
Ross’ Gull Rhodostethia rosea<br />
Short-eared Owl Asio flammeus<br />
Tundra Peregrine Falcon Falco peregrinus tundrius<br />
Yellow-breasted Chat Icteria virens<br />
88 | Appendix 3. Data