

IP-W " ~ - ` - JUWEL - Forschungszentrum Jülich
IP-W " ~ - ` - JUWEL - Forschungszentrum Jülich
IP-W " ~ - ` - JUWEL - Forschungszentrum Jülich

Create successful ePaper yourself
Turn your PDF publications into a flip-book with our unique Google optimized e-Paper software.
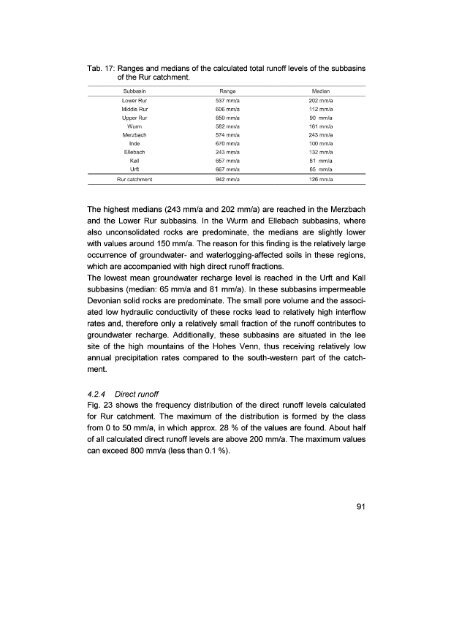
Tab . 17 : Ranges and medians of the calculated total runoff levels of the subbasins<br />
of the Rur catchment .<br />
. . . . . . . . . . . . . . . .<br />
Subbasin Range Median<br />
_ ................. ................. ..............<br />
LowerRur<br />
537 mm/a 202 mm/a<br />
Middle Rur<br />
Upper Rur<br />
Wurrn<br />
Merzbach<br />
Inde<br />
Ellebach<br />
Kali<br />
Urft<br />
Rur catchment<br />
606 rnm/a 112 mm/a<br />
850 mrn/a 90 mm/a<br />
582 rnm/a 161 mm/a<br />
574 mm/a 243 mn9/a<br />
670 mm/a 100 mm/a<br />
657 mm/a<br />
667 mm/a<br />
132 r^m/a<br />
mm/a<br />
942 mm/a 126 r - nfa<br />
The highest medians (243 mm/a and 202 mm/a) are reached in the Merzbach<br />
and the Lower Rur subbasins . In the Wurm and Ellebach subbasins, where<br />
also unconsolidated rocks are predominate, the medians are slightly lower<br />
with values around 150 mm/a . The reason for this finding is the relatively large<br />
occurrence of groundwater- and waterlogging-affected soils in these regions,<br />
which are accompanied with high direct runoff fractions .<br />
The lowest mean groundwater recharge level is reached in the Urft and Kall<br />
subbasins (median : 65 mm/a and 81 mm/a) . In these subbasins impermeable<br />
Devonian solid rocks are predominate . The small pore volume and the associ-<br />
ated low hydraulic conductivity of these rocks lead to relatively high interflow<br />
rates and, therefore only a relatively small fraction of the runoff contributes to<br />
groundwater recharge . Additionally, these subbasins are situated in the lee<br />
site of the high mountains of the Hohes Venn, thus receiving relatively low<br />
annual precipitation rates compared to the south-western part of the catch-<br />
ment .<br />
4.2.4 Direct runoff<br />
Fig . 23 shows the frequency distribution of the direct runoff levels calculated<br />
for Rur catchment . The maximum of the distribution is formed by the class<br />
from 0 to 50 mm/a, in which approx. 28 % of the values are found . About half<br />
of all calculated direct runoff levels are above 200 mm/a . The maximum values<br />
can exceed 800 mm/a (less than 0 .1 %) .<br />
9 1


