Winning at New Products: Pathways to Profitable Innovation
Winning at New Products: Pathways to Profitable Innovation
Winning at New Products: Pathways to Profitable Innovation

You also want an ePaper? Increase the reach of your titles
YUMPU automatically turns print PDFs into web optimized ePapers that Google loves.
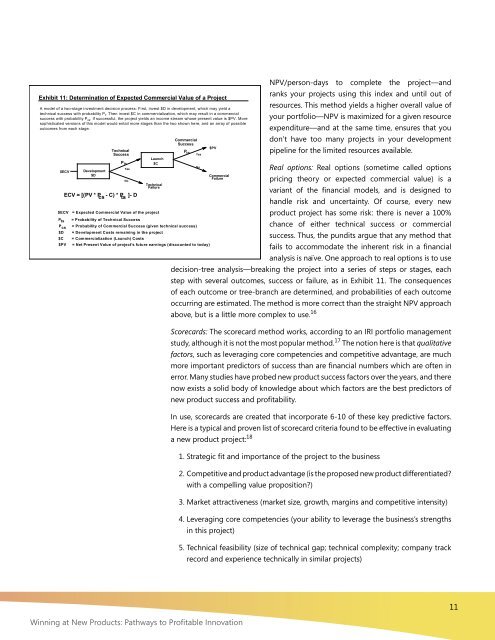
Exhibit 11: Determin<strong>at</strong>ion of Expected Commercial Value of a Project<br />
A model of a two-stage investment decision process: First, invest $D in development, which may yield a<br />
technical success with probability P t . Then invest $C in commercializ<strong>at</strong>ion, which may result in a commercial<br />
success with probability P cs . If successful, the project yields an income stream whose present value is $PV. More<br />
sophistic<strong>at</strong>ed versions of this model would entail more stages than the two shown here, and an array of possible<br />
outcomes from each stage.<br />
$ECV<br />
Development<br />
$D<br />
Technical<br />
Success<br />
Pts<br />
Yes<br />
No<br />
ECV = [(PV * P - C) * P ]- D<br />
cs ts<br />
Launch<br />
$C<br />
Technical<br />
Failure<br />
Commercial<br />
Success<br />
Pcs<br />
Yes<br />
$ECV = Expected Commercial Value of the project<br />
P ts = Probability of Technical Success<br />
P cs = Probability of Commercial Success (given technical success)<br />
$D = Development Costs remaining in the project<br />
$C = Commercializ<strong>at</strong>ion (Launch) Costs<br />
$PV = Net Present Value of project's future earnings (discounted <strong>to</strong> <strong>to</strong>day)<br />
<strong>Winning</strong> <strong>at</strong> <strong>New</strong> <strong>Products</strong>: P<strong>at</strong>hways <strong>to</strong> <strong>Profitable</strong> Innov<strong>at</strong>ion<br />
$PV<br />
NPV/person-days <strong>to</strong> complete the project—and<br />
ranks your projects using this index and until out of<br />
resources. This method yields a higher overall value of<br />
your portfolio—NPV is maximized for a given resource<br />
expenditure—and <strong>at</strong> the same time, ensures th<strong>at</strong> you<br />
don’t have <strong>to</strong>o many projects in your development<br />
pipeline for the limited resources available.<br />
Real options: Real options (sometime called options<br />
pricing theory or expected commercial value) is a<br />
variant of the financial models, and is designed <strong>to</strong><br />
handle risk and uncertainty. Of course, every new<br />
product project has some risk: there is never a 100%<br />
chance of either technical success or commercial<br />
success. Thus, the pundits argue th<strong>at</strong> any method th<strong>at</strong><br />
fails <strong>to</strong> accommod<strong>at</strong>e the inherent risk in a financial<br />
analysis is naïve. One approach <strong>to</strong> real options is <strong>to</strong> use<br />
decision-tree analysis—breaking the project in<strong>to</strong> a series of steps or stages, each<br />
step with several outcomes, success or failure, as in Exhibit 11. The consequences<br />
of each outcome or tree-branch are determined, and probabilities of each outcome<br />
occurring are estim<strong>at</strong>ed. The method is more correct than the straight NPV approach<br />
above, but is a little more complex <strong>to</strong> use. 16<br />
No<br />
Commercial<br />
Failure<br />
Scorecards: The scorecard method works, according <strong>to</strong> an IRI portfolio management<br />
study, although it is not the most popular method. 17 The notion here is th<strong>at</strong> qualit<strong>at</strong>ive<br />
fac<strong>to</strong>rs, such as leveraging core competencies and competitive advantage, are much<br />
more important predic<strong>to</strong>rs of success than are financial numbers which are often in<br />
error. Many studies have probed new product success fac<strong>to</strong>rs over the years, and there<br />
now exists a solid body of knowledge about which fac<strong>to</strong>rs are the best predic<strong>to</strong>rs of<br />
new product success and profitability.<br />
In use, scorecards are cre<strong>at</strong>ed th<strong>at</strong> incorpor<strong>at</strong>e 6-10 of these key predictive fac<strong>to</strong>rs.<br />
Here is a typical and proven list of scorecard criteria found <strong>to</strong> be effective in evalu<strong>at</strong>ing<br />
a new product project: 18<br />
1. Str<strong>at</strong>egic fit and importance of the project <strong>to</strong> the business<br />
2. Competitive and product advantage (is the proposed new product differenti<strong>at</strong>ed?<br />
with a compelling value proposition?)<br />
3. Market <strong>at</strong>tractiveness (market size, growth, margins and competitive intensity)<br />
4. Leveraging core competencies (your ability <strong>to</strong> leverage the business’s strengths<br />
in this project)<br />
5. Technical feasibility (size of technical gap; technical complexity; company track<br />
record and experience technically in similar projects)<br />
11