Effects on benthic scavengers of discards and damaged benthos ...
Effects on benthic scavengers of discards and damaged benthos ...
Effects on benthic scavengers of discards and damaged benthos ...

Create successful ePaper yourself
Turn your PDF publications into a flip-book with our unique Google optimized e-Paper software.
1400 S. Groenewold <strong>and</strong> Mark F<strong>on</strong>ds<br />
Stomach fullness index (%)<br />
12<br />
10<br />
8<br />
6<br />
4<br />
2<br />
0<br />
LIM<br />
Ref-<br />
Tra<br />
PLE<br />
Ref-<br />
Tra<br />
CAL<br />
Ref-<br />
Tra<br />
TRI<br />
Ref-<br />
Tra<br />
MER<br />
Ref-<br />
Tra<br />
Species <strong>and</strong> sample area<br />
MYO<br />
Ref-<br />
Tra<br />
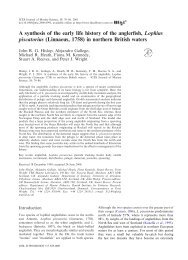
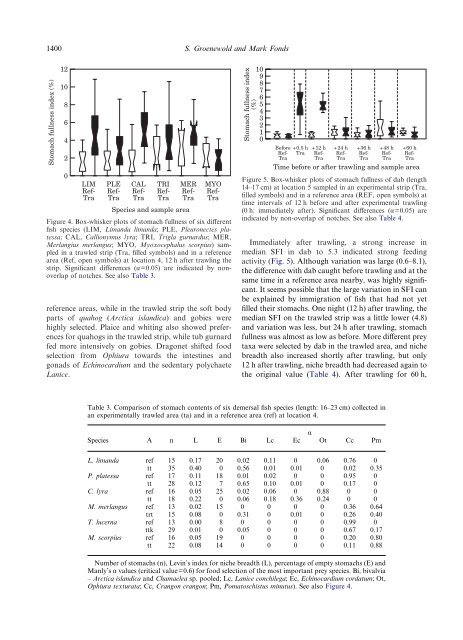
Figure 4. Box-whisker plots <strong>of</strong> stomach fullness <strong>of</strong> six different<br />
fish species (LIM, Lim<strong>and</strong>a lim<strong>and</strong>a; PLE, Pleur<strong>on</strong>ectes platessa;<br />
CAL, Calli<strong>on</strong>ymus lyra; TRI, Trigla gurnardus; MER,<br />
Merlangius merlangus; MYO, Myoxocephalus scorpius) sampled<br />
in a trawled strip (Tra, filled symbols) <strong>and</strong> in a reference<br />
area (Ref, open symbols) at locati<strong>on</strong> 4, 12 h after trawling the<br />
strip. Significant differences (�=0.05) are indicated by n<strong>on</strong>overlap<br />
<strong>of</strong> notches. See also Table 3.<br />
reference areas, while in the trawled strip the s<strong>of</strong>t body<br />
parts <strong>of</strong> quahog (Arctica isl<strong>and</strong>ica) <strong>and</strong> gobies were<br />
highly selected. Plaice <strong>and</strong> whiting also showed preferences<br />
for quahogs in the trawled strip, while tub gurnard<br />
fed more intensively <strong>on</strong> gobies. Drag<strong>on</strong>et shifted food<br />
selecti<strong>on</strong> from Ophiura towards the intestines <strong>and</strong><br />
g<strong>on</strong>ads <strong>of</strong> Echinocardium <strong>and</strong> the sedentary polychaete<br />
Lanice.<br />
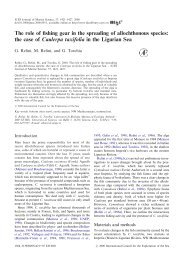
Immediately after trawling, a str<strong>on</strong>g increase in<br />
median SFI in dab to 5.3 indicated str<strong>on</strong>g feeding<br />
activity (Fig. 5). Although variati<strong>on</strong> was large (0.6–8.1),<br />
the difference with dab caught before trawling <strong>and</strong> at the<br />
same time in a reference area nearby, was highly significant.<br />
It seems possible that the large variati<strong>on</strong> in SFI can<br />
be explained by immigrati<strong>on</strong> <strong>of</strong> fish that had not yet<br />
filled their stomachs. One night (12 h) after trawling, the<br />
median SFI <strong>on</strong> the trawled strip was a little lower (4.8)<br />
<strong>and</strong> variati<strong>on</strong> was less, but 24 h after trawling, stomach<br />
fullness was almost as low as before. More different prey<br />
taxa were selected by dab in the trawled area, <strong>and</strong> niche<br />
breadth also increased shortly after trawling, but <strong>on</strong>ly<br />
12 h after trawling, niche breadth had decreased again to<br />
the original value (Table 4). After trawling for 60 h,<br />
Table 3. Comparis<strong>on</strong> <strong>of</strong> stomach c<strong>on</strong>tents <strong>of</strong> six demersal fish species (length: 16–23 cm) collected in<br />
an experimentally trawled area (ta) <strong>and</strong> in a reference area (ref) at locati<strong>on</strong> 4.<br />
Species A n L E<br />
Stomach fullness index<br />
(%)<br />
�<br />
Bi Lc Ec Ot Cc Pm<br />
L. lim<strong>and</strong>a ref 15 0.17 20 0.02 0.11 0 0.06 0.76 0<br />
tt 35 0.40 0 0.56 0.01 0.01 0 0.02 0.35<br />
P. platessa ref 17 0.11 18 0.01 0.02 0 0 0.95 0<br />
tt 28 0.12 7 0.65 0.10 0.01 0 0.17 0<br />
C. lyra ref 16 0.05 25 0.02 0.06 0 0.88 0 0<br />
tt 18 0.22 0 0.06 0.18 0.36 0.24 0 0<br />
M. merlangus ref 13 0.02 15 0 0 0 0 0.36 0.64<br />
trt 15 0.08 0 0.31 0 0.01 0 0.26 0.40<br />
T. lucerna ref 13 0.00 8 0 0 0 0 0.99 0<br />
ttk 29 0.01 0 0.05 0 0 0 0.67 0.17<br />
M. scorpius ref 16 0.05 19 0 0 0 0 0.20 0.80<br />
tt 22 0.08 14 0 0 0 0 0.11 0.88<br />
Number <strong>of</strong> stomachs (n), Levin’s index for niche breadth (L), percentage <strong>of</strong> empty stomachs (E) <strong>and</strong><br />
Manly’s � values (critical value=0.6) for food selecti<strong>on</strong> <strong>of</strong> the most important prey species. Bi, bivalvia<br />
– Arctica isl<strong>and</strong>ica <strong>and</strong> Chamaelea sp. pooled; Lc, Lanice c<strong>on</strong>chilega; Ec,Echinocardium cordatum; Ot,<br />
Ophiura texturata; Cc,Crang<strong>on</strong> crang<strong>on</strong>; Pm, Pomatoschistus minutus). See also Figure 4.<br />
10<br />
9<br />
8<br />
7<br />
6<br />
5<br />
4<br />
3<br />
2<br />
1<br />
0<br />
Before<br />
Ref-<br />
Tra<br />
+0.5 h<br />
Tra<br />
+12 h<br />
Ref-<br />
Tra<br />
+24 h<br />
Ref-<br />
Tra<br />
+36 h<br />
Ref-<br />
Tra<br />
+48 h<br />
Ref-<br />
Tra<br />
+60 h<br />
Ref-<br />
Tra<br />
Time before or after trawling <strong>and</strong> sample area<br />
Figure 5. Box-whisker plots <strong>of</strong> stomach fullness <strong>of</strong> dab (length<br />
14–17 cm) at locati<strong>on</strong> 5 sampled in an experimental strip (Tra,<br />
filled symbols) <strong>and</strong> in a reference area (REF, open symbols) at<br />
time intervals <strong>of</strong> 12 h before <strong>and</strong> after experimental trawling<br />
(0 h: immediately after). Significant differences (�=0.05) are<br />
indicated by n<strong>on</strong>-overlap <strong>of</strong> notches. See also Table 4.