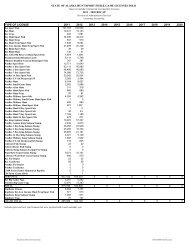
42 Table 7.–Sport harvest and catch <strong>of</strong> <strong>no</strong>rthern pike in the Tanana River drainage, 2001–2011. Harvest Year 5-yr Average 10-yr Average 2001 2002 2003 2004 2005 2006 2007 2008 2009 2010 2011 2006–2010 2001–2010 Minto Flats 641 483 1,260 1,199 1,880 935 1,712 258 765 569 396 Minto Flats complex a 654 650 1,284 1,390 2,052 1,204 1,809 386 873 609 422 George Lake 610 223 738 149 853 217 776 264 567 681 82 Healy Lake 0 39 0 45 0 9 0 0 88 0 0 Deadman Lake 28 35 0 76 24 42 0 72 13 0 0 Volkmar Lake 40 127 24 30 12 55 0 51 26 59 16 Mineral Lake (into Station Creek) 73 0 57 0 177 41 45 0 170 168 0 Catch Other Tanana 2,802 2,362 844 3,205 1,506 1,708 1,270 608 1,279 1,135 689 Total Tanana Harvest 4,207 3,436 2,947 4,895 4,624 3,276 3,900 1,381 3,016 2,652 1,209 Minto Flats 2,849 8,806 8,706 19,205 14,839 7,284 11,346 2,926 6,623 6,477 3,362 Minto Flats complex a 2,916 10,085 12,997 21,159 16,768 8,447 14,077 3,988 7,915 8,088 3,911 George Lake 5,146 2,149 4,097 2,723 4,484 2,958 6,889 1,442 3,152 4,010 1,574 Healy Lake 0 255 449 151 0 27 0 0 704 0 0 Deadman Lake 379 571 546 754 1,091 179 345 180 707 0 0 Volkmar Lake 390 304 339 603 280 186 174 51 244 381 244 Mineral Lake (into Station Creek) 344 666 244 0 977 122 465 0 440 309 0 Other Tanana 11,337 11,116 6,919 11,320 10,300 6,947 9,627 4,669 5,719 7,288 7,943 Total Tanana Catch 20,512 25,146 25,591 36,710 33,900 18,866 31,577 10,330 18,881 20,076 13,672 Source: Jennings et al. (2004, 2006a–b, 2009a-b, 2010a-b, 2011a-b); Walker et al. (2003). a Includes Minto Flats, Tolovana River, and the Lower Chatanika River. 848 970 976 1,091 501 508 19 18 25 29 38 42 85 73 1,200 1,672 2,845 3,433 6,931 8,906 8,503 10,644 3,690 3,705 146 159 282 475 207 295 267 357 6,850 8,524 19,946 24,159
Table 8.–Estimated <strong>no</strong>rthern pike abundance in the Minto Lakes Study Area, 1987–1988, 1990–1991, 1996–1997, 2000, 2003, and 2008. > 400mm (~16 in) > 525 mm (~20 in) > 600mm (~24 in) Year Abundance SE Abundance SE Abundance SE 1987 – – 11,257 3,075 – – 1988 – – 13,233 3,143 – – 1990 – – 27,418 6,800 – – 1991 – – 17,633 5,480 – – 1996 23,850 7,799 20,695 6,765 7,616 883 1997 16,547 1,754 14,639 1,552 3,251 174 2000 – – – – 5,331 1,152 2003 25,227 4,529 13,900 2,918 7,683 2,347 2008 9,854 1,701 – – 2,092 448 Source: Burkholder (1989, 1990); Hansen and Burkholder (1992); Joy (2009); Roach (1997, 1998); Scanlon (2001, 2006). SE = standard error. 43