Experience of WAMS Development and Applications in Brazil
Experience of WAMS Development and Applications in Brazil
Experience of WAMS Development and Applications in Brazil

Create successful ePaper yourself
Turn your PDF publications into a flip-book with our unique Google optimized e-Paper software.
<strong>Experience</strong> <strong>of</strong> <strong>WAMS</strong> <strong>Development</strong> <strong>and</strong> <strong>Applications</strong> <strong>in</strong> <strong>Brazil</strong><br />
Ildemar C. Decker Agu<strong>in</strong>aldo S. e Silva Fern<strong>and</strong>o B. Prioste<br />
UFSC UFSC UFSC<br />
Florianópolis, <strong>Brazil</strong> Florianópolis, <strong>Brazil</strong> Florianópolis, <strong>Brazil</strong><br />
decker@labplan.ufsc.br agu<strong>in</strong>ald@labspot.ufsc.br prioste@labspot.ufsc.br<br />
Marcelo N. Agost<strong>in</strong>i Daniel Dotta<br />
UFSC IFSC<br />
Florianópolis, <strong>Brazil</strong> Florianópolis, <strong>Brazil</strong><br />
agost<strong>in</strong>i@labplan.ufsc.br dotta@ifsc.edu.br<br />
Abstract - In this paper, the development <strong>and</strong> applications<br />
<strong>of</strong> <strong>WAMS</strong> (Wide Area Measurement Systems) <strong>in</strong> <strong>Brazil</strong><br />
is presented. Currently, all geo-electric regions <strong>of</strong> the country<br />
are covered by a low voltage <strong>WAMS</strong>. Monitor<strong>in</strong>g <strong>of</strong> oscillation<br />
modes, evaluation <strong>of</strong> controllers robustness, assessment<br />
<strong>of</strong> protection sett<strong>in</strong>gs, model validation <strong>and</strong> large events<br />
<strong>and</strong> black-outs diagnosis are the ma<strong>in</strong> applications to the<br />
<strong>Brazil</strong>ian Interconnected System <strong>and</strong> are described <strong>in</strong> the paper.<br />
Keywords - <strong>WAMS</strong>, PMU, Power System Dynamics<br />
1 Introduction<br />
THE <strong>Brazil</strong>ian Interconnected Power System (BIPS) is<br />
a large system cover<strong>in</strong>g an extensive geographical region.<br />
It has several ma<strong>in</strong> transmission corridors associated<br />
to the Itaipu <strong>and</strong> Tucuruí large power plants <strong>and</strong> to<br />
the <strong>in</strong>terconnection between the Northern <strong>and</strong> Southeastern<br />
regions. Isolated power systems <strong>in</strong> the Northern region<br />
are be<strong>in</strong>g <strong>in</strong>terconnected to the rest <strong>of</strong> the system <strong>and</strong> new<br />
generation plants are be<strong>in</strong>g built <strong>in</strong> the Amazon region.<br />
BIPS constitutes an environment suited to assess the benefits<br />
brought by the <strong>WAMS</strong> technology.<br />
The development <strong>of</strong> synchronized phasor measurements<br />
<strong>in</strong> <strong>Brazil</strong> started <strong>in</strong> 2003 aim<strong>in</strong>g to develop <strong>and</strong> dissem<strong>in</strong>ate<br />
the new technology <strong>and</strong> to acquire real system<br />
data for educational purposes. The small <strong>in</strong>itial prototype<br />
evolved to a nation wide system cover<strong>in</strong>g all geo-electric<br />
regions <strong>of</strong> the country. The project academic orig<strong>in</strong> led to<br />
a low voltage system where the measurements are carried<br />
out at outlet voltage. One result <strong>of</strong> the project has been<br />
the analysis <strong>of</strong> BIPS us<strong>in</strong>g low-voltage record<strong>in</strong>gs, allow<strong>in</strong>g<br />
the evaluation <strong>of</strong> the benefits <strong>and</strong> limitations <strong>of</strong> the application<br />
<strong>of</strong> <strong>WAMS</strong> to the BIPS. The results have shown<br />
the capability <strong>of</strong> a synchronized phasor measurement system<br />
to provide significant <strong>in</strong>formation on the BIPS performance<br />
<strong>and</strong> data acquired by the <strong>WAMS</strong> have been used by<br />
the System Operator.<br />
In this paper an overview <strong>of</strong> the experience <strong>and</strong> benefits<br />
<strong>of</strong> the utilization <strong>of</strong> <strong>WAMS</strong> <strong>in</strong> <strong>Brazil</strong> is presented. The<br />
characteristics <strong>and</strong> expansion <strong>of</strong> the <strong>WAMS</strong> is described<br />
<strong>and</strong> its ma<strong>in</strong> applications <strong>and</strong> results are discussed.<br />
The paper is organized as follows. In Section 2, the<br />
<strong>Brazil</strong>ian Interconnected Power System is depicted. In<br />
Section 3, the MedFasee <strong>WAMS</strong> Project is described. In<br />
Section 4, applications to the BIPS are presented. F<strong>in</strong>ally<br />
<strong>in</strong> Section 5, the paper closes with an evaluation <strong>of</strong> the<br />
current results <strong>and</strong> the potential benefits <strong>of</strong> a future larger<br />
scale application <strong>of</strong> synchronized phasor measurements to<br />
the BIPS.<br />
2 The <strong>Brazil</strong>ian Interconnected Power System<br />
The BIPS has an <strong>in</strong>stalled capacity <strong>of</strong> about 100 GW,<br />
with predom<strong>in</strong>ant hydroelectric generation (about 70%).<br />
The high voltage transmission grid has about 90000 km <strong>of</strong><br />
transmission l<strong>in</strong>es, with voltages rang<strong>in</strong>g from 230 kV to<br />
765 kV.<br />
The system comprises five geographical regions:<br />
North, Northeast, South, Southeast <strong>and</strong> Midwest. All<br />
these regions are <strong>in</strong>terconnected. There are several small<br />
isolated power systems <strong>in</strong> the Northern region.<br />
The largest powerplant, Itaipu, has 20 generators with<br />
a generation capacity <strong>of</strong> 14000 MW, half <strong>in</strong> 60 Hz <strong>and</strong> half<br />
<strong>in</strong> 50 Hz. Itaipu 60 Hz generated power is transmitted to<br />
the Southern <strong>and</strong> Southeastern regions by three transmission<br />
l<strong>in</strong>es <strong>of</strong> 765 kV. Most <strong>of</strong> the 50 Hz generated power<br />
is transmitted to the Southeastern region by a 600 kV DC<br />
l<strong>in</strong>k with the rema<strong>in</strong><strong>in</strong>g generation supply<strong>in</strong>g Paraguay.<br />
BIPS is characterized by vast areas with dense population<br />
<strong>and</strong> load concentration with a strong network. These<br />
areas are connected by a few very long transmission l<strong>in</strong>es,<br />
go<strong>in</strong>g through sparsely populated regions.<br />
Recently, isolated systems <strong>in</strong> the Northern region were<br />
or are be<strong>in</strong>g connected to the rest <strong>of</strong> the system <strong>in</strong> order<br />
to meet the requirements <strong>of</strong> a grow<strong>in</strong>g economic activity<br />
<strong>in</strong> regions close to the country Northern borders. Long<br />
transmission l<strong>in</strong>es are required for these connections. The<br />
construction <strong>of</strong> large hydroelectrical powerplants <strong>in</strong> the<br />
Amazon region (Madeira River) will require 2500 km long<br />
l<strong>in</strong>es to supply the ma<strong>in</strong> load <strong>in</strong> the Southeastern region.<br />
As a large <strong>in</strong>terconnected system, BIPS has several<br />
<strong>in</strong>terarea oscillation modes. Their frequency ranges are<br />
presented <strong>in</strong> Table 1. These oscillation modes are well<br />
damped but <strong>in</strong> several operat<strong>in</strong>g conditions their damp<strong>in</strong>g<br />
can be reduced.<br />
Mode Frequency range (Hz)<br />
North-South 0.20-0.40 Hz<br />
South-Southeast 0.60-0.80 Hz<br />
North-Northeast 0.55-0.65 Hz<br />
Mato Grosso state-BIPS 0.55-0.65 Hz<br />
Rio de Janeiro state-BIPS 0.40-0.45 Hz<br />
São Paulo state-BIPS 0.65-0.75 Hz<br />
Table 1: BIPS <strong>in</strong>terarea oscillation modes<br />
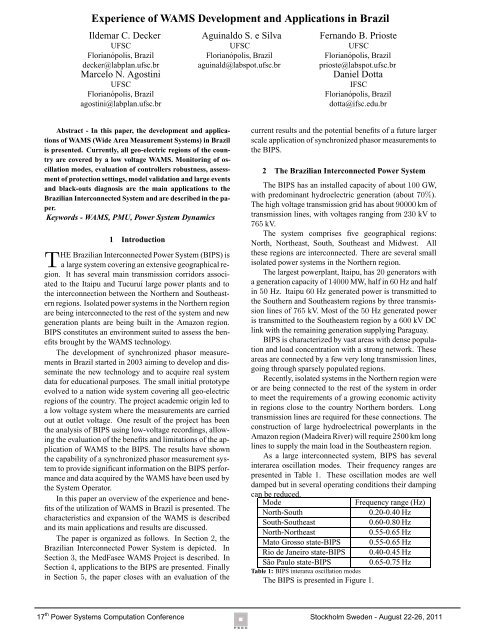
The BIPS is presented <strong>in</strong> Figure 1.<br />
17 th Power Systems Computation Conference Stockholm Sweden - August 22-26, 2011
Porto<br />
Velho<br />
NW1<br />
Figure 1: <strong>Brazil</strong>ian Interconnected Power System<br />
3 The MedFasee <strong>WAMS</strong> Project<br />
The MedFasee project started <strong>in</strong> 2003 with the ma<strong>in</strong><br />
goal to develop the synchronized phasor measurement<br />
technology <strong>in</strong> <strong>Brazil</strong> <strong>and</strong> study its applications [1]. The<br />
project was developed <strong>in</strong> three phases.<br />
3.1 Phase I<br />
A first prototype with three Phasor Measurement Units<br />
(PMUs) <strong>and</strong> a Phasor Data Concentrator (PDC) was completed<br />
by the end <strong>of</strong> 2004. The PMUs were <strong>in</strong>stalled at<br />
three universities <strong>in</strong> Southern <strong>Brazil</strong>. The PMUs measured<br />
the three-phase outlet voltage. The phasors were sent to<br />
a PDC <strong>in</strong>stalled at Federal University <strong>of</strong> Santa Catar<strong>in</strong>a<br />
(UFSC) <strong>in</strong> Florianópolis, Santa Catar<strong>in</strong>a state. Although<br />
commercial alternatives were available at the time, the<br />
PMU prototypes <strong>and</strong> the PDC were totally developed by<br />
the MedFasee team [1] <strong>in</strong> order to acquire know-how <strong>in</strong><br />
<strong>WAMS</strong> technology.<br />
The PDC ran the GNU/L<strong>in</strong>ux operat<strong>in</strong>g system with<br />
the RTAI for real-time support. Its functions were implemented<br />
us<strong>in</strong>g the Object Oriented Model<strong>in</strong>g paradigm<br />
<strong>and</strong> C++ programm<strong>in</strong>g language <strong>and</strong> adhered to the IEEE<br />
1344/95 St<strong>and</strong>ard.<br />
3.2 Phase II<br />
In 2008, the prototype was exp<strong>and</strong>ed, with the <strong>in</strong>stallation<br />
<strong>of</strong> PMUs <strong>in</strong> another six universities around the coun-<br />
W1<br />
S3<br />
S1<br />
S2<br />
N1<br />
Belém<br />
M1<br />
SE1<br />
SW1<br />
São Carlos<br />
Ilha Solteira SE2<br />
SE3<br />
SE4<br />
Florianópolis<br />
NE1<br />
Camp<strong>in</strong>a<br />
Gr<strong>and</strong>e<br />
NE2<br />
Legend<br />
Existent Future Hydro Complex<br />
138 kV<br />
A Paraná<br />
230 kV<br />
345 kV<br />
B Paranapanema<br />
440 kV<br />
C Gr<strong>and</strong>e<br />
500 kV<br />
750 kV<br />
D Paranaíba<br />
+<br />
- 600 kV cc<br />
E Paulo Afonso<br />
PMU<br />
PDC<br />
try. S<strong>in</strong>ce the results from Phase I had shown that from the<br />
low voltage relevant <strong>in</strong>formation on the high voltage system<br />
could be acquired, this expansion would allow a wider<br />
monitor<strong>in</strong>g <strong>of</strong> the BIPS, cover<strong>in</strong>g most <strong>of</strong> its geo-electric<br />
regions.<br />
The old PMU prototypes were replaced by new equipment<br />
<strong>and</strong> the PDC was redesigned follow<strong>in</strong>g the IEEE<br />
37118/2005 st<strong>and</strong>ard.<br />
3.3 Phase III<br />
In 2010, five PMUs were <strong>in</strong>corporated to the low voltage<br />
<strong>WAMS</strong>, improv<strong>in</strong>g the BIPS observability <strong>and</strong> cover<strong>in</strong>g<br />
all BIPS geo-electric regions. The current prototype,<br />
with the locations <strong>of</strong> the PMUs <strong>and</strong> the PDC, is shown <strong>in</strong><br />
Figure 1. The labels attached to the PMUs are used for<br />
identification <strong>in</strong> the graphics throughout the paper.<br />
Although the PDC developed for the project was kept,<br />
a hierarchical architecture was developed, aim<strong>in</strong>g an application<br />
to a <strong>Brazil</strong>ian utility. The openPDC, freely provided<br />
by Tennessee Valley Authority (TVA), is currently<br />
<strong>in</strong>tegrated to the <strong>WAMS</strong> prototype as a Front End PDC. It<br />
has been tested <strong>and</strong> its performance is comparable, for the<br />
project purposes, with the MedFasee PDC.<br />
17 th Power Systems Computation Conference Stockholm Sweden - August 22-26, 2011
4 <strong>Applications</strong> to BIPS<br />
The applications for the evaluation <strong>of</strong> the BIPS performance<br />
constitute the ma<strong>in</strong> topic <strong>of</strong> this paper. The ma<strong>in</strong><br />
applications presented are:<br />
1. Monitor<strong>in</strong>g <strong>of</strong> electromechanical oscillation modes<br />
2. Evaluation <strong>of</strong> system controls performance <strong>and</strong> robustness<br />
3. Evaluation <strong>of</strong> special protection systems<br />
4. System wide model validation<br />
5. Diagnosis <strong>of</strong> large events <strong>and</strong> blackouts<br />
4.1 Monitor<strong>in</strong>g <strong>of</strong> electromechanical oscillation modes<br />
The frequencies <strong>of</strong> the BIPS dom<strong>in</strong>ant oscillation<br />
modes have been monitored by the low voltage <strong>WAMS</strong>.<br />
Cont<strong>in</strong>uous monitor<strong>in</strong>g can be performed us<strong>in</strong>g the FFT<br />
(Fast Fourier Transform) algorithm [2, 3]. Although<br />
damp<strong>in</strong>g can not be directly estimated, the algorithm is<br />
important to detect the ma<strong>in</strong> electromechanical oscillation<br />
modes found <strong>in</strong> near-real time operation. An application<br />
us<strong>in</strong>g C++ was implemented to capture real-time data<br />
<strong>and</strong> to process them us<strong>in</strong>g data blocks. System frequency<br />
<strong>and</strong> voltage angle differences are suitable signals to detect<br />
local <strong>and</strong> <strong>in</strong>ter-area mode oscillation, respectively. The<br />
data block size is configurable accord<strong>in</strong>g to the oscillation<br />
mode period. This application is work<strong>in</strong>g <strong>in</strong> near real-time<br />
at UFSC <strong>and</strong> its graphical output is shown <strong>in</strong> Figure 2.<br />
Spectral Analysis<br />
Sep-10-2010 21:38:57<br />
Actions Sett<strong>in</strong>gs<br />
PMUs<br />
UFPA<br />
UNIFEI<br />
UNB<br />
COPPE<br />
UFC<br />
USP-SC<br />
UTFPR<br />
UFSC<br />
UNIR<br />
Start<br />
Stop<br />
Plot<br />
Frequency<br />
UFPA<br />
UFSC<br />
Ang. Difference<br />
Magnitude<br />
Magnitude<br />
-0,236<br />
-0,24<br />
-0,244<br />
-0,248<br />
-0,252<br />
-0,256<br />
-0,26<br />
0.003<br />
0.003<br />
0.002<br />
0.002<br />
0.001<br />
0.001<br />
0.001<br />
Signal<br />
1.284.154.705 1.284.154.710 1.284.154.715 1.284.154.720 1.284.154.725 1.284.154.730 1.284.154.735<br />
Time (s)<br />
Frequency Spectrum<br />
0.000<br />
0<br />
0 0,1 0,2 0,3 0,4 0,5 0,6 0,7 0,8 0,9 1 1,1 1,2 1,3 1,4 1,5 1,6 1,7 1,8 1,9 2<br />
Frequency (Hz)<br />
Figure 2: Ambient Data Frequency Spectrum<br />
4.2 Evaluation <strong>of</strong> damp<strong>in</strong>g controllers performance <strong>and</strong><br />
robustness<br />
Adequate damp<strong>in</strong>g <strong>of</strong> the BIPS electromechanical oscillation<br />
modes is provided ma<strong>in</strong>ly by Power System Stabilizers<br />
(PSSs), tuned by the System Operator. The TCSC<br />
(Thyristor Controlled Series Capacitor) at the North-<br />
Southeast <strong>in</strong>terconnection, <strong>in</strong>stalled <strong>in</strong> order to damp the<br />
North-South oscillation mode, has currently little effect on<br />
damp<strong>in</strong>g.<br />
The PSS tun<strong>in</strong>g requires a m<strong>in</strong>imum damp<strong>in</strong>g for the<br />
dom<strong>in</strong>ant electromechanical oscillation modes for very<br />
different topologies. Tripp<strong>in</strong>g <strong>of</strong> the N-SE <strong>and</strong> S-NE<br />
<strong>in</strong>terconnections lead to topological configurations for<br />
which the PSSs must provide adequate damp<strong>in</strong>g. The<br />
ANATEM [4], a simulation program, <strong>and</strong> PACDYN [5],<br />
a small-signal stability program, are used to evaluate the<br />
system performance. Although typical load configurations<br />
are used for that evaluation, it is difficult to assess<br />
the PSSs performance <strong>and</strong> robustness for all comb<strong>in</strong>ations<br />
<strong>of</strong> system topologies <strong>and</strong> load levels. The monitor<strong>in</strong>g <strong>of</strong><br />
the dom<strong>in</strong>ant oscillation modes allows the estimation <strong>of</strong><br />
damp<strong>in</strong>g <strong>and</strong> frequency for any system topology <strong>and</strong> load<br />
configuration, <strong>and</strong> therefore, the evaluation <strong>of</strong> the damp<strong>in</strong>g<br />
controllers <strong>in</strong> much more diversified operat<strong>in</strong>g conditions.<br />
4.2.1 Performance <strong>and</strong> robustness for powerflow<br />
changes<br />
A limited number <strong>of</strong> scenarios are usually considered<br />
for PSS tun<strong>in</strong>g. However, on the course <strong>of</strong> the day comb<strong>in</strong>ations<br />
<strong>of</strong> systems topologies, power dispatch <strong>and</strong> load<br />
dem<strong>and</strong> produce a wide range <strong>of</strong> scenarios. The mode<br />
estimation us<strong>in</strong>g <strong>WAMS</strong> data allows that the PSS performance<br />
<strong>and</strong> robustness for these scenarios be evaluated.<br />
The frequency <strong>and</strong> damp<strong>in</strong>g <strong>of</strong> the N-S mode are estimated<br />
us<strong>in</strong>g three scenarios <strong>in</strong> a s<strong>in</strong>gle day, February 10,<br />
2010. S<strong>in</strong>ce the damp<strong>in</strong>g <strong>of</strong> the N-S mode is highly sensitive<br />
to the N-SE power flow, these scenarios were chosen<br />
for three N-SE power flow levels:<br />
1. Low power flow, time w<strong>in</strong>dow 04:00 to 04:30<br />
2. Intermediate power flow, time w<strong>in</strong>dow 14:00 to 14:30<br />
3. Heavy power flow, time w<strong>in</strong>dow 18:00 to 18:30<br />
Ambient data <strong>and</strong> the N4SID subspace method [6, 7]<br />
are used for this estimation. A set <strong>of</strong> signals formed by frequencies<br />
measured by the PMUs, <strong>in</strong> a slid<strong>in</strong>g ten-m<strong>in</strong>ute<br />
time w<strong>in</strong>dow, provided the <strong>in</strong>put data for the method. A<br />
10 m<strong>in</strong> data block is required to start the identification.<br />
The estimates for the frequency <strong>and</strong> damp<strong>in</strong>g for the N-S<br />
mode are presented <strong>in</strong> Figure 3 <strong>and</strong> Figure 4, respectively.<br />
Modal Frequency (Hz)<br />
0.45<br />
0.4<br />
0.35<br />
0.3<br />
0.25<br />
0.2<br />
0.15<br />
0.1<br />
0.05<br />
Scenario 1<br />
Scenario 2<br />
Scenario 3<br />
0<br />
0:00 10:00<br />
Time (m<strong>in</strong>)<br />
20:00<br />
Figure 3: Frequency <strong>of</strong> the North-South mode.<br />
Modal Damp<strong>in</strong>g (%)<br />
18<br />
16<br />
14<br />
12<br />
10<br />
8<br />
6<br />
4<br />
2<br />
Scenario 1<br />
Scenario 2<br />
Scenario 3<br />
0<br />
0:00 10:00<br />
Time (m<strong>in</strong>)<br />
20:00<br />
Figure 4: Damp<strong>in</strong>g <strong>of</strong> the North-South mode.<br />
There is a strong correlation between the damp<strong>in</strong>g <strong>and</strong><br />
the power flow curves. The damp<strong>in</strong>g <strong>of</strong> the N-S mode <strong>in</strong>-<br />
17 th Power Systems Computation Conference Stockholm Sweden - August 22-26, 2011
creases as the N-SE power flow decreases. A high damp<strong>in</strong>g<br />
is achieved for most <strong>of</strong> the operat<strong>in</strong>g conditions. For<br />
heavy power flow on the N-SE <strong>in</strong>terconnection, the damp<strong>in</strong>g<br />
is reduced to about 5%. This confirms the robustness<br />
<strong>of</strong> the PSS tun<strong>in</strong>gs which guarantees a m<strong>in</strong>imum performance<br />
for a wide range <strong>of</strong> operat<strong>in</strong>g conditions.<br />
4.2.2 Performance <strong>and</strong> robustness for large topological<br />
changes<br />
On February 2, 2010, the North-Southeast,<br />
North-Northeast <strong>and</strong> Southeast-Northeast <strong>in</strong>terconnections<br />
tripped sequentially reduc<strong>in</strong>g the BIPS to<br />
three isolated subsystems: North, Northeast <strong>and</strong><br />
South/Southeast/Midwest as shown <strong>in</strong> Figure 5.<br />
NORTH<br />
Marabá<br />
Itacaíunas<br />
C1 C3<br />
C2<br />
C4<br />
1�g Gurupi<br />
Tucuruí<br />
C1 C2 C3<br />
C1 C2 C3<br />
C1 C2<br />
15h02<br />
C1 C2<br />
Samambaia<br />
Col<strong>in</strong>as<br />
Miracema<br />
Serra da<br />
Mesa<br />
C3<br />
C2<br />
C1<br />
C1<br />
C2<br />
Peixe<br />
Serra<br />
da Mesa 2<br />
SOUTH / SOUTHEAST / MIDWEST<br />
C1<br />
C2<br />
Peixe 2<br />
Açailândia<br />
Imperatriz<br />
Ribeiro<br />
Gonçalves<br />
Rio das<br />
Éguas<br />
C1<br />
C2<br />
Presidente<br />
Dutra<br />
São João<br />
do Piauí<br />
Bom Jesus<br />
da Lapa 2<br />
NORTHEAST<br />
Teres<strong>in</strong>a II<br />
Boa Esperança<br />
Sobrad<strong>in</strong>ho<br />
Connected TL<br />
Disconnected TL<br />
Figure 5: System topologies<br />
A large overfrequency <strong>in</strong> the Northern region, aggravated<br />
by failure <strong>of</strong> protection, <strong>and</strong> underfrequency <strong>in</strong> the<br />
Southern region, shown <strong>in</strong> Figure 6, followed the isl<strong>and</strong><strong>in</strong>g.<br />
Figure 6: BIPS Frequency.<br />
Four ma<strong>in</strong> topologies associated with the system dis-<br />
connection <strong>and</strong> restoration are identified.<br />
Topology 1 (Three-isl<strong>and</strong> topology): this configuration<br />
follows the tripp<strong>in</strong>g <strong>of</strong> the North-Southeast <strong>and</strong><br />
Southeast-Northeast <strong>in</strong>terconnections. The North, the<br />
Northeast <strong>and</strong> the South/Southeast/Midwest systems form<br />
three isl<strong>and</strong>s.<br />
Topology 2 (Two-isl<strong>and</strong> topology): is associated with<br />
the North-Northeast system restoration through the 500<br />
kV Imperatriz-Presidente Dutra (C1) transmission l<strong>in</strong>e,<br />
form<strong>in</strong>g a two-isl<strong>and</strong> topology, the North/Northeast <strong>and</strong><br />
the South/Southeast/Midwest.<br />
Topology 3 (weakly restored topology): this follows<br />
the reconnection <strong>of</strong> the North/Northeast with the<br />
South/Southeast/Midwest subsystem through the 500 kV<br />
Imperatriz-Col<strong>in</strong>as(C2). The 500 kV transmission l<strong>in</strong>es<br />
Açailândia-Presidente Dutra, Marabá-Imperatriz (C1 <strong>and</strong><br />
C2), Col<strong>in</strong>as-Miracema (C2), Miracema-Gurupi (C1) <strong>and</strong><br />
Gurupi-Serra da Mesa (C1) were already reconnected.<br />
Topology 4 (complete system topology): all l<strong>in</strong>es represented<br />
on Figure 5 were reclosed with exception <strong>of</strong> the<br />
500 kV transmission l<strong>in</strong>e Miracema-Col<strong>in</strong>as (C1).<br />
Multisignal Prony analysis [8] <strong>and</strong> the N4SID subspace<br />
method were used to estimate the dom<strong>in</strong>ant oscillation<br />
modes for these topologies. In Table 2, the damp<strong>in</strong>g<br />
<strong>and</strong> frequency <strong>of</strong> the N-S, N-NE <strong>and</strong> S-SE oscillation<br />
modes, estimated by the Prony analysis, are shown. Comparable<br />
results were obta<strong>in</strong>ed by the subspace method.<br />
Modes<br />
Topology 1<br />
f (Hz) ζ (%)<br />
Topology 2<br />
f (Hz) ζ (%)<br />
Topology 3<br />
f (Hz) ζ (%)<br />
Topology 4<br />
f (Hz) ζ (%)<br />
N-S − − − − 0.21 8 0.34 11<br />
N-NE − − 0.49 11 − − − −<br />
S-SE 0.64 10 − − 0.63 7 0.70 6<br />
Table 2: Identification <strong>of</strong> the dom<strong>in</strong>ant modes by Multisignal Prony<br />
method.<br />
For Topology 1, the FFT analysis <strong>of</strong> the signals acquired<br />
by the <strong>WAMS</strong> was used to detect the S-SE, as<br />
shown <strong>in</strong> Figure 7. In Table 2, its damp<strong>in</strong>g <strong>and</strong> frequency,<br />
calculated by the parametric method, are shown.<br />
damp<strong>in</strong>g is about 10%.<br />
The<br />
Figure 7: Frequency magnitude spectrum for Topology 1<br />
For Topology 2, the FFT spectrum, given <strong>in</strong> Figure 8,<br />
shows the N-NE oscillation mode. From the Prony analysis<br />
<strong>in</strong> Table 2, damp<strong>in</strong>g <strong>of</strong> this oscillation mode is about<br />
11%. The absence <strong>of</strong> the S-SE oscillation mode for this<br />
topology is due to the lack <strong>of</strong> r<strong>in</strong>gdown data for the Prony<br />
analysis, s<strong>in</strong>ce only the North <strong>and</strong> Northeast were <strong>in</strong>volved<br />
<strong>in</strong> the topological change.<br />
17 th Power Systems Computation Conference Stockholm Sweden - August 22-26, 2011
Figure 8: Frequency magnitude spectrum for Topology 2<br />
For Topology 3, correspond<strong>in</strong>g to the weakly restored<br />
system, the frequency spectrum shown <strong>in</strong> Figure 9, <strong>in</strong>dicates<br />
the re-emergence <strong>of</strong> the N-S mode.<br />
Magnitude <strong>of</strong> Frequency (Hz)<br />
0.015<br />
0.01<br />
0.005<br />
0<br />
0,2Hz<br />
BIPS Frequency Spectrum<br />
0,6Hz<br />
N1<br />
NE1<br />
M1<br />
SE2<br />
SE3<br />
SE4<br />
S2<br />
0.2 0.4 0.6 0.8 1 1.2 1.4 1.6<br />
Frequency (Hz)<br />
Figure 9: Frequency magnitude spectrum for Topology 3<br />
The damp<strong>in</strong>g <strong>and</strong> frequency <strong>of</strong> the N-S <strong>and</strong> S-SE oscillation<br />
modes, calculated by the Prony method, are presented<br />
<strong>in</strong> Table 2. The N-S mode presents a frequency<br />
around 0.21 Hz, lower than its usual value <strong>in</strong> the range<br />
0.35 − 0.4 Hz, as given <strong>in</strong> Figure 3. The m<strong>in</strong>imum damp<strong>in</strong>g<br />
for the N-S <strong>and</strong> S-SE oscillation modes are about 8%<br />
<strong>and</strong> 7%, respectively. The N-NE mode was not detected<br />
by the Prony method.<br />
For Topology 4, the N-S mode presents a higher frequency<br />
<strong>and</strong> damp<strong>in</strong>g compared to the preced<strong>in</strong>g weaker<br />
configuration, as shown <strong>in</strong> Table 2. The m<strong>in</strong>imum damp<strong>in</strong>g<br />
for Topology 4 is about 11%.<br />
These results have shown that the ma<strong>in</strong> <strong>in</strong>terarea oscillation<br />
modes have kept a m<strong>in</strong>imum damp<strong>in</strong>g above 5%,<br />
even for critical configurations <strong>in</strong>volv<strong>in</strong>g large topological<br />
changes. This confirms that the PSSs have provided<br />
adequate robustness marg<strong>in</strong>s.<br />
4.3 Evaluation <strong>of</strong> Special Protection Systems<br />
Special Protection Systems(SPS) schemes are fundamental<br />
to keep the BIPS security follow<strong>in</strong>g large events.<br />
The performance <strong>of</strong> these schemes depends on the correct<br />
time sett<strong>in</strong>gs for the protection actuation.<br />
Although the System Operator has access to time<br />
records <strong>of</strong> the system variables which can provide <strong>in</strong>formation<br />
on the protection performance, the decentralized<br />
nature <strong>of</strong> most <strong>of</strong> the records requires effort to assemble<br />
<strong>and</strong> analyze the data. The <strong>WAMS</strong> prototype gives global<br />
<strong>and</strong> prompt <strong>in</strong>formation on the ma<strong>in</strong> system variables allow<strong>in</strong>g<br />
the time correlation between system events <strong>and</strong><br />
protection actuation. In this section, the use <strong>of</strong> the <strong>WAMS</strong><br />
for the evaluation <strong>of</strong> the SPS <strong>in</strong> the North-Southeast <strong>and</strong><br />
Acre-Rondônia <strong>in</strong>terconnections, is presented.<br />
4.3.1 SPS at the N-SE <strong>in</strong>terconnection <strong>and</strong> N/NE loadshedd<strong>in</strong>g<br />
scheme<br />
The North/Northeast <strong>and</strong> South/Southeast power system<br />
are connected by three 500 kV transmission l<strong>in</strong>es between<br />
the Northern <strong>and</strong> Southeastern regions <strong>and</strong> by one<br />
500 kV transmission l<strong>in</strong>e between the Southeastern <strong>and</strong><br />
Northeastern regions. These <strong>in</strong>terconnections improve the<br />
BIPS energy efficiency. The North-Southeast <strong>in</strong>terconnection<br />
is the ma<strong>in</strong> transmission corridor to the Southeastern<br />
region for the energy produced by the 8.4 GW Tucuruí hydroeletrical<br />
power plant. The Northeastern region presents<br />
generation deficit, import<strong>in</strong>g energy from the Northern<br />
<strong>and</strong> South/Southeastern regions.<br />
A SPS is <strong>in</strong>stalled at the North-Southeast <strong>in</strong>terconnection<br />
with the follow<strong>in</strong>g goals:<br />
To avoid loss <strong>of</strong> synchronism between the North <strong>and</strong><br />
Southeast systems<br />
To avoid overload on the 500 kV transmission system<br />
The SPS is activated by the disconnection <strong>of</strong> the<br />
500 kV transmission l<strong>in</strong>e between Serra da Mesa(SE)-<br />
Imperatriz (N). It is a complex scheme <strong>and</strong> its ma<strong>in</strong> actions<br />
are:<br />
tripp<strong>in</strong>g <strong>of</strong> the North-Southeast <strong>and</strong> Southeast-<br />
Northeast <strong>in</strong>terconnections<br />
tripp<strong>in</strong>g <strong>of</strong> generators <strong>in</strong> Tucuruí <strong>and</strong> other power plants<br />
tripp<strong>in</strong>g <strong>of</strong> capacitor banks<br />
This SPS actuates few times a year. Recently an <strong>in</strong>creas<strong>in</strong>g<br />
number <strong>of</strong> tripp<strong>in</strong>gs <strong>in</strong> the North-Southeast <strong>in</strong>terconnection<br />
has been recorded. This <strong>in</strong>crease is related to<br />
forest fire around the <strong>in</strong>terconnection transmission l<strong>in</strong>es,<br />
lead<strong>in</strong>g to short-circuits <strong>and</strong> tripp<strong>in</strong>gs.<br />
A five-step load shedd<strong>in</strong>g scheme (LSS) is also implemented<br />
<strong>in</strong> the N/NE region <strong>in</strong> order to avoid large frequency<br />
excursions, specially after the loss <strong>of</strong> the N-SE <strong>and</strong><br />
SE-NE <strong>in</strong>terconnections. This scheme is triggered when<br />
the frequency reaches a low limit <strong>of</strong> 57.3 Hz (<strong>in</strong>stantaneous),<br />
58.5 Hz (with a time delay) or a decrease rate<br />
above 0.7 Hz/s.<br />
For the evaluation <strong>of</strong> the SPS, three events started<br />
by l<strong>in</strong>e tripp<strong>in</strong>gs between the transmission l<strong>in</strong>e Gurupi-<br />
Miracema were selected:<br />
Event 1 - September 9, 2010<br />
Event 2 - September 24, 2010<br />
Event 3 - September 25, 2010<br />
In Figure 10, the frequency response for Event 1, is<br />
presented.<br />
17 th Power Systems Computation Conference Stockholm Sweden - August 22-26, 2011
Frequency (Hz)<br />
60.8<br />
60.6<br />
60.4<br />
60.2<br />
60<br />
59.8<br />
59.6<br />
N1<br />
NW1<br />
M1<br />
SE2<br />
SE3<br />
SE4<br />
S1<br />
S2<br />
Short-Circuit<br />
North-Southeast Separation<br />
BIPS Frequency<br />
Southeast-Northeast Separation<br />
600ms<br />
59.4<br />
313.5 314<br />
Time(s) - Start: 16:40:00 (UTC -3)<br />
314.5 315<br />
Figure 10: September 9, 2010 SPS actuation<br />
The total actuation time <strong>of</strong> the SPS, consist<strong>in</strong>g <strong>of</strong> the<br />
tripp<strong>in</strong>g <strong>of</strong> the N-SE <strong>and</strong> then the tripp<strong>in</strong>g <strong>of</strong> the SE-NE<br />
<strong>in</strong>terconnections, for the three events, are summarized <strong>in</strong><br />
Table 3.<br />
Event Protection time (ms)<br />
September 9, 2010 600<br />
September 24, 2010 566<br />
September 25, 2010 467<br />
Table 3: SPS actuation times<br />
The field tun<strong>in</strong>g for the actuation time for these events<br />
were 200 ms. After a reconfiguration <strong>of</strong> the SPS, the results<br />
by the <strong>WAMS</strong> allowed the detection <strong>of</strong> delays <strong>in</strong> the<br />
actuation time, as shown <strong>in</strong> Table 3.<br />
Follow<strong>in</strong>g the <strong>in</strong>terconnections tripp<strong>in</strong>g, the LSS <strong>in</strong> the<br />
N/NE region is triggered. Three steps were activated <strong>in</strong> the<br />
first <strong>and</strong> third events. In the second event only the first step<br />
<strong>of</strong> the LSS was activated. The LSS actuation for Event 1<br />
is illustrated <strong>in</strong> Figure 11.<br />
Frequency (Hz)<br />
57.8 N1<br />
NW1<br />
M1<br />
57.6<br />
Load Shedd<strong>in</strong>g<br />
SE2<br />
SE3<br />
SE4<br />
57.4<br />
S1<br />
S2<br />
57.2<br />
57<br />
BIPS Frequency<br />
317 317.2 317.4 317.6 317.8 318 318.2 318.4 318.6 318.8 319<br />
Time(s) - Start: 16:40:00 (UTC -3)<br />
Figure 11: September 9, 2010 SPS actuation<br />
In Figure 11, the protection actuations at 317.7, 318.1<br />
<strong>and</strong> 318.3 s. are clearly seen. The LSS actuation <strong>in</strong> the<br />
three events is triggered primarily by the frequency fall<strong>in</strong>g<br />
rate (0.85 Hz/s). The sett<strong>in</strong>gs for the load shedd<strong>in</strong>g steps<br />
are summarized <strong>in</strong> Table 4.<br />
SPS step Event 1 Event 2 Event 3<br />
1 57.31 57.3 58.6<br />
2 57.03 57.3<br />
3 56.97 56.9<br />
Table 4: Load shedd<strong>in</strong>g actuation thresholds (<strong>in</strong> Hz)<br />
These results have confirmed the correct actuation <strong>of</strong><br />
the SPS logic for the events <strong>and</strong> <strong>of</strong> the LSS at the <strong>in</strong>tended<br />
frequency thresholds. Delays <strong>in</strong> the actuation time <strong>of</strong> the<br />
SPS, as a result <strong>of</strong> changes <strong>in</strong> the protection logic, were<br />
detected. The ma<strong>in</strong> ga<strong>in</strong> <strong>of</strong> the <strong>WAMS</strong>, as compared with<br />
other record<strong>in</strong>gs, is the read<strong>in</strong>ess <strong>in</strong> access<strong>in</strong>g data that<br />
give a system wide overview <strong>of</strong> the protection actuation.<br />
4.3.2 SPS at Acre-Rondônia Interconnection<br />
The isolated Acre-Rondônia power system, <strong>in</strong> the far<br />
Northwestern region, was recently connected to the BIPS.<br />
The isolated power system was supplied by three thermal<br />
<strong>and</strong> one hydroelectric power plants. The BIPS <strong>in</strong>tegration<br />
is aimed at decreas<strong>in</strong>g the energy price <strong>in</strong> the region us<strong>in</strong>g<br />
cheap hydroelectrical generation from other BIPS regions<br />
<strong>and</strong> <strong>in</strong>creas<strong>in</strong>g the system reliability.<br />
The Acre-Rondônia system is connected to the BIPS<br />
by a weak 230 kV transmission system. The system depends<br />
on the thermal plants to avoid blackouts <strong>in</strong> the region<br />
while other transmission are built, <strong>and</strong> has experienced<br />
frequent disturbances that cause large frequency excursions<br />
<strong>and</strong> variable topologies.<br />
For a fast system restoration, an automatic reclos<strong>in</strong>g<br />
scheme for the 230 kV <strong>in</strong>terconnection was recently implemented.<br />
Besides that, a five-step load shedd<strong>in</strong>g scheme<br />
is <strong>in</strong> operation.<br />
Results for the evaluation <strong>of</strong> these schemes by the<br />
<strong>WAMS</strong> are presented <strong>in</strong> this section for l<strong>in</strong>e tripp<strong>in</strong>gs <strong>in</strong><br />
the follow<strong>in</strong>g dates:<br />
October 30, 2010<br />
November 11, 2010<br />
November 13, 2010<br />
The protection actuation is illustrated for the first event<br />
<strong>in</strong> Figure 12.<br />
Frequency (Hz)<br />
60.5<br />
60<br />
59.5<br />
59<br />
58.5<br />
58<br />
57.5<br />
BIPS Frequency<br />
N1<br />
NW1<br />
NE1<br />
M1<br />
SE2<br />
SE3<br />
SE4<br />
S1<br />
S2<br />
S3<br />
140 145 150 155 160<br />
Time(s) - Start: 17:10:00 (UTC -2)<br />
Figure 12: October 30, 2010<br />
The total protection actuation time for the three events<br />
are summarized <strong>in</strong> Table 5.<br />
Event Reclos<strong>in</strong>g time (s)<br />
October 30, 2010 12.9<br />
November 11, 2010 30.8<br />
November 13, 2010 20.15<br />
Table 5: Reclos<strong>in</strong>g time<br />
The operation <strong>of</strong> the LSS has been evaluated <strong>in</strong> a similar<br />
manner as already presented for the North-Southeast<br />
<strong>in</strong>terconnection.<br />
The <strong>in</strong>formation provided on the protection sett<strong>in</strong>gs allowed<br />
the System Operator to confirm the correct actuation<br />
<strong>of</strong> the protection schemes <strong>and</strong> to f<strong>in</strong>e tune the actuation<br />
times.<br />
4.4 System wide model validation<br />
A system wide model validation was performed us<strong>in</strong>g<br />
data from a large disturbance on July 4, 2009, when two<br />
17 th Power Systems Computation Conference Stockholm Sweden - August 22-26, 2011
Powered by TCPDF (www.tcpdf.org)<br />
<strong>of</strong> the three circuits <strong>of</strong> the 765 kV transmission l<strong>in</strong>e Foz<br />
do Iguaçu- Ivaiporã tripped follow<strong>in</strong>g a fault [9].<br />
The low voltage <strong>WAMS</strong> system, complemented by<br />
data from the high-voltage phasor measurement system<br />
prototype <strong>in</strong>stalled at Eletrosul, a transmission <strong>and</strong> generation<br />
utility <strong>in</strong> Southern <strong>Brazil</strong>, provided the data for the<br />
validation. The detailed models <strong>and</strong> data for generators<br />
<strong>and</strong> controllers, loads, FACTS equipment <strong>and</strong> the network<br />
provided by the System Operator were used <strong>in</strong> ANATEM,<br />
the st<strong>and</strong>ard simulation program <strong>in</strong> the <strong>in</strong>dustry.<br />
The validation procedure was based on two pr<strong>in</strong>ciples:<br />
1. Qualitative validation: the model simulation <strong>and</strong><br />
the measurement data from the phasor measurement<br />
system for variables such as system frequency, bus<br />
voltages, real <strong>and</strong> reactive power over transmission<br />
l<strong>in</strong>es <strong>and</strong> angle difference should have a similar<br />
qualitative behavior.<br />
2. Quantitative validation: the values <strong>of</strong> frequency <strong>and</strong><br />
damp<strong>in</strong>g <strong>of</strong> the dom<strong>in</strong>ant electromechanical oscillation<br />
modes estimated from the <strong>WAMS</strong> data <strong>and</strong> calculated<br />
from simulation data or from a small-signal<br />
program should result <strong>in</strong> numerical values that are<br />
close.<br />
The results presented <strong>in</strong> [9] have shown a close agreement<br />
between the acquired <strong>and</strong> simulation data <strong>and</strong> helped<br />
to <strong>in</strong>crease the confidence <strong>in</strong> the models, data <strong>and</strong> the<br />
s<strong>of</strong>tware currently used for plann<strong>in</strong>g <strong>and</strong> operation <strong>of</strong> the<br />
<strong>Brazil</strong>ian Interconnected Power System.<br />
4.5 Diagnosis <strong>of</strong> large events <strong>and</strong> blackouts<br />
Several large events <strong>in</strong> the BIPS have been monitored<br />
by the low voltage <strong>WAMS</strong>. The data record<strong>in</strong>gs <strong>of</strong> these<br />
events have been used by the System Operator for evaluation<br />
<strong>and</strong> diagnosis.<br />
The monitor<strong>in</strong>g <strong>of</strong> the large blackout on November 10,<br />
2009 was detailed <strong>in</strong> [10]. The data allowed the detection<br />
<strong>of</strong> voltage collapse, asynchronous operation <strong>and</strong> proved to<br />
be useful for the determ<strong>in</strong>ation <strong>of</strong> the sequence <strong>of</strong> events<br />
that led to the blackout.<br />
4.6 Other results<br />
The MedFasee Project has had a strong impact on<br />
teach<strong>in</strong>g <strong>and</strong> research at the UFSC. The availability <strong>of</strong><br />
real system data, especially after large events, has stimulated<br />
the <strong>in</strong>terest <strong>of</strong> undergraduate <strong>and</strong> graduate students<br />
<strong>in</strong> power systems, contribut<strong>in</strong>g to the education <strong>of</strong> a new<br />
generation <strong>of</strong> power system eng<strong>in</strong>eers. Phasor measurements<br />
are now part <strong>of</strong> courses <strong>in</strong> power system. Power<br />
system students are stimulated to attend courses on related<br />
topics such as signal process<strong>in</strong>g. Topics on the use <strong>of</strong><br />
synchronized phasor measurements for monitor<strong>in</strong>g, control<br />
<strong>and</strong> protection <strong>of</strong> power systems have been part <strong>of</strong> the<br />
research <strong>of</strong> graduate students.<br />
Two projects <strong>in</strong> collaboration with transmission utilities<br />
resulted <strong>in</strong> the development <strong>of</strong> two high-voltage phasor<br />
measurement system prototypes. A project with Eletrosul<br />
led to the <strong>in</strong>stallation <strong>of</strong> four PMUs at 525 kV substations.<br />
A second project <strong>in</strong> with CTEEP, a transmission<br />
utility, plans the <strong>in</strong>stallation <strong>of</strong> 5 PMUs <strong>in</strong> 3 substations at<br />
440 kV.<br />
5 Conclusions<br />
In this paper the experience <strong>in</strong> <strong>Brazil</strong> with a low voltage<br />
<strong>WAMS</strong> cover<strong>in</strong>g most <strong>of</strong> the country, is described.<br />
Beg<strong>in</strong>n<strong>in</strong>g as an academic project with the goal to develop<br />
<strong>and</strong> dissem<strong>in</strong>ate the synchronized phasor measurement<br />
technology, it proved to be valuable for the monitor<strong>in</strong>g,<br />
identification <strong>and</strong> performance evaluation <strong>of</strong> the<br />
BIPS. The <strong>in</strong>formation provided by the <strong>WAMS</strong> is be<strong>in</strong>g<br />
used by the <strong>Brazil</strong>ian System Operator. The results give<br />
support for the large scale <strong>WAMS</strong> to be <strong>in</strong>stalled by the<br />
System Operator.<br />
From the academic viewpo<strong>in</strong>t, the low voltage <strong>WAMS</strong><br />
has stimulated new research topics for graduate students<br />
<strong>and</strong> attracted undergraduate students for power systems,<br />
contribut<strong>in</strong>g to the formation <strong>of</strong> a new generation <strong>of</strong> power<br />
systems eng<strong>in</strong>eers prepared for the challenges <strong>of</strong> <strong>of</strong> the<br />
BIPS <strong>in</strong> the XXI century.<br />
REFERENCES<br />
[1] I. C. Decker, D. Dotta, M. N. Agost<strong>in</strong>i, S. L. Zimath,<br />
<strong>and</strong> A. S. e Silva. Performance <strong>of</strong> a synchronized<br />
phasor measurements system <strong>in</strong> the <strong>Brazil</strong>ian power<br />
system. In IEEE PES General Meet<strong>in</strong>g, Montreal,<br />
Canada, 2006.<br />
[2] P. O’Shea. The use <strong>of</strong> slid<strong>in</strong>g spectral w<strong>in</strong>dows<br />
for parameter estimation <strong>in</strong> power system disturbance<br />
monitor<strong>in</strong>g. IEEE Trans. on Power Systems,<br />
15(4):1261–1267, Nov 2000.<br />
[3] N. Kakimoto, M. Sugumi, T. Mak<strong>in</strong>o, <strong>and</strong><br />
K. Tomiyama. Monitor<strong>in</strong>g <strong>of</strong> <strong>in</strong>terarea oscillation<br />
mode by synchronized phasor measurement. IEEE<br />
Trans. on Power Systems, 21(1):260– 268, 2006.<br />
[4] CEPEL. Anatem User’s Manual, V10.4.2, 2009.<br />
[5] CEPEL. PACDYN User’s Manual, Version 6.3, 2005.<br />
[6] Peter van Overschee <strong>and</strong> Bart de Moor. Subspace<br />
identification for l<strong>in</strong>ear systems: Theory-<br />
Implementation-<strong>Applications</strong>. Kluwer, 1996.<br />
[7] Zhou N., J.W. Pierre, <strong>and</strong> J.F. Hauer. Initial results<br />
<strong>in</strong> power system identification from <strong>in</strong>jected prob<strong>in</strong>g<br />
signals us<strong>in</strong>g a subspace method. IEEE Trans. on<br />
Power Systems, 21(3):1296–1302, Aug. 2006.<br />
[8] D.J. Trudnowski, J.M. Johnson, <strong>and</strong> J.F. Hauer.<br />
Mak<strong>in</strong>g Prony analysis more accurate us<strong>in</strong>g multiple<br />
signals. IEEE Trans. on Power Systems, 14(1):226–<br />
231, Feb 1999.<br />
[9] I. C. Decker, A. S. e Silva, R. G. J. da Silva, M. N.<br />
Agost<strong>in</strong>i, N. Mart<strong>in</strong>s, <strong>and</strong> F. B. Prioste. System<br />
wide model validation <strong>of</strong> the <strong>Brazil</strong>ian <strong>in</strong>terconnected<br />
power system. In IEEE PES General Meet<strong>in</strong>g,<br />
M<strong>in</strong>neapolis, 2010.<br />
[10] I. C. Decker, M. N. Agost<strong>in</strong>i, A. S. e Silva, <strong>and</strong><br />
D. Dotta. Monitor<strong>in</strong>g <strong>of</strong> a large scale event <strong>in</strong> the<br />
<strong>Brazil</strong>ian Power System by <strong>WAMS</strong>. In IREP Symposium<br />
2010, Rio de Janeiro, August 2010.<br />
17 th Power Systems Computation Conference Stockholm Sweden - August 22-26, 2011