
You also want an ePaper? Increase the reach of your titles
YUMPU automatically turns print PDFs into web optimized ePapers that Google loves.
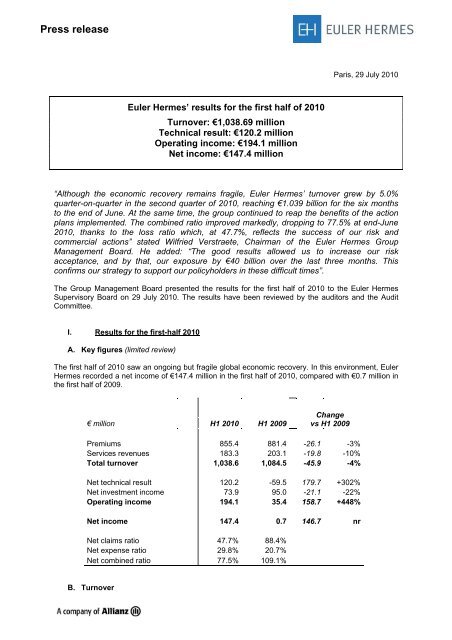
<strong>Press</strong> <strong>release</strong><br />
<strong>Euler</strong> <strong>Hermes</strong>’ results for the first half of 2010<br />
Turnover: €1,038.69 million<br />
Technical result: €120.2 million<br />
Operating income: €194.1 million<br />
Net income: €147.4 million<br />
Paris, 29 July 2010<br />
“Although the economic recovery remains fragile, <strong>Euler</strong> <strong>Hermes</strong>’ turnover grew by 5.0%<br />
quarter-on-quarter in the second quarter of 2010, reaching €1.039 billion for the six months<br />
to the end of June. At the same time, the group continued to reap the benefits of the action<br />
plans implemented. The combined ratio improved markedly, dropping to 77.5% at end-June<br />
2010, thanks to the loss ratio which, at 47.7%, reflects the success of our risk and<br />
commercial actions” stated Wilfried Verstraete, Chairman of the <strong>Euler</strong> <strong>Hermes</strong> Group<br />
Management Board. He added: “The good results allowed us to increase our risk<br />
acceptance, and by that, our exposure by €40 billion over the last three months. This<br />
confirms our strategy to support our policyholders in these difficult times”.<br />
The Group Management Board presented the results for the first half of 2010 to the <strong>Euler</strong> <strong>Hermes</strong><br />
Supervisory Board on 29 July 2010. The results have been reviewed by the auditors and the Audit<br />
Committee.<br />
I. Results for the first-half 2010<br />
A. Key figures (limited review)<br />
The first half of 2010 saw an ongoing but fragile global economic recovery. In this environment, <strong>Euler</strong><br />
<strong>Hermes</strong> recorded a net income of €147.4 million in the first half of 2010, compared with €0.7 million in<br />
the first half of 2009.<br />
€ million H1 2010 H1 2009<br />
Change<br />
vs H1 2009<br />
Premiums 855.4 881.4 -26.1 -3%<br />
Services revenues 183.3 203.1 -19.8 -10%<br />
Total turnover 1,038.6 1,084.5 -45.9 -4%<br />
Net technical result 120.2 -59.5 179.7 +302%<br />
Net investment income 73.9 95.0 -21.1 -22%<br />
Operating income 194.1 35.4 158.7 +448%<br />
Net income 147.4 0.7 146.7 nr<br />
Net claims ratio 47.7% 88.4%<br />
Net expense ratio 29.8% 20.7%<br />
Net combined ratio 77.5% 109.1%<br />
B. Turnover
For the six months to 30 June 2010 the group's turnover reached €1,038.6 million, corresponding to a<br />
-5.4% decrease compared with the first half of 2009 at constant scope and exchange rates. Turnover<br />
declined by between 1.9% and 5.2% in the main core markets, except in the Southern Europe region<br />
where <strong>Euler</strong> <strong>Hermes</strong> decided in 2009 to reduce the portfolio in Italy through non renewal of<br />
unprofitable policies, which has had a significant impact on gross earned premiums in 2010.<br />
Beside this one-off effect, the main reason for the decline was the contraction in clients’ turnover.<br />
Breakdown of turnover by region (based on earned premiums)<br />
H1 2010 H1 2009 Change H1 2009 Change<br />
€ million (1) (2) (1)/(2) (3) (1)/(3)<br />
Germany 363.3 377.4 -3.8% 377.5 -3.8%<br />
France 190.6 197.9 -3.7% 197.9 -3.7%<br />
Northern Europe 222.5 217.8 2.2% 226.7 -1.9%<br />
Southern Europe 104.7 131.7 -20.5% 131.7 -20.5%<br />
Americas 98.2 100.6 -2.4% 103.6 -5.2%<br />
Asia 27.9 27.2 2.4% 27.7 0.9%<br />
Captive + others 31.5 31.9 -1.2% 32.9 -4.3%<br />
<strong>Euler</strong> <strong>Hermes</strong> 1,038.6 1,084.5 -4.2% 1,098.0 -5.4%<br />
Notes: (1) Turnover with geographical reclassification (average rate June 2010)<br />
(2) Turnover with geographical reclassification pro forma (average rate June 2009)<br />
(3) Turnover with geographical reclassification pro forma corrected from exchange rates and perimeter effects<br />
C. Operating income<br />
The net technical result, before financial income, came to €120.2 million in the first half of 2010,<br />
compared with a loss of €59.5 million in the first half of 2009. This improvement was attributable<br />
mainly to the lower claims ratio.<br />
The net cost of claims dropped to €263.9 million, down by 50.5%, compared with end of June 2009.<br />
The net claims ratio stood at 47.7% compared with 88.4% at end-June 2009.<br />
In the first six months of 2010, <strong>Euler</strong> <strong>Hermes</strong> benefited from high positive run-offs from previous<br />
underwriting years. These net run-offs totalled €94 million and are mainly driven by a sharp drop in<br />
claims notifications (more than 50% compared with the first half of 2009). Such level of positive runoffs<br />
is not sustainable in the long run.<br />
The net expense ratio deteriorated by 9.1 points (to 29.8% from 20.7% in the first half of 2009). The<br />
main factors of this deterioration were lower reinsurance commissions (impact of 1.3 point), lower net<br />
premiums (2.2 points), lower service revenues (3.6 points) and higher gross expenses (2.1 points).<br />
The net operating result increased to €120.2 million in the first half of 2010, compared with €-59.5<br />
million in the first half of 2009, thanks to the improvement in the claims ratio.<br />
The combined ratio after reinsurance landed at 77.5%, an improvement of 31.6 points compared with<br />
the first half of 2009.<br />
Net investment income for the first six months came to €73.9 million, €21.1 million less than in the<br />
period to end-June 2009 (€95.0 million) due to lower capital gains (€-32 million), lower revenues on<br />
portfolio (€-6 million), partly offset by higher foreign exchange gains (€17.5 million).<br />
Thanks mainly to the strong recovery in the net technical result, current operating income increased<br />
from €35.4 million in the first half of 2009 to €194.1 million in the first half of 2010.<br />
The strong operational performance was reflected in net income which came to €147.4 million at end<br />
of June 2010 compared with a break-even situation at end of June 2009.
D. Investment portfolio<br />
Given the uncertain outlook for the financial markets, <strong>Euler</strong> <strong>Hermes</strong> maintained its very cautious<br />
investment strategy. At end-June 2010, the fair value of the investment portfolio, including cash and<br />
cash equivalents, came to €3,633 million, compared with €3,339 million at year-end 2009.<br />
Despite the sales and market movements during the period, unrealised capital gains and revaluation<br />
reserves totalled €80 million at end-June 2010, up from € 70 million at end-December 2009.<br />
E. Outlook<br />
The first half of 2010 saw a recovery in the world economy, although it is set to slow again in 2011.<br />
<strong>Euler</strong> <strong>Hermes</strong> expects it to be accompanied by a decline in corporate insolvencies worldwide, but<br />
foresees that this decline is likely to be moderate (down 3% in 2010 and 5% in 2011) compared with<br />
the sharp increases recorded in 2008 and 2009 and that insolvencies should not return to pre-crisis<br />
levels.<br />
In this economic environment, lacking of visibility, <strong>Euler</strong> <strong>Hermes</strong> targets to maintain recovered<br />
profitability by continuing, in parallel, to support its clients. In addition <strong>Euler</strong> <strong>Hermes</strong> foresees to<br />
improve its costs base in the next years by targeting efficiency gains in all operating areas.<br />
Results for the second quarter of 2010<br />
A. Key figures<br />
€ million Q2 2010 Q1 2010 Q2 2009<br />
Change<br />
vs Q1 2010<br />
Change<br />
vs Q2 2009<br />
Premiums 438.0 417.4 433.1 20.6 +5% 4.9 +1%<br />
Services revenues 95.1 88.2 102.8 6.9 +8% -7.7 -7%<br />
Total turnover 533.1 505.5 536.0 27.5 +5% -2.9 -1%<br />
Net technical result 95.8 24.5 -48.4 71.3 +291% 144.1 +298%<br />
Net investment income 31.3 42.6 40.7 -11.3 -27% -9.4 -23%<br />
Operating income 127.0 67.1 -7.7 60.0 +89% 134.7 nr<br />
Net income 99.8 47.6 -15.8 52.2 +110% 115.6 +731%<br />
Net claims ratio 38.0% 58.1% 93.3%<br />
Net expense ratio 27.8% 31.9% 22.3%<br />
Net combined ratio 65.8% 90.0% 115.6%<br />
<strong>Euler</strong> <strong>Hermes</strong> recorded a turnover of €533 million in the second quarter of 2010, up by 5% compared<br />
with the previous quarter (€505 million), but still down by 1% compared with the second quarter of<br />
2009 (-2.4% at constant exchange rates).<br />
<strong>Euler</strong> <strong>Hermes</strong> benefited from a favourable claims environment in the second quarter of 2010. The fall<br />
in net claims cost brought the net claims ratio to 38% in the second quarter of 2010 compared with a<br />
58.1% in the first quarter of 2010 and 93.3% in the second quarter of 2009. Net positive run-offs of<br />
€62 million were generated on previous attachment years thanks to lower-than-expected claims<br />
notifications.<br />
The net expense ratio deteriorated by 5.5 points in the second quarter of 2010 compared with the<br />
same period in 2009 (from 22.3% to 27.8%). The main factors of this deterioration were lower service<br />
revenues (impact of 2.7 points), lower reinsurance commissions (1 point) and higher gross expenses<br />
(1.4 point). Compared with the first quarter 2010, the net expense ratio improved thanks to higher<br />
premiums and service revenues.
The net technical result reached €95.8 million in the second quarter of 2010, up by €71.3 million<br />
compared with the first quarter of 2010 and by €144.2 million compared with the second quarter of<br />
2009.This improvement was attributable mainly to the lower claims level both on current and previous<br />
attachment years.<br />
Net investment income amounted to €28 million in the second quarter of 2010.<br />
Supported by a strong operational performance, net income for the second quarter of 2010 rose to<br />
€99.8 million compared with €47.6 million in the first quarter of 2010.<br />
B. Breakdown of turnover by region (based on earned premiums)<br />
Q2 2010 Q2 2009 Change Q2 2009 Change<br />
€ million (1) (2) (1)/(2) (3) (1)/(3)<br />
Germany 187.8 186.5 0.7% 186.6 0.7%<br />
France 99.3 97.2 2.1% 97.2 2.1%<br />
Northern Europe 114.3 110.2 3.7% 114.5 -0.1%<br />
Southern Europe 46.9 61.7 -24.0% 61.8 -24.0%<br />
Americas 53.0 48.7 8.8% 53.9 -1.7%<br />
Asia 13.4 15.0 -10.6% 15.2 -11.7%<br />
Captive + others 18.3 16.6 10.2% 16.9 8.3%<br />
<strong>Euler</strong> <strong>Hermes</strong> 533.1 536.0 -0.5% 546.1 -2.4%<br />
Notes: (1) Turnover with geographical reclassification (average rate June 2010)<br />
(2) Turnover with geographical reclassification pro forma (average rate June 2009)<br />
(3) Turnover with geographical reclassification pro forma corrected from exchange rates and perimeter effects<br />
***<br />
<strong>Euler</strong> <strong>Hermes</strong> is the worldwide leader in credit insurance and one of the leaders in the areas of<br />
bonding, guarantees and collections. With 6,200 employees in over 50 countries, <strong>Euler</strong> <strong>Hermes</strong> offers<br />
a complete range of services for the management of B-to-B trade receivables and posted a<br />
consolidated turnover of €2.1 billion in 2009.<br />
<strong>Euler</strong> <strong>Hermes</strong> has developed a credit intelligence network that enables it to analyse the financial<br />
stability of 40 million businesses across the globe.<br />
The group protects worldwide business transactions totalling €700 billion.<br />
<strong>Euler</strong> <strong>Hermes</strong>, subsidiary of Allianz, is listed on Euronext Paris. The group and its principal credit<br />
insurance subsidiaries are rated AA- by Standard & Poor’s.<br />
www.eulerhermes.com<br />
Contacts<br />
Investor relations / <strong>Euler</strong> <strong>Hermes</strong> Group<br />
Nicolas Hein: +33 (0)1 40 70 54 65<br />
Media relations / <strong>Euler</strong> <strong>Hermes</strong> Group<br />
Raphaële Hamel: +33 (0)1 40 70 81 33<br />
raphaele.hamel@eulerhermes.com<br />
These assessments are, as always, subject to the disclaimer provided below.<br />
Cautionary Note Regarding Forward-Looking Statements: Certain of the statements contained herein may be statements of future expectations<br />
and other forward-looking statements that are based on management's current views and assumptions and involve known and unknown risks<br />
and uncertainties that could cause actual results, performance or events to differ materially from those expressed or implied in such statements.<br />
In addition to statements which are forward-looking by reason of context, the words ‘may, will, should, expects, plans, intends, anticipates,<br />
believes, estimates, predicts, potential, or continue’ and similar expressions identify forward-looking statements. Actual results, performance or<br />
events may differ materially from those in such statements due to, without limitation, (i) general economic conditions, including in particular<br />
economic conditions in the Allianz SE's core business and core markets, (ii) performance of financial markets, including emerging markets, (iii)<br />
the frequency and severity of insured loss events, (iv) mortality and morbidity levels and trends, (v) persistency levels, (vi) the extent of credit<br />
defaults (vii) interest rate levels, (viii) currency exchange rates including the Euro-U.S. Dollar exchange rate, (ix) changing levels of competition,<br />
(x) changes in laws and regulations, including monetary convergence and the European Monetary Union, (xi) changes in the policies of central<br />
banks and/or foreign governments, (xii) the impact of acquisitions, including related integration issues, (xiii) reorganization measures and (xiv)<br />
general competitive factors, in each case on a local, regional, national and/or global basis. Many of these factors may be more likely to occur, or<br />
more pronounced, as a result of terrorist activities and their consequences. The matters discussed herein may also involve risks and<br />
uncertainties described from time to time in Allianz SE’s filings with the U.S. Securities and Exchange Commission. The Group assumes no<br />
obligation to update any forward-looking information contained herein.