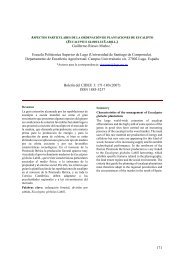
Locating the optic nerve in a retinal image using the fuzzy ...
Locating the optic nerve in a retinal image using the fuzzy ...
Locating the optic nerve in a retinal image using the fuzzy ...

Create successful ePaper yourself
Turn your PDF publications into a flip-book with our unique Google optimized e-Paper software.
IEEE TRANSACTIONS ON MEDICAL IMAGING, VOL. 22, NO. 8, AUGUST 2003 951<br />
<strong>Locat<strong>in</strong>g</strong> <strong>the</strong> Optic Nerve <strong>in</strong> a Ret<strong>in</strong>al Image Us<strong>in</strong>g<br />
<strong>the</strong> Fuzzy Convergence of <strong>the</strong> Blood Vessels<br />
Abstract—We describe an automated method to locate <strong>the</strong> <strong>optic</strong><br />
<strong>nerve</strong> <strong>in</strong> <strong>image</strong>s of <strong>the</strong> ocular fundus. Our method uses a novel algorithm<br />
we call <strong>fuzzy</strong> convergence to determ<strong>in</strong>e <strong>the</strong> orig<strong>in</strong>ation of<br />
<strong>the</strong> blood vessel network. We evaluate our method us<strong>in</strong>g 31 <strong>image</strong>s<br />
of healthy ret<strong>in</strong>as and 50 <strong>image</strong>s of diseased ret<strong>in</strong>as, conta<strong>in</strong><strong>in</strong>g<br />
such diverse symptoms as tortuous vessels, choroidal neovascularization,<br />
and hemorrhages that completely obscure <strong>the</strong> actual <strong>nerve</strong>.<br />
On this difficult data set, our method achieved 89% correct detection.<br />
We also compare our method aga<strong>in</strong>st three simpler methods,<br />
demonstrat<strong>in</strong>g <strong>the</strong> performance improvement. All our <strong>image</strong>s and<br />
data are freely available for o<strong>the</strong>r researchers to use <strong>in</strong> evaluat<strong>in</strong>g<br />
related methods.<br />
Index Terms—Blood vessels, ret<strong>in</strong>al imag<strong>in</strong>g, <strong>optic</strong>al <strong>image</strong> process<strong>in</strong>g,<br />
segmentation.<br />
I. INTRODUCTION<br />
THE <strong>optic</strong> <strong>nerve</strong> is one of <strong>the</strong> most important organs <strong>in</strong> <strong>the</strong><br />
human ret<strong>in</strong>a. The central ret<strong>in</strong>al artery and central ret<strong>in</strong>al<br />
ve<strong>in</strong> emanate through <strong>the</strong> <strong>optic</strong> <strong>nerve</strong>, supply<strong>in</strong>g <strong>the</strong> upper layers<br />
of <strong>the</strong> ret<strong>in</strong>a with blood. The <strong>optic</strong> <strong>nerve</strong> also serves as <strong>the</strong> conduit<br />
for <strong>the</strong> flow of <strong>in</strong>formation from <strong>the</strong> eye to <strong>the</strong> bra<strong>in</strong>. Most<br />
ret<strong>in</strong>al pathology is local <strong>in</strong> its early stages, not affect<strong>in</strong>g <strong>the</strong> entire<br />
ret<strong>in</strong>a, so that vision impairment is more gradual. In contrast,<br />
pathology on or near <strong>the</strong> <strong>nerve</strong> can have a more severe effect <strong>in</strong><br />
early stages, due to <strong>the</strong> necessity of <strong>the</strong> <strong>nerve</strong> for vision [16, p.<br />
719].<br />
The <strong>optic</strong> <strong>nerve</strong> can be exam<strong>in</strong>ed <strong>in</strong> a view<strong>in</strong>g of <strong>the</strong> ret<strong>in</strong>al<br />
fundus. The portion of <strong>the</strong> <strong>nerve</strong> that is visible <strong>in</strong> such a view is<br />
called <strong>the</strong> <strong>optic</strong> disc, referr<strong>in</strong>g to <strong>the</strong> two-dimensional appearance<br />
of <strong>the</strong> part of <strong>the</strong> <strong>nerve</strong> that is visible. Fundus imag<strong>in</strong>g is<br />
a common cl<strong>in</strong>ical procedure used to record a view<strong>in</strong>g of <strong>the</strong><br />
ret<strong>in</strong>a. This <strong>image</strong> may be used for diagnosis, treatment evaluation,<br />
and <strong>the</strong> keep<strong>in</strong>g of patient history. In this paper, we<br />
describe a process to automatically locate <strong>the</strong> <strong>optic</strong> <strong>nerve</strong> <strong>in</strong><br />
a ret<strong>in</strong>al <strong>image</strong>. Such a tool could be used for automated patient<br />
screen<strong>in</strong>g, eye orientation track<strong>in</strong>g, <strong>image</strong> sequence registration,<br />
and automated measurements for treatment evaluation<br />
or diagnosis.<br />
Manuscript received July 16, 2002; revised January 27, 2003. This work was<br />
supported by <strong>the</strong> National Institutes of Health National Eye Institute under Grant<br />
EY13235-11. The Associate Editor responsible for coord<strong>in</strong>at<strong>in</strong>g <strong>the</strong> review of<br />
this paper and recommend<strong>in</strong>g its publication was M. Sonka. Asterisk <strong>in</strong>dicates<br />
correspond<strong>in</strong>g author.<br />
A. Hoover is with <strong>the</strong> Electrical and Computer Eng<strong>in</strong>eer<strong>in</strong>g Department,<br />
Clemson University, Clemson, SC 29634-0915 USA (e-mail:<br />
ahoover@clemson.edu).<br />
M. Goldbaum is with <strong>the</strong> Department of Ophthalmology, University of California<br />
at San Diego, La Jolla, CA 92093 USA (e-mail: mgoldbaum@ucsd.edu).<br />
Digital Object Identifier 10.1109/TMI.2003.815900<br />
Adam Hoover 3 and Michael Goldbaum<br />
0278-0062/03$17.00 © 2003 IEEE<br />
Fig. 1. In a healthy ret<strong>in</strong>a, <strong>the</strong> <strong>optic</strong> <strong>nerve</strong> has a readily identifiable size, shape,<br />
color, and location relative to <strong>the</strong> blood vessels.<br />
Fig. 2. Ret<strong>in</strong>a conta<strong>in</strong><strong>in</strong>g lesions of <strong>the</strong> same brightness as <strong>the</strong> <strong>nerve</strong>.<br />
Fig. 1 shows <strong>the</strong> green plane of an example ret<strong>in</strong>al <strong>image</strong>. The<br />
<strong>optic</strong> <strong>nerve</strong> appears toward <strong>the</strong> left side of this <strong>image</strong> as a circular<br />
area, roughly one-sixth <strong>the</strong> width of <strong>the</strong> <strong>image</strong> <strong>in</strong> diameter,<br />
brighter than <strong>the</strong> surround<strong>in</strong>g area, as <strong>the</strong> convergent area of <strong>the</strong><br />
blood vessel network. In an <strong>image</strong> of a healthy ret<strong>in</strong>a, all <strong>the</strong>se<br />
properties (shape, color, size, convergence) help contribute to<br />
<strong>the</strong> identification of <strong>the</strong> <strong>nerve</strong>.<br />
However, <strong>the</strong>se features show a large variance that makes<br />
simple detection methods brittle, particularly <strong>in</strong> <strong>the</strong> presence<br />
of ret<strong>in</strong>al disease. Fig. 2 shows an <strong>image</strong> of a ret<strong>in</strong>a conta<strong>in</strong><strong>in</strong>g<br />
drusen. The brightness of <strong>the</strong>se lesions overlaps <strong>the</strong> brightness<br />
of <strong>the</strong> <strong>nerve</strong>, so that us<strong>in</strong>g brightness as a lone feature for de-<br />
Authorized licensed use limited to: IEEE Xplore Customer. Downloaded on October 27, 2008 at 06:14 from IEEE Xplore. Restrictions apply.
952 IEEE TRANSACTIONS ON MEDICAL IMAGING, VOL. 22, NO. 8, AUGUST 2003<br />
Fig. 3. Swollen <strong>nerve</strong>, show<strong>in</strong>g a distorted size and shape.<br />
Fig. 4. Bright circular lesion that looks similar to an <strong>optic</strong> <strong>nerve</strong>.<br />
tection is difficult. Fig. 3 shows an example of a swollen <strong>optic</strong><br />
<strong>nerve</strong>, where <strong>the</strong> circular shape and size are distorted. Fig. 4<br />
shows a ret<strong>in</strong>a exhibit<strong>in</strong>g choroidal neovascularization and subret<strong>in</strong>al<br />
fibrosis, with a bright circular lesion that appears similar<br />
to a <strong>nerve</strong>. Fig. 5 shows a ret<strong>in</strong>a exhibit<strong>in</strong>g central artery<br />
and ve<strong>in</strong> occlusion, where <strong>the</strong> <strong>nerve</strong> is completely obscured by<br />
hemorrhag<strong>in</strong>g. These cases demonstrate <strong>the</strong> difficulty <strong>in</strong> <strong>optic</strong><br />
<strong>nerve</strong> detection, and support <strong>the</strong> need for a robust method that<br />
can work <strong>in</strong> <strong>the</strong> presence of a variety of ret<strong>in</strong>al diseases.<br />
In Figs. 1–5, <strong>the</strong> only consistently visible property of <strong>the</strong> <strong>optic</strong><br />
<strong>nerve</strong> is that it is <strong>the</strong> convergent po<strong>in</strong>t of <strong>the</strong> blood vessel network.<br />
Therefore, we base our method of <strong>optic</strong> <strong>nerve</strong> detection<br />
upon f<strong>in</strong>d<strong>in</strong>g <strong>the</strong> convergence of <strong>the</strong> blood vessels. In <strong>the</strong> absence<br />
of a unique and strongly identifiable convergence, our<br />
method uses brightness as a secondary feature for <strong>optic</strong> <strong>nerve</strong><br />
detection. We also compare <strong>the</strong> success of each of <strong>the</strong>se features<br />
used alone.<br />
In previous work, we described a method to compute a b<strong>in</strong>ary<br />
segmentation of blood vessels [10]. The parameters of this<br />
segmenter can be adjusted to produce vessel segmentations at<br />
different scales. Fig. 6 shows an example, where <strong>the</strong> segmentation<br />
of <strong>the</strong> vessels was produced us<strong>in</strong>g two different parameter<br />
Fig. 5. Nerve that is completely obscured by hemorrhag<strong>in</strong>g.<br />
(b)<br />
Fig. 6. B<strong>in</strong>ary segmentation of blood vessels, of <strong>image</strong> <strong>in</strong> Fig. 1. (a) Sparser<br />
scale. (b) Denser scale.<br />
(a)<br />
sets. In this paper, we use multiple vessel segmentations of <strong>the</strong><br />
same <strong>image</strong> <strong>in</strong> order to re<strong>in</strong>force <strong>the</strong> detection of convergent<br />
po<strong>in</strong>ts. The idea is that <strong>the</strong> convergence should be detectable<br />
us<strong>in</strong>g vessel segmentations at different scales.<br />
To f<strong>in</strong>d <strong>the</strong> vessel network convergence, we describe a novel<br />
algorithm we call <strong>fuzzy</strong> convergence. The algorithm is a vot<strong>in</strong>g<br />
type method that works <strong>in</strong> <strong>the</strong> spatial doma<strong>in</strong> of <strong>the</strong> <strong>image</strong>. The<br />
Authorized licensed use limited to: IEEE Xplore Customer. Downloaded on October 27, 2008 at 06:14 from IEEE Xplore. Restrictions apply.
HOOVER AND GOLDBAUM: LOCATING THE OPTIC NERVE IN A RETINAL IMAGE USING THE FUZZY CONVERGENCE OF THE BLOOD VESSELS 953<br />
<strong>in</strong>put to <strong>the</strong> algorithm is a b<strong>in</strong>ary segmentation of <strong>the</strong> blood vessels.<br />
Each vessel is modeled by a <strong>fuzzy</strong> segment, which contributes<br />
to a cumulative vot<strong>in</strong>g <strong>image</strong>. The output from <strong>the</strong> algorithm<br />
is a convergence <strong>image</strong>, which is thresholded to identify<br />
<strong>the</strong> strongest po<strong>in</strong>t(s) of convergence.<br />
We test our method on 31 <strong>image</strong>s of healthy ret<strong>in</strong>as and 50<br />
<strong>image</strong>s of diseased ret<strong>in</strong>as. We report <strong>the</strong> success of our method<br />
to detect <strong>the</strong> <strong>optic</strong> <strong>nerve</strong> us<strong>in</strong>g <strong>fuzzy</strong> convergence alone, and <strong>in</strong><br />
conjunction with us<strong>in</strong>g brightness as a salient feature.<br />
A. Related Work<br />
The problem of <strong>optic</strong> <strong>nerve</strong> detection has rarely received<br />
unique attention. It has been <strong>in</strong>vestigated as a precursor for<br />
o<strong>the</strong>r issues, for example as identify<strong>in</strong>g a start<strong>in</strong>g po<strong>in</strong>t for<br />
blood vessel segmentation [23], [24]. It has also been <strong>in</strong>vestigated<br />
as a byproduct of general ret<strong>in</strong>al <strong>image</strong> segmentation,<br />
for <strong>in</strong>stance <strong>in</strong>to separate identifications of arteries, ve<strong>in</strong>s,<br />
<strong>the</strong> <strong>nerve</strong>, <strong>the</strong> fovea, and lesions [1], [7], [13], [17]. Here, we<br />
review <strong>the</strong>se related works.<br />
In [13], a method is presented to segment a ret<strong>in</strong>al <strong>image</strong> <strong>in</strong>to<br />
arteries, ve<strong>in</strong>s, <strong>the</strong> <strong>optic</strong> disk, <strong>the</strong> macula, and background. The<br />
method is based upon split-and-merge segmentation, followed<br />
by feature based classification. The features used for classification<br />
<strong>in</strong>clude region <strong>in</strong>tensity and shape. The primary goal of <strong>the</strong><br />
paper was vessel measurement; <strong>the</strong> <strong>nerve</strong> was identified only to<br />
prevent its <strong>in</strong>clusion <strong>in</strong> <strong>the</strong> measurement of vessels. Ten healthy<br />
ret<strong>in</strong>as and ten ret<strong>in</strong>as with arterial hypertension were used for<br />
experiments. Quantitative results for <strong>nerve</strong> detection were not<br />
provided. A similar approach was taken <strong>in</strong> [7], <strong>in</strong> which <strong>the</strong><br />
segmentation was accomplished us<strong>in</strong>g matched spatial filters of<br />
bright and dark blobs. Quantitative results for <strong>nerve</strong> detection<br />
were not provided.<br />
In [17], a method is presented to segment a ret<strong>in</strong>al <strong>image</strong><br />
<strong>in</strong>to vessels, <strong>the</strong> <strong>nerve</strong>, <strong>the</strong> fovea, scotomas, and subret<strong>in</strong>al leakages.<br />
Nerve detection is based upon <strong>the</strong> transform of gradient<br />
edges <strong>in</strong>to a Hough space describ<strong>in</strong>g circles. The search is restricted<br />
to one-third of <strong>the</strong> <strong>image</strong> based upon apriori knowledge<br />
of <strong>the</strong> expected general location of <strong>the</strong> <strong>nerve</strong>. Eleven ret<strong>in</strong>as with<br />
age-related macular degeneration (ARMD) were used for experiments.<br />
In 10 out of 11 cases, <strong>the</strong> <strong>nerve</strong> was successfully detected.<br />
In [1], a method is presented to segment a ret<strong>in</strong>al <strong>image</strong><br />
<strong>in</strong>to arteries, ve<strong>in</strong>s, <strong>the</strong> <strong>optic</strong> disk, and lesions. Nerve detection<br />
is based upon track<strong>in</strong>g <strong>the</strong> vessel network to a common start<strong>in</strong>g<br />
po<strong>in</strong>t. The track<strong>in</strong>g process uses <strong>the</strong> angles between vessels at<br />
branch po<strong>in</strong>ts to identify <strong>the</strong> trunk. A result is shown for two<br />
<strong>image</strong>s; quantitative results were not provided.<br />
In [24], a method is described to detect <strong>the</strong> <strong>optic</strong> <strong>nerve</strong> as a<br />
start<strong>in</strong>g po<strong>in</strong>t for track<strong>in</strong>g-based segmentation of blood vessels.<br />
Nerve detection is based upon locat<strong>in</strong>g <strong>the</strong> brightest region <strong>in</strong><br />
a restricted third of <strong>the</strong> <strong>image</strong>. Three ret<strong>in</strong>al <strong>image</strong>s were used<br />
for experiments. Although <strong>the</strong> health of <strong>the</strong>se ret<strong>in</strong>as is not reported,<br />
<strong>the</strong> <strong>nerve</strong>s show readily identifiable properties similar<br />
to <strong>the</strong> <strong>nerve</strong> shown <strong>in</strong> Fig. 1 of this paper. In all three cases, <strong>the</strong><br />
<strong>nerve</strong> was successfully detected. A similar method is described<br />
<strong>in</strong> [20].<br />
In [23], <strong>the</strong> <strong>nerve</strong> was detected us<strong>in</strong>g <strong>the</strong> transform of gradient<br />
edges <strong>in</strong>to a Hough space describ<strong>in</strong>g circles. Quantitative results<br />
were not provided. A similar method is described <strong>in</strong> [2].<br />
Fig. 7. Outl<strong>in</strong>e of our method for <strong>optic</strong> <strong>nerve</strong> detection.<br />
In [14], a method is described to track eye movements based<br />
upon ret<strong>in</strong>al features, <strong>in</strong>clud<strong>in</strong>g <strong>the</strong> <strong>nerve</strong>. Nerve detection is accomplished<br />
us<strong>in</strong>g basic threshold<strong>in</strong>g for bright areas. Quantitative<br />
results were not provided.<br />
In [5], a method is described to detect <strong>the</strong> <strong>optic</strong> <strong>nerve</strong> <strong>in</strong> a<br />
ret<strong>in</strong>al <strong>image</strong>. Nerve detection is based upon three features:<br />
bright circularity, vertical vessel detection, and discrete vessel<br />
convergence. Bright circle detection is accomplished us<strong>in</strong>g<br />
least-median-of-squares fitt<strong>in</strong>g of gradient po<strong>in</strong>ts. Vertical vessels<br />
contribute to b<strong>in</strong>s distributed horizontally across <strong>the</strong> <strong>image</strong>;<br />
<strong>the</strong> idea is that <strong>the</strong> primary four vessels emanate near-vertically<br />
from <strong>the</strong> <strong>nerve</strong> <strong>in</strong> a standard ret<strong>in</strong>al <strong>image</strong>. Discrete vessel<br />
convergence is accomplished us<strong>in</strong>g a method similar to <strong>the</strong><br />
<strong>fuzzy</strong> convergence reported here<strong>in</strong>, except that each vessel<br />
is modeled by a s<strong>in</strong>gle l<strong>in</strong>e <strong>in</strong> a coarse vot<strong>in</strong>g space. In later<br />
test<strong>in</strong>g [3], 133 ret<strong>in</strong>as conta<strong>in</strong><strong>in</strong>g various health disorders<br />
were used for experiments. In 106 cases (80%), <strong>the</strong> <strong>nerve</strong> was<br />
successfully detected.<br />
Our work differs from previous methods <strong>in</strong> that we use blood<br />
vessel convergence as <strong>the</strong> primary feature for detection. We test<br />
our method on 81 <strong>image</strong>s show<strong>in</strong>g a variety of ret<strong>in</strong>al diseases,<br />
confus<strong>in</strong>g lesions and manifestations. On this difficult data set,<br />
our method achieves an 89% correct detection rate.<br />
II. METHODS<br />
Our method for <strong>optic</strong> <strong>nerve</strong> detection is outl<strong>in</strong>ed <strong>in</strong> Fig. 7.<br />
It is based primarily upon a novel algorithm we call <strong>fuzzy</strong><br />
convergence. This algorithm identifies <strong>the</strong> <strong>optic</strong> <strong>nerve</strong> as <strong>the</strong><br />
focal po<strong>in</strong>t of <strong>the</strong> blood vessel network. In <strong>the</strong> absence of a<br />
strong convergence, our method identifies <strong>the</strong> <strong>optic</strong> <strong>nerve</strong> as<br />
<strong>the</strong> brightest region <strong>in</strong> <strong>the</strong> <strong>image</strong> after illum<strong>in</strong>ation equalization.<br />
Section II-A describes <strong>fuzzy</strong> convergence, Section II-B<br />
describes illum<strong>in</strong>ation equalization, and Section II-C describes<br />
our hypo<strong>the</strong>sis generation and consensus.<br />
A. Fuzzy Convergence<br />
The blood vessel segments may be modeled by l<strong>in</strong>e segments.<br />
The problem of f<strong>in</strong>d<strong>in</strong>g <strong>the</strong> convergence of <strong>the</strong> vessel network<br />
may <strong>the</strong>n be modeled as a l<strong>in</strong>e <strong>in</strong>tersection problem. Our approach<br />
differs from traditional methods <strong>in</strong> that we model each<br />
vessel with a l<strong>in</strong>e segment (of f<strong>in</strong>ite length), as opposed to a l<strong>in</strong>e<br />
Authorized licensed use limited to: IEEE Xplore Customer. Downloaded on October 27, 2008 at 06:14 from IEEE Xplore. Restrictions apply.
954 IEEE TRANSACTIONS ON MEDICAL IMAGING, VOL. 22, NO. 8, AUGUST 2003<br />
(of <strong>in</strong>f<strong>in</strong>ite length). Before describ<strong>in</strong>g our approach we review<br />
<strong>the</strong> least squares and Hough space families of solutions, which<br />
are <strong>the</strong> two most traditional approaches to l<strong>in</strong>e <strong>in</strong>tersection.<br />
Least squares solutions (see [18]) and related approaches<br />
work by m<strong>in</strong>imiz<strong>in</strong>g <strong>the</strong> mean square (or some o<strong>the</strong>r function)<br />
of errors between a set of equations and a s<strong>in</strong>gle solution. In<br />
physical terms, a least squares solution to <strong>the</strong> <strong>in</strong>tersection of<br />
a set of l<strong>in</strong>es f<strong>in</strong>ds <strong>the</strong> po<strong>in</strong>t simultaneously m<strong>in</strong>imally distant<br />
from all <strong>the</strong> l<strong>in</strong>es. An assumption common to <strong>the</strong>se methods<br />
is that <strong>the</strong> data set be<strong>in</strong>g fitted is uniformly distributed around<br />
<strong>the</strong> optimal s<strong>in</strong>gle solution. Subsets of data that do not meet<br />
this criterion are termed outliers, and cause wrong solutions.<br />
Several m<strong>in</strong>imization-based solutions that overcome various<br />
types and amounts of outlier data have been proposed (see<br />
[15]). Generally speak<strong>in</strong>g, <strong>the</strong>se methods work by partition<strong>in</strong>g<br />
<strong>the</strong> data set <strong>in</strong>to <strong>in</strong>liers and outliers, so <strong>the</strong>y are computationally<br />
expensive, and require 50% <strong>in</strong>liers.<br />
Hough space methods (see [12]) and related approaches<br />
work by transform<strong>in</strong>g data po<strong>in</strong>ts from an <strong>image</strong> space to a<br />
quantized parameter space. Each data po<strong>in</strong>t <strong>in</strong> effect votes for<br />
a f<strong>in</strong>ite number of parameter sets. The parameter set with <strong>the</strong><br />
highest total vote is taken for <strong>the</strong> solution. In physical terms,<br />
a Hough transform solution to <strong>the</strong> <strong>in</strong>tersection of a set of<br />
l<strong>in</strong>es f<strong>in</strong>ds <strong>the</strong> b<strong>in</strong> (po<strong>in</strong>t at <strong>the</strong> resolution of <strong>the</strong> Hough space)<br />
through which <strong>the</strong> largest number of l<strong>in</strong>es passes. Generally<br />
speak<strong>in</strong>g, <strong>the</strong>se methods model l<strong>in</strong>e-like shapes with l<strong>in</strong>es (i.e.,<br />
of <strong>in</strong>f<strong>in</strong>ite length), so any sense of convergence contributed<br />
by <strong>the</strong> endpo<strong>in</strong>ts of <strong>the</strong> l<strong>in</strong>e-like shapes is lost. Simple Hough<br />
spaces also tend to be very sensitive to <strong>the</strong> chosen resolution.<br />
Fuzzy convergence [9] is a vot<strong>in</strong>g-based method. The vot<strong>in</strong>g<br />
takes place on <strong>the</strong> <strong>in</strong>teger grid of <strong>the</strong> orig<strong>in</strong>al <strong>image</strong>. Each<br />
l<strong>in</strong>e-like shape is modeled by a <strong>fuzzy</strong> segment, whose area<br />
contributes votes to its constituent pixels. The summation of<br />
votes at each pixel produces an <strong>image</strong> map where each pixel<br />
conta<strong>in</strong>s a value proportionate to its strength of convergence.<br />
The map is <strong>the</strong>n blurred (to reduce <strong>the</strong> effects of quantization)<br />
and thresholded to produce one (or more, if desired) po<strong>in</strong>ts<br />
of strongest convergence. The proposed method runs <strong>in</strong> O(n)<br />
time, where n is <strong>the</strong> number of l<strong>in</strong>e-like shapes. It does not<br />
require any amount of <strong>in</strong>liers; <strong>in</strong>stead, an absolute threshold<br />
for strength may be applied to determ<strong>in</strong>e if any area should be<br />
deemed convergent.<br />
1) Fuzzy Segment Model: A l<strong>in</strong>e segment is def<strong>in</strong>ed by its<br />
two endpo<strong>in</strong>ts and . In this section, a <strong>fuzzy</strong><br />
segment model is proposed. The <strong>fuzzy</strong> segment, henceforward<br />
denoted as , is def<strong>in</strong>ed by a set of parametric l<strong>in</strong>e segments<br />
where<br />
(1)<br />
(2)<br />
Fig. 8. Fuzzy segment model.<br />
The amount of “fuzz<strong>in</strong>ess” is controlled by <strong>the</strong> parameter ,<br />
which, at zero, reduces <strong>the</strong> <strong>fuzzy</strong> segment to <strong>the</strong> s<strong>in</strong>gle l<strong>in</strong>e segment<br />
from to . The parameter corresponds<br />
to <strong>the</strong> orientation of that s<strong>in</strong>gle segment, and is computed as<br />
The <strong>fuzzy</strong> segment def<strong>in</strong>es a set of segments of orientations<br />
and lengths rang<strong>in</strong>g about a l<strong>in</strong>e segment. The motivation for <strong>the</strong><br />
<strong>fuzzy</strong> segment is best demonstrated through its visualization.<br />
Fig. 8 illustrates <strong>the</strong> enumeration for <strong>the</strong> subset of where<br />
. It may be visualized as a mov<strong>in</strong>g l<strong>in</strong>e segment, whose <strong>in</strong>itial<br />
endpo<strong>in</strong>ts are marked <strong>in</strong> Fig. 8 at . As <strong>the</strong>ta moves from<br />
zero to , <strong>the</strong> endpo<strong>in</strong>ts trace <strong>the</strong> boundaries of circles, one <strong>in</strong><br />
<strong>the</strong> clockwise direction, <strong>the</strong> o<strong>the</strong>r counterclockwise. By start<strong>in</strong>g<br />
at , <strong>the</strong> shape of <strong>the</strong> <strong>fuzzy</strong> segment rema<strong>in</strong>s <strong>in</strong>variant to<br />
orientation.<br />
Relevant previous work <strong>in</strong> <strong>fuzzy</strong> geometry (see [4], [8], and<br />
[19]) deals ma<strong>in</strong>ly with <strong>fuzzy</strong> l<strong>in</strong>e models. The <strong>fuzzy</strong> segment<br />
is proposed as a model for <strong>the</strong> area <strong>in</strong> which an observed<br />
l<strong>in</strong>e-like shape contributes to a sense of convergence. The model<br />
proposes that <strong>the</strong> contribution of <strong>the</strong> midpo<strong>in</strong>t of <strong>the</strong> l<strong>in</strong>e-like<br />
shape is more compact than <strong>the</strong> endpo<strong>in</strong>ts. The width of <strong>the</strong><br />
<strong>fuzzy</strong> segment at its midpo<strong>in</strong>t is<br />
while <strong>the</strong> width at its endpo<strong>in</strong>ts is . The model also proposes<br />
that a l<strong>in</strong>e-like shape generally only contributes to a convergence<br />
<strong>in</strong> its “near” neighborhood. The term “near” is subjectively applicable<br />
and implies <strong>the</strong> area with<strong>in</strong> some perceptually relevant<br />
distance surround<strong>in</strong>g <strong>the</strong> l<strong>in</strong>e-like shape. The model allows for<br />
an <strong>in</strong>terpretation of what is near via <strong>the</strong> parameter .<br />
2) Convergence Image: Given a b<strong>in</strong>ary <strong>in</strong>put <strong>image</strong>, like <strong>the</strong><br />
one depicted <strong>in</strong> Fig. 6, a process for f<strong>in</strong>d<strong>in</strong>g convergences works<br />
as follows.<br />
1) Th<strong>in</strong> <strong>the</strong> <strong>image</strong> (for <strong>in</strong>stance, us<strong>in</strong>g <strong>the</strong> algorithm given <strong>in</strong><br />
[12, p. 59]).<br />
Authorized licensed use limited to: IEEE Xplore Customer. Downloaded on October 27, 2008 at 06:14 from IEEE Xplore. Restrictions apply.<br />
(3)<br />
(4)
HOOVER AND GOLDBAUM: LOCATING THE OPTIC NERVE IN A RETINAL IMAGE USING THE FUZZY CONVERGENCE OF THE BLOOD VESSELS 955<br />
2) Erase (relabel as background) all branchpo<strong>in</strong>ts, break<strong>in</strong>g<br />
up <strong>the</strong> entire foreground <strong>in</strong>to segments that conta<strong>in</strong> two<br />
endpo<strong>in</strong>ts each. In a th<strong>in</strong>ned <strong>image</strong>, endpo<strong>in</strong>ts may be<br />
discovered as any pixel for which a traverse of <strong>the</strong> eight<br />
border<strong>in</strong>g pixels <strong>in</strong> clockwise order yields only one foreground-to-background<br />
transition. Similarly, branchpo<strong>in</strong>ts<br />
may be discovered as any pixel for which <strong>the</strong> same traverse<br />
yields more than two transitions.<br />
3) Extend each segment a distance of R pixels <strong>in</strong> both directions.<br />
The extension is done along <strong>the</strong> vector made by<br />
<strong>the</strong> segment’s endpo<strong>in</strong>ts. For our experiments, we used<br />
(<strong>the</strong> average distance between vessels <strong>in</strong> <strong>the</strong><br />
<strong>nerve</strong> <strong>in</strong> our data set).<br />
4) Model each segment, via its two extended endpo<strong>in</strong>ts,<br />
with a <strong>fuzzy</strong> segment . The <strong>image</strong> area covered by<br />
may be found by enumerat<strong>in</strong>g at with<br />
suitable discretizations of and . For <strong>the</strong> experiments<br />
reported here<strong>in</strong>, was enumerated to produce unique<br />
pixel coord<strong>in</strong>ates for endpo<strong>in</strong>ts. For each , was also<br />
enumerated to produce unique pixel coord<strong>in</strong>ates. S<strong>in</strong>ce<br />
<strong>the</strong> l<strong>in</strong>e segments at different ’s overlap, a second b<strong>in</strong>ary<br />
<strong>image</strong> is used to keep track of which pixels are found to<br />
lie <strong>in</strong> . This <strong>image</strong> is cleared after each <strong>fuzzy</strong> segment<br />
enumeration and vot<strong>in</strong>g is completed.<br />
5) For each pixel enumerated <strong>in</strong> , a vote is cast. The<br />
<strong>image</strong> used to tally <strong>the</strong>se votes is termed <strong>the</strong> convergence<br />
<strong>image</strong>. Several vot<strong>in</strong>g functions were explored, <strong>in</strong>clud<strong>in</strong>g<br />
weight<strong>in</strong>g by segment size, and weight<strong>in</strong>g by distance<br />
from midpo<strong>in</strong>t. Interest<strong>in</strong>gly, no function seemed to work<br />
better, overall, than <strong>the</strong> simplest: equal vot<strong>in</strong>g for<br />
all pixels <strong>in</strong> each .<br />
6) Smooth <strong>the</strong> convergence <strong>image</strong> to identify <strong>the</strong> center of<br />
<strong>the</strong> peak of convergences. Fig. 9 shows <strong>the</strong> smoo<strong>the</strong>d convergence<br />
<strong>image</strong>s for <strong>the</strong> vessel segmentations shown <strong>in</strong><br />
Fig. 6 superimposed on <strong>the</strong> th<strong>in</strong>ned segments. The measures<br />
of convergence have been normalized so that <strong>the</strong><br />
highest vote appears darkest. For our experiments, we<br />
used an 11 11 mean filter for smooth<strong>in</strong>g.<br />
B. Illum<strong>in</strong>ation Equalization<br />
The illum<strong>in</strong>ation <strong>in</strong> a ret<strong>in</strong>al <strong>image</strong> is uneven [11]. The<br />
imbalance is primarily due to an <strong>optic</strong>al aberration called vignett<strong>in</strong>g<br />
(see, for example, [21, p. 490]). Vignett<strong>in</strong>g is <strong>the</strong> result<br />
of an improper focus<strong>in</strong>g of light through an <strong>optic</strong>al system. The<br />
result is that <strong>the</strong> brightness of <strong>the</strong> <strong>image</strong> generally decreases<br />
radially outward from near <strong>the</strong> center of <strong>the</strong> <strong>image</strong>. Fig. 10(a)<br />
shows a ret<strong>in</strong>al <strong>image</strong> demonstrat<strong>in</strong>g uneven illum<strong>in</strong>ation.<br />
Fig. 10(b) shows <strong>the</strong> local average <strong>in</strong>tensity, displayed us<strong>in</strong>g<br />
random shades of grey to show iso-<strong>in</strong>tensity contours.<br />
In our case, <strong>the</strong> imbalance is complicated by <strong>the</strong> <strong>optic</strong>s of <strong>the</strong><br />
system used to capture <strong>the</strong> <strong>image</strong>. A ret<strong>in</strong>al <strong>image</strong> is captured by<br />
view<strong>in</strong>g <strong>the</strong> <strong>in</strong>ner rear surface of <strong>the</strong> eyeball through <strong>the</strong> pupil.<br />
The lens of <strong>the</strong> camera works <strong>in</strong> conjunction with <strong>the</strong> lens of <strong>the</strong><br />
eyeball to form <strong>the</strong> <strong>image</strong>. S<strong>in</strong>ce <strong>the</strong> position of <strong>the</strong> eye relative<br />
to <strong>the</strong> camera varies from <strong>image</strong> to <strong>image</strong>, <strong>the</strong> exact properties<br />
of <strong>the</strong> vignett<strong>in</strong>g also vary from <strong>image</strong> to <strong>image</strong>.<br />
(b)<br />
Fig. 9. Fuzzy convergence of blood vessels shown <strong>in</strong> Fig. 6. (a) Sparser scale<br />
(two out of six). (b) Denser scale (five out of six).<br />
(a)<br />
The uneven illum<strong>in</strong>ation h<strong>in</strong>ders absolute <strong>in</strong>terpretation of <strong>the</strong><br />
<strong>in</strong>tensities <strong>in</strong> <strong>the</strong> <strong>image</strong>. In a healthy ret<strong>in</strong>a, <strong>the</strong> <strong>optic</strong> <strong>nerve</strong> is<br />
usually <strong>the</strong> brightest feature. Apply<strong>in</strong>g a simple high threshold<br />
to an <strong>image</strong> of a healthy ret<strong>in</strong>a should yield pixels <strong>in</strong>side <strong>the</strong><br />
<strong>optic</strong> <strong>nerve</strong>. However, a ret<strong>in</strong>al <strong>image</strong> is often captured so that<br />
<strong>the</strong> fovea appears mid-<strong>image</strong>, with <strong>the</strong> <strong>nerve</strong> to one side. Because<br />
of <strong>the</strong> vignett<strong>in</strong>g, <strong>the</strong> <strong>nerve</strong> may appear darker than areas<br />
central to <strong>the</strong> <strong>image</strong> (as <strong>in</strong> Fig. 10).<br />
In order to undo <strong>the</strong> vignett<strong>in</strong>g, we apply an illum<strong>in</strong>ation<br />
equalization to <strong>the</strong> <strong>image</strong>. Each pixel <strong>in</strong> <strong>the</strong> <strong>image</strong> is adjusted<br />
as follows:<br />
where is <strong>the</strong> desired average <strong>in</strong>tensity (128 <strong>in</strong> an 8-bit<br />
greyscale <strong>image</strong>) and is <strong>the</strong> local average <strong>in</strong>tensity. The<br />
local average <strong>in</strong>tensity is computed <strong>in</strong>dependently for each<br />
pixel as <strong>the</strong> average <strong>in</strong>tensity of <strong>the</strong> pixels with<strong>in</strong> an N N<br />
w<strong>in</strong>dow. The w<strong>in</strong>dow size N is variable, so that averages near<br />
<strong>the</strong> border of <strong>the</strong> <strong>image</strong> use <strong>the</strong> same number of pixels (between<br />
30 and 50 <strong>in</strong> our experiments) as averages <strong>in</strong> <strong>the</strong> center of <strong>the</strong><br />
<strong>image</strong>. The local average <strong>in</strong>tensities are also smoo<strong>the</strong>d us<strong>in</strong>g<br />
Authorized licensed use limited to: IEEE Xplore Customer. Downloaded on October 27, 2008 at 06:14 from IEEE Xplore. Restrictions apply.<br />
(5)
956 IEEE TRANSACTIONS ON MEDICAL IMAGING, VOL. 22, NO. 8, AUGUST 2003<br />
(b)<br />
Fig. 10. Illum<strong>in</strong>ation across <strong>the</strong> <strong>image</strong> is uneven, due to <strong>the</strong> imag<strong>in</strong>g process.<br />
(a) Raw <strong>image</strong>. (b) Average local <strong>in</strong>tensity (iso-contours).<br />
Fig. 11. Result of illum<strong>in</strong>ation equalization on <strong>the</strong> <strong>image</strong> <strong>in</strong> Fig. 10.<br />
(a)<br />
<strong>the</strong> same w<strong>in</strong>dow<strong>in</strong>g, to prevent blurr<strong>in</strong>g <strong>the</strong> <strong>image</strong> features.<br />
This process can be implemented us<strong>in</strong>g a slid<strong>in</strong>g w<strong>in</strong>dow<br />
algorithm (see for <strong>in</strong>stance [21, p.75]), so that <strong>the</strong> computations<br />
are fast. Fig. 11 shows <strong>the</strong> result of illum<strong>in</strong>ation equalization<br />
upon <strong>the</strong> <strong>image</strong> <strong>in</strong> Fig. 10.<br />
C. Hypo<strong>the</strong>sis Generation<br />
Both <strong>the</strong> <strong>fuzzy</strong> convergence and illum<strong>in</strong>ation equalization algorithms<br />
produce <strong>image</strong>s <strong>in</strong> which <strong>the</strong> brightness of a pixel is<br />
<strong>in</strong>dicative of <strong>the</strong> presence of <strong>the</strong> <strong>optic</strong> <strong>nerve</strong>. In order to generate<br />
a hypo<strong>the</strong>sis of <strong>nerve</strong> location, ei<strong>the</strong>r <strong>image</strong> is thresholded<br />
to identify <strong>the</strong> brightest 1500 pixels (or darkest 1500 pixels as<br />
depicted <strong>in</strong> Fig. 9). The quantity 1500 was chosen based upon<br />
<strong>the</strong> observation that this is <strong>the</strong> average number of pixels that<br />
“stand out” <strong>in</strong> an <strong>optic</strong> <strong>nerve</strong> <strong>in</strong> our <strong>image</strong>s (our imag<strong>in</strong>g resolution<br />
is 605 700 pixels on a 35 field-of-view). These pixels<br />
are grouped <strong>in</strong>to regions us<strong>in</strong>g standard 8-connected component<br />
analysis. Any regions with<strong>in</strong> five pixels of each o<strong>the</strong>r are<br />
grouped us<strong>in</strong>g standard morphological operators. This last step<br />
groups areas that may be separated by blood vessels, as commonly<br />
occurs <strong>in</strong> <strong>the</strong> <strong>nerve</strong>.<br />
The regions are sorted and separated <strong>in</strong>to two classes, accord<strong>in</strong>g<br />
to region size, us<strong>in</strong>g Fisher’s l<strong>in</strong>ear discrim<strong>in</strong>ant (see<br />
for <strong>in</strong>stance [6, p.114]). This statistical test f<strong>in</strong>ds <strong>the</strong> best separation<br />
of <strong>the</strong> regions <strong>in</strong>to those that are “large” and those that<br />
are “small” or <strong>in</strong>significant. It works as follows. The regions are<br />
sorted by size, and repeatedly partitioned <strong>in</strong>to two sets, and .<br />
The <strong>in</strong>itial partition has only <strong>the</strong> largest element (region size) <strong>in</strong><br />
set , and all o<strong>the</strong>r elements <strong>in</strong> set . Each partition<strong>in</strong>g moves<br />
<strong>the</strong> largest rema<strong>in</strong><strong>in</strong>g element from set <strong>in</strong>to set , until <strong>the</strong>re<br />
is only one element left <strong>in</strong> set . Thus, for total elements (regions)<br />
<strong>the</strong>re will be total partitions.<br />
For each partition , <strong>the</strong> discrim<strong>in</strong>ant statistic is computed<br />
as<br />
where and are <strong>the</strong> mean and standard deviation of each<br />
set. The largest value of <strong>in</strong>dicates <strong>the</strong> best partition. If only<br />
one region passes this test (resides <strong>in</strong> set for <strong>the</strong> largest value<br />
of ), its centroid is deemed a hypo<strong>the</strong>sis of <strong>the</strong> <strong>optic</strong> <strong>nerve</strong><br />
location. If more than one region passes this test, <strong>the</strong>n <strong>the</strong> result<br />
is deemed <strong>in</strong>conclusive, and no hypo<strong>the</strong>sis is generated.<br />
III. RESULTS<br />
We test our methods on 31 <strong>image</strong>s of healthy ret<strong>in</strong>as and<br />
50 <strong>image</strong>s of ret<strong>in</strong>as with disease (all <strong>the</strong> <strong>image</strong>s shown <strong>in</strong><br />
this paper are <strong>in</strong>cluded <strong>in</strong> our test set). All <strong>the</strong>se <strong>image</strong>s<br />
were acquired us<strong>in</strong>g a TopCon TRV-50 fundus camera at 35<br />
field-of-view, and subsequently digitized at 605 700 pixels<br />
<strong>in</strong> resolution, 24 bits per pixel (standard RGB). In this paper,<br />
only <strong>the</strong> green band of <strong>the</strong> <strong>image</strong> was used (<strong>the</strong> red band of a<br />
ret<strong>in</strong>al <strong>image</strong> tends to be saturated, and <strong>the</strong> blue band tends to<br />
be empty). The <strong>nerve</strong> is visible <strong>in</strong> all 81 <strong>image</strong>s, although <strong>in</strong> 14<br />
<strong>image</strong>s it is on <strong>the</strong> border of <strong>the</strong> <strong>image</strong> so that only a fraction<br />
of <strong>the</strong> <strong>nerve</strong> is visible, and <strong>in</strong> five of <strong>the</strong> <strong>image</strong>s <strong>the</strong> <strong>nerve</strong> is<br />
completely obscured by hemorrhag<strong>in</strong>g. All our <strong>image</strong>s and<br />
results may be viewed at [22].<br />
We tested our methods <strong>in</strong> four variations.<br />
1) Equalized brightness—This variation uses illum<strong>in</strong>ation<br />
equalization followed by hypo<strong>the</strong>sis generation.<br />
2) Fuzzy convergence, s<strong>in</strong>gle scale—This variation applies<br />
<strong>fuzzy</strong> convergence to a s<strong>in</strong>gle blood vessel segmentation<br />
(<strong>the</strong> same scale is used for all <strong>image</strong>s), followed by hypo<strong>the</strong>sis<br />
generation.<br />
Authorized licensed use limited to: IEEE Xplore Customer. Downloaded on October 27, 2008 at 06:14 from IEEE Xplore. Restrictions apply.<br />
(6)
HOOVER AND GOLDBAUM: LOCATING THE OPTIC NERVE IN A RETINAL IMAGE USING THE FUZZY CONVERGENCE OF THE BLOOD VESSELS 957<br />
Fig. 12. Result on each <strong>image</strong> shown <strong>in</strong> this paper.<br />
3) Fuzzy convergence, multiple scales—This variation applies<br />
<strong>fuzzy</strong> convergence to six segmentations of <strong>the</strong> blood<br />
vessels, each at a different scale (see Fig. 6). The scales<br />
correspond to <strong>the</strong> first six of <strong>the</strong> ten parameter values<br />
given <strong>in</strong> [10]. The distances between <strong>the</strong> hypo<strong>the</strong>ses generated<br />
for each scale are measured relative to <strong>the</strong> radius of<br />
<strong>the</strong> average <strong>optic</strong> <strong>nerve</strong> (60 pixels <strong>in</strong> our <strong>image</strong>s). If more<br />
than half of <strong>the</strong> hypo<strong>the</strong>ses (three or more out of six) are<br />
all with<strong>in</strong> this distance, <strong>the</strong> centroid of <strong>the</strong>se locations is<br />
hypo<strong>the</strong>sized as <strong>the</strong> <strong>optic</strong> <strong>nerve</strong> location. If <strong>the</strong>re is no<br />
such consensus, <strong>the</strong>n <strong>the</strong> result for <strong>the</strong> <strong>image</strong> is deemed<br />
<strong>in</strong>conclusive, and no hypo<strong>the</strong>sis is generated.<br />
4) Fuzzy convergence and equalized brightness—Variations<br />
numbers 1) and 3) are comb<strong>in</strong>ed. If <strong>the</strong> result from <strong>fuzzy</strong><br />
convergence at multiple scales is deemed <strong>in</strong>conclusive,<br />
<strong>the</strong>n <strong>the</strong> result from equalized brightness is used.<br />
The center po<strong>in</strong>t of <strong>the</strong> <strong>nerve</strong> <strong>in</strong> each <strong>image</strong> was recorded<br />
manually, for ground truth. A <strong>nerve</strong> is considered successfully<br />
detected if <strong>the</strong> hypo<strong>the</strong>sis generated by <strong>the</strong> automated method<br />
is with<strong>in</strong> <strong>the</strong> <strong>optic</strong> <strong>nerve</strong>, measured as with<strong>in</strong> 60 pixels of <strong>the</strong><br />
ground truth location. The <strong>nerve</strong> detection is considered unsuccessful<br />
if ei<strong>the</strong>r <strong>the</strong> hypo<strong>the</strong>sized location is wrong, or if<br />
our method did not produce a hypo<strong>the</strong>sis (see “<strong>in</strong>conclusive,”<br />
above). Fig. 12 shows <strong>the</strong> results for all <strong>the</strong> <strong>image</strong>s shown <strong>in</strong><br />
this paper, all of which are considered successes. Table I tabulates<br />
<strong>the</strong> success rates of <strong>the</strong> methods on all 81 <strong>image</strong>s.<br />
The results for <strong>the</strong> equalized brightness method demonstrate<br />
<strong>the</strong> limit on <strong>the</strong> usefulness of brightness as a lone feature for<br />
<strong>nerve</strong> detection (62%). They also demonstrate that <strong>the</strong> brightness<br />
of <strong>the</strong> <strong>nerve</strong> is more easily confused <strong>in</strong> diseased ret<strong>in</strong>as<br />
than <strong>in</strong> healthy ret<strong>in</strong>as (52% versus 77%).<br />
The results for <strong>fuzzy</strong> convergence at a s<strong>in</strong>gle scale show that<br />
<strong>the</strong> convergence of <strong>the</strong> vessel network is a more stable feature<br />
of <strong>the</strong> <strong>nerve</strong> than <strong>the</strong> brightness (74% versus 62%). They also<br />
TABLE I<br />
RESULTS OF OUR METHODS ON 31 HEALTHY RETINAS AND 50<br />
DISEASED RETINAS<br />
demonstrate that <strong>the</strong> visibility of <strong>the</strong> convergence is apparently<br />
<strong>in</strong>dependent of <strong>the</strong> health of <strong>the</strong> ret<strong>in</strong>a (74% versus 74%).<br />
The results for <strong>fuzzy</strong> convergence at multiple scales shows<br />
that <strong>the</strong> persistence of this feature at multiple scales of vessels<br />
improves <strong>the</strong> detection of <strong>the</strong> <strong>nerve</strong> (79% versus 74%).<br />
F<strong>in</strong>ally, <strong>the</strong> results for <strong>fuzzy</strong> convergence at multiple scales<br />
<strong>in</strong> comb<strong>in</strong>ation with equalized brightness shows <strong>the</strong> highest performance<br />
overall (89%), and complete success on all our healthy<br />
ret<strong>in</strong>a test cases (100%).<br />
In <strong>the</strong> cases where our method failed, <strong>the</strong> cause was usually<br />
a convergence of blood vessels around a bright lesion. In <strong>the</strong>se<br />
cases, an additional operator that searched for circularity and<br />
appropriate size of <strong>the</strong> bright region (hypo<strong>the</strong>sized <strong>nerve</strong> location)<br />
may improve performance.<br />
IV. CONCLUSION<br />
We have presented novel methods to automatically locate <strong>the</strong><br />
<strong>optic</strong> <strong>nerve</strong> <strong>in</strong> a ret<strong>in</strong>al <strong>image</strong>. Our methods use <strong>the</strong> convergence<br />
of <strong>the</strong> blood vessel network as <strong>the</strong> primary feature for detection,<br />
<strong>in</strong> conjunction with <strong>the</strong> brightness of <strong>the</strong> <strong>nerve</strong> as a secondary<br />
Authorized licensed use limited to: IEEE Xplore Customer. Downloaded on October 27, 2008 at 06:14 from IEEE Xplore. Restrictions apply.
958 IEEE TRANSACTIONS ON MEDICAL IMAGING, VOL. 22, NO. 8, AUGUST 2003<br />
feature. We have tested our methods on 31 <strong>image</strong>s of healthy<br />
ret<strong>in</strong>as and 50 <strong>image</strong>s of diseased ret<strong>in</strong>as, exhibit<strong>in</strong>g a wide variety<br />
of lesions and confus<strong>in</strong>g manifestations. On this difficult<br />
data set, our methods successfully detect <strong>the</strong> <strong>nerve</strong> <strong>in</strong> 89% of<br />
<strong>the</strong> cases, and <strong>in</strong> 100% of <strong>the</strong> healthy cases. We believe this improves<br />
upon all previously published methods, although few of<br />
<strong>the</strong>se previous works reports quantitative results aga<strong>in</strong>st which<br />
we can compare. All of our <strong>image</strong>s and results are freely available<br />
[22] for o<strong>the</strong>r researchers <strong>in</strong>terested <strong>in</strong> related work.<br />
Our method for f<strong>in</strong>d<strong>in</strong>g <strong>the</strong> convergence of <strong>the</strong> blood vessel<br />
network is based upon a novel algorithm we call <strong>fuzzy</strong> convergence.<br />
Unlike least-squares and Hough-space-based solutions,<br />
<strong>fuzzy</strong> convergence uses <strong>the</strong> endpo<strong>in</strong>ts of <strong>the</strong> l<strong>in</strong>ear shapes (<strong>in</strong><br />
our case blood vessel segments) to help f<strong>in</strong>d <strong>the</strong> solution. Identify<strong>in</strong>g<br />
<strong>the</strong> <strong>in</strong>tersection of a number of l<strong>in</strong>es (a convergence) is a<br />
fundamental geometric problem, with applications rang<strong>in</strong>g from<br />
astronomy to eng<strong>in</strong>eer<strong>in</strong>g, such as model fitt<strong>in</strong>g and prediction.<br />
We also believe that <strong>fuzzy</strong> convergence may f<strong>in</strong>d usefulness <strong>in</strong><br />
o<strong>the</strong>r medical applications besides <strong>optic</strong> <strong>nerve</strong> detection. We <strong>in</strong>tend<br />
to explore <strong>the</strong>se issues <strong>in</strong> future work.<br />
REFERENCES<br />
[1] K. Akita and H. Kuga, “A computer method of understand<strong>in</strong>g ocular<br />
fundus <strong>image</strong>s,” Pattern Recognit., vol. 15, no. 6, pp. 431–443, 1982.<br />
[2] S. Barrett, E. Naess, and T. Molvik, “Employ<strong>in</strong>g <strong>the</strong> hough transform to<br />
locate <strong>the</strong> <strong>optic</strong> disk,” Biomed. Sci. Instrum., vol. 37, pp. 81–86, 2001.<br />
[3] J. Boyd, “STARE software documentation: Disk—Optic disk locator,”<br />
Vis. Comput. Lab., Dept. Elect. Comput. Eng., Univ. California, San<br />
Diego, CA, Sept. 1996. Tech. Rep..<br />
[4] B. B. Chaudhuri, “Some shape def<strong>in</strong>itions <strong>in</strong> <strong>fuzzy</strong> geometry of space,”<br />
Pattern Recognit. Lett., vol. 12, pp. 531–535, Sept. 1991.<br />
[5] S. Chaudhuri, S. Chatterjee, N. Katz, M. Nelson, and M. Goldbaum,<br />
“Automatic detection of <strong>the</strong> <strong>optic</strong> <strong>nerve</strong> <strong>in</strong> ret<strong>in</strong>al <strong>image</strong>s,” <strong>in</strong> Proc. IEEE<br />
Int. Conf. Image Process<strong>in</strong>g, 1989, pp. 1–5.<br />
[6] R. Duda and P. Hart, Pattern Classification and Scene Analysis. New<br />
York: Wiley, 1973.<br />
[7] M. Goldbaum, S. Moezzi, A. Taylor, S. Chatterjee, J. Boyd, E. Hunter,<br />
and R. Ja<strong>in</strong>, “Automated diagnosis and <strong>image</strong> understand<strong>in</strong>g with object<br />
extraction, object classification, and <strong>in</strong>ferenc<strong>in</strong>g <strong>in</strong> ret<strong>in</strong>al <strong>image</strong>s,” <strong>in</strong><br />
Proc. IEEE Int. Conf. Image Process<strong>in</strong>g, 1996, pp. 695–698.<br />
[8] K. Gupta and S. Ray, “Fuzzy plane projective geometry,” Fuzzy Sets<br />
Syst., vol. 54, pp. 191–206, 1993.<br />
[9] A. Hoover and M. Goldbaum, “Fuzzy convergence,” <strong>in</strong> Proc. IEEE Conf.<br />
Computer Vision and Pattern Recognition, 1998, pp. 716–721.<br />
[10] A. Hoover, V. Kouznetsova, and M. Goldbaum, “<strong>Locat<strong>in</strong>g</strong> blood vessels<br />
<strong>in</strong> ret<strong>in</strong>al <strong>image</strong>s by piecewise threshold prob<strong>in</strong>g of a matched filter response,”<br />
IEEE Trans. Med. Imag., vol. 19, pp. 203–210, Mar. 2000.<br />
[11] A. Hoover and M. Goldbaum, “Illum<strong>in</strong>ation equalization of a ret<strong>in</strong>al<br />
<strong>image</strong> us<strong>in</strong>g <strong>the</strong> blood vessels as a reference,” <strong>in</strong> Proc. Annu. Meet<strong>in</strong>g<br />
of <strong>the</strong> Association for Research <strong>in</strong> Vision and Ophthalmology (ARVO),<br />
2001.<br />
[12] R. Ja<strong>in</strong>, R. Kasturi, and B. Schunck, Mach<strong>in</strong>e Vision. New York: Mc-<br />
Graw-Hill, 1995.<br />
[13] A. Kaupp, A. Dolemeyer, R. Wilzeck, R. Schlosser, S. Wolf, and D.<br />
Meyer-Ebrecht, “Measur<strong>in</strong>g morphological properties of <strong>the</strong> human<br />
ret<strong>in</strong>al vessel system us<strong>in</strong>g a two-stage <strong>image</strong> process<strong>in</strong>g approach,” <strong>in</strong><br />
Proc. IEEE Int. Conf. Image Process<strong>in</strong>g, 1994, pp. 431–435.<br />
[14] H. Kawai and S. Tamura, “Eye movement analysis system us<strong>in</strong>g fundus<br />
<strong>image</strong>s,” Pattern Recognit., vol. 19, no. 1, pp. 77–84, 1986.<br />
[15] P. Meer, D. M<strong>in</strong>tz, and A. Rosenfeld, “Robust regression methods for<br />
computer vision: A review,” Int. J. Comput. Vis., vol. 6, no. 1, pp. 59–70,<br />
1991.<br />
[16] C. Oyster, The Human Eye: Structure and Function. Sunderland, MA:<br />
S<strong>in</strong>auer Associates, 1999.<br />
[17] A. P<strong>in</strong>z, S. Bernogger, P. Datl<strong>in</strong>ger, and A. Kruger, “Mapp<strong>in</strong>g <strong>the</strong> human<br />
ret<strong>in</strong>a,” IEEE Trans. Med. Imag., vol. 17, pp. 606–619, Aug. 1998.<br />
[18] W. Press, S. Teukolsky, W. Vetterl<strong>in</strong>g, and B. Flannery, Numerical<br />
Recipes <strong>in</strong> C: The Art of Scientific Comput<strong>in</strong>g, 2nd ed. Cambridge,<br />
U.K.: Cambridge Univ. Press, 1992.<br />
[19] A. Rosenfeld, “Geometric properties’ of sets of l<strong>in</strong>es,” Pattern Recognit.<br />
Lett., vol. 16, pp. 549–556, May 1995.<br />
[20] C. S<strong>in</strong>thanayoth<strong>in</strong>, J. Boyce, H. Cook, and T. Williamson, “Automated<br />
localization of <strong>the</strong> <strong>optic</strong> disc, fovea, and ret<strong>in</strong>al blood vessels from digital<br />
color fundus <strong>image</strong>s,” Br. J. Ophthalmol., vol. 83, pp. 902–910, 1999.<br />
[21] M. Sonka, V. Hlavac, and R. Boyle, Image Process<strong>in</strong>g, Analysis and<br />
Mach<strong>in</strong>e Vision, 2nd ed. London, U.K.: Chapman & Hall, 1999.<br />
[22] STARE project website (2003, July). [Onl<strong>in</strong>e]. Available:<br />
http://www.ces.clemson.edu/~ahoover/stare<br />
[23] S. Tamura, Y. Okamoto, and K. Yanashima, “Zero-cross<strong>in</strong>g <strong>in</strong>terval correction<br />
<strong>in</strong> trac<strong>in</strong>g eye-fundus blood vessels,” Pattern Recognit., vol. 21,<br />
no. 3, pp. 227–233, 1988.<br />
[24] Y. Tolias and S. Panas, “A <strong>fuzzy</strong> vessel track<strong>in</strong>g algorithm for ret<strong>in</strong>al<br />
<strong>image</strong>s based on <strong>fuzzy</strong> cluster<strong>in</strong>g,” IEEE Trans. Med. Imag., vol. 17,<br />
pp. 263–273, Apr. 1998.<br />
Authorized licensed use limited to: IEEE Xplore Customer. Downloaded on October 27, 2008 at 06:14 from IEEE Xplore. Restrictions apply.