PDF: 529 KB - ATRF.info
PDF: 529 KB - ATRF.info
PDF: 529 KB - ATRF.info
Create successful ePaper yourself
Turn your PDF publications into a flip-book with our unique Google optimized e-Paper software.
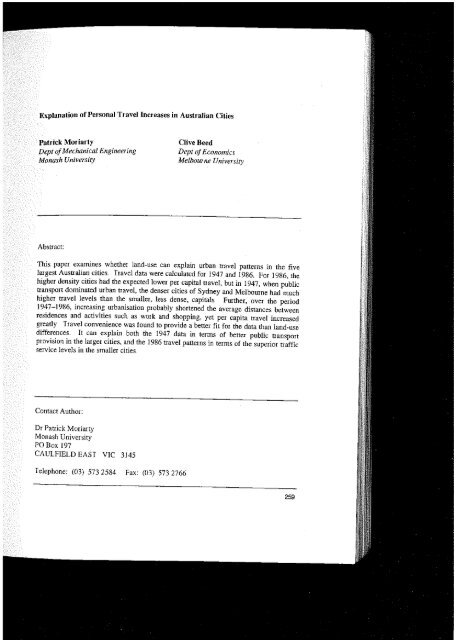
Explanation of Personal Travel Increases in Australian Cities<br />
Patrick Modarty<br />
Dept ofMeciUlnical Engineering<br />
Monash Univer:sity<br />
Abstract:<br />
Contact Author:<br />
Clive Heed<br />
Dept ofEconomics<br />
Melbourne University<br />
This paper examines whether land-use can explain urban travel patterns in the five<br />
largest Australian cities. Travel data were calculated for 1947 and 1986. For 1986, the<br />
higher density cities had the expected lower per capital travel, but in 1947, when public<br />
transport dominated urban travel, the denser cities of Sydney and Melbourne had much<br />
higher travel levels than the smaller, less dense, capitals Further, over the period<br />
1947-1986, increasing urbanisation probably shortened the average distances between<br />
residences and activities such as work and shopping, yet per capita travel increased<br />
greatly Travel convenience was found to provide a better fit for the data than land-use<br />
differences It can explain both the 1947 data in terms of betrer public transport<br />
provision in the larger cities, and the 1986 travel patterns in terms of the superior traffic<br />
service levels in the smaller cities<br />
Dr Patrick Moriarty<br />
Monash University<br />
PO Box 197<br />
CAUlFIELD EAST VIC 3145<br />
Telephone: (03) 5732584 Fax: (03) 5732766<br />
259
Moriarty andReed<br />
Introduction<br />
In the context of the large Australian city, this paper questions the sometimes-assumed<br />
idea that low density settlement has been the major cause of increasing per capita<br />
vehicular travel Ihe complement of the common assumption is challenged also This is<br />
the belief that the most appropriate policy to reduce the demand for vehicular travel is to<br />
increase urban settlement densities<br />
Several researchers (e.g., Moriarty and Beed, 1990; Hillsman and Southworth,<br />
1990; May, 1991), have suggested reductions in travel demand as a means of tackling<br />
such problems as greenhouse warming, oil depletion, urban air pollution and traffic<br />
congestion But if for any reason, vehicular travel reductions are advocated, it is<br />
important to know the main causes of the great increases in per capita travel that occwred<br />
in large Australian cities over recent decades<br />
Several lines of evidence suggest that changes in land-use, especially UIban<br />
density, are a major factor in explaining increases in personal travel levels, Newman and<br />
Kenworthy (1989), for example, studied 32 cities in Australia, Europe, North America<br />
and Asia, and found that per capita petrol consumption and vehicular travel decreased<br />
exponentially as urban density increased. For several of these cities, it has been found<br />
also that per capita travel increases with distance from the city centr'e (Moriarty and Beed<br />
1987; Newman and Kenworthy, 1989), whereas residential density itself tends to<br />
decrease with distance from the centre.<br />
Further evidence for a link between urban density and travel levels is found by<br />
examining how travel and density in each city change over time. In their book, Newman<br />
and Kenworthy (1989) present relevant data for each city for 1960, 1970 and 1980 For<br />
nearly aB cities (including Australia's five major cities), increased personal travel has<br />
accompanied decreases in urban density over the 1960-1980 period<br />
There is therefore a strong case prima facie for advancing land-use as a major<br />
factor in explaining travel differences, both between various cities at any given time, and<br />
over time in each city, It is assumed that increased density reduces the average separation<br />
between typical origins and destinations, such as residences and shops or work places<br />
The implicit assumption is then made that such reductions in the need for travel will lead<br />
directly to reductions in actual travel<br />
Ihe main task of this paper is to consider these claims by examining transport and<br />
land-use data for Australia's five major cities for the years 1947-1986 (The first postwar<br />
census was held in 1947, and was selected as the starting point because public<br />
transport still dOnUnated urban vehicular travel Ihe year 1986 was chosen because it is<br />
the most recent census for which full data are available) Since land-use and density was<br />
found not to have an important direct impact on travel, a second task of this paper is to<br />
provide alternative explanations for the travel and land-use patterns found<br />
260
Moriarty andBeed<br />
Most of the figures in lable 1 can be derived directly from the State and<br />
Commonwealth Yearbooks of the peIiod, with the important exceptions of the travel<br />
data. Although public trausport patronage figures were available, average trip lengths<br />
were usuaily not available for each public mode Where unavailable, total revenue and<br />
fares per kilometre were used to calculate total passenger-km fOI each public mode For<br />
pIivate trausport in 1947, there was still some rationing ofpetrol, but the ration enabled<br />
the average motorist still to travel about 6500 km!year which was 90% of prewar use<br />
(ABS, 1948-52). Assuming an occupancy rate of 15 persons per car and the given car<br />
ownership figures, per capita travel by car could be calculated. But because of<br />
<strong>info</strong>rmation gaps, the travel data can ouly be regarded as approximate<br />
Table 2 Transport and land-use data, 1986<br />
Sydney Melbourne Brisbaue Adelaide Perth<br />
Statistical Division Area (km2). 12,154 6129 4530 1924 5417<br />
Population (OOOs) 3473 2942 1149 1004 1065<br />
Cars/lOOO population 447 514 489 519 530<br />
Per capita vehicular pass-km 9120 9600 10260 9170 9780<br />
- public trauSpOIt 1500 800 880 550 490<br />
- car 7620 8800 9380 8620 9290<br />
Average household size 293 2.88 296 2.78 290<br />
Pop. % at LGA densities 316 257 83 50 0<br />
Explanation of w ban travel increases<br />
Table 2 shows that by 1986, per capita vehicular ttavel in the smaller cities was,<br />
on average, slightly higher than in the larger cities As in 1947, car ownership and<br />
household size varied little across the five cities. Once again, the share ofthe population<br />
living at gross LGA densities of 2500/km2 OI higher was greater in the two larger<br />
capitals<br />
Comparison of Tables 1 and 2 shows that personal ttavellevels grew rapidly over<br />
the period 1947-1986 in all cities, with the greatest increase in the smaller capitals In all<br />
cities. this per capita travel rise is associated with increasing car ownership and use, since<br />
public ttanspOIt patronage has fallen, even in absolute terms Population of the inner<br />
suburbs had fallen, as the ABS Yearbooks show, partly because of declining household<br />
size in all five cities The average distance ofthe population from the CBD increased also<br />
with growth in city population over the period.. Finally, Tables 1 and 2 show that the<br />
relative impOItance of the CBD fOI shopping declined greatly since 1947.<br />
No overall density figures are presented in Tables 1 and 2, because of their<br />
ambiguity .. Newman and KenwOIthy (1989) base their definition of "urban density" on<br />
the exclusion ofland used fOI agriculttue, forest OI large open space, as well as zoned<br />
urban land presently undeveloped For the Ausualian cities, their relevant urban<br />
populations were those of the Statistical Divisions, as used in this paper, but their urban<br />
area for 1980 was only a small fraction (15% - 38%) of the Statistical Division areas<br />
given in Table 2.. On Newman and KenwOIthy's definition, the larger two capitals have<br />
experienced a density decrease of nearly 20% between 1960 and 1980, and the smaller<br />
three cities of 30% or mOle Such a definition would give even greater deCreases over<br />
the period 1947-1986, since this density figure depends mainly on household size and<br />
residential plot size.<br />
Other density definitions give a very different picture FOI example, if density<br />
calculations are based on the 1986 Statistical Division areas, density will show a<br />
several-fold increase over the period, corresponding to population growth. Even if the<br />
much more modest mettopolitan areas (as defined at the 1947 census) are used - fOI<br />
example, about 800km 2 fOI Melbourne - population density still shows a 50% or more<br />
increase over the period for each city. But this definition of urban boundaries would<br />
exclude a large propOItion ofthe 1986 Statistical Division population<br />
The problems evident in using constant boundaries over time are avoided by<br />
Newman and KenwoI'thy's approach However, this definition brings its own<br />
problems. since a very dispersed city, for example one with much "ribbon development"<br />
along rail lines or main roads, can still give a high urban density It is thus a poor<br />
measure of the compactness of a city, and its change through time Clearly, to ttack<br />
land-use changes over time, measures other than density will be needed.<br />
263
Mar iarty and Seed<br />
Can land-use help explain havel changes?<br />
The data presented in the tables allow three ways of examining the relationship between<br />
vehicular travel and land-use; fIrst, comparison ofland-use and travel across the cities in<br />
1947, second, the same thing for 1986, and, thitd, comparison ofland-use and transport<br />
changes for each city over the period 1947-1986<br />
The travel parameter used throughout this paper is vehicular passenger-km per<br />
capita.. A variety of land-use parameters is available, either singularly or in combination<br />
These include not ouly the density types already discussed, but also population and job<br />
densities ofvarious zones of each city, and population (and job) density gradients. Other<br />
parameter s, discussed later, attempt to measure the degree ofintermixing of various landuses<br />
such as residences, shops and workplaces Density is found to be adequate for<br />
comparing cities at a given time, but £01 following changes in a given city over time, it is<br />
necessary to use paIametel's based on the degree ofintermixing of different land uses<br />
Density and travel relationships<br />
As we have seen, there are many definitions of density Fortunately, however the<br />
various density measures given much the same results when used to compare the<br />
different cities at anyone year Thus for both 1947 and 1986, Newman and<br />
Kenworthy's urban density, gross urban density gradients, and population % living at<br />
LGA densities;" 2500/krn2, all show that the order in terms of decreasing density is<br />
Sydney, Melbourne, Brisbane, Adelaide and Perth This is the same raukiug as<br />
populatiou. It follows from Table 1 that iu 1947, iucreased density of cities correlates<br />
positively with increased travel, not inversely! This is an impOItant result, since travel<br />
and density differences between the two groups of cities was then quite clear<br />
By 1986 ,per capita travel and density were inversely related, although travel in<br />
the smailer capitals was only slightly higher than in the larger two cities So, with the<br />
change in dominant travel mode from public to private transport, the effect of density on<br />
travel has been reversed There have been large per capita travel increases, but as aheady<br />
discussed, density changes over the period 1947-1986 are ambiguous .. We therefore turn<br />
to other land-use measures for the third test ofthe land-use transport relationship<br />
Minimwn trip lengths and overailtravel<br />
What needs to be determined is whether the separation of residences and destinations<br />
such as workplaces or schools has, on average, increased or decreased over the: period<br />
examined Here we will atrempt to measure minimwn trip lengths for three important trip<br />
types: work, education and shopping.<br />
264
Explanation ofurban travel increa5e,s<br />
Because the great majority of workers can be assigned a definite workplace, it is<br />
possible, llsing census data, to obtain a fairly precise measure of average<br />
home-workplace separation Using the transportation assignment method, the minimum<br />
airline commuter travel distance can be calculated for each city For Australian cities,<br />
with their job-surplus centres and generally workplace-deficient middle and outer<br />
suburbs, minimum work travel occurs when all workers who cannot be assigned a job in<br />
their own LOA travel to a job located on a ray joining their residence and the city centre<br />
(Hamilton 1982; Moriarty and Beed 1987). Dividing by the relevant workforce then<br />
allows comparison of the average minimum commuter distance for each city, and its<br />
change over time<br />
Unfortunately, the earliest workplace data is for the 1961 census, and is now<br />
available only for Sydney and Melbourne (Sydney Area Transport Study, 1974;<br />
O'Connor and Maher, 1979) From 1961 to 1986, minimum commutes actually<br />
decreased from 5 31rr(l to 4 8km for Melbourne, and from 5.9km to 5.4 km for Sydney<br />
(For comparison, the 1986 values for Adelaide and Perth were 3. 9km and 5..okm<br />
respectively) A possible objection is that workplace specialisation has increased since<br />
1961; allowing for such specialisation would increase the 1986 figures more than the<br />
1961 ones. But job specialisation can have only a minor effect on minimum work trip<br />
distances (Moriarty and Beed, 1988) This conclusion is supported by actual work trip<br />
distances, which appear to have changed very Iitrle over the years; in Melbourne, for<br />
example, it has fluctuated between lOkm and IIkm since 1961<br />
For other home-based trips - and the great majority of urban passenger trips are<br />
home-based - the calculation of minimum separation is more difficult; hence we will only<br />
try to ascertain the direction of change There have been marked changes in educational<br />
training since 1947 Then, the equivalent of about 165% of the Australian population<br />
studied full-time, but by 1986, this figure had risen to 24% (ABS, 1948-52; ABS,<br />
1988) All this increase occured at the secondary and tertiary levels. This rise, combined<br />
with a doubling or trebling of city populations, resulted in a greatly expanded number of<br />
secondary and tertiary educational centres in each city<br />
Overall, for the total student population in each city, the average distance to the<br />
nearest relevant educational institution has probably increased since 1947, because the<br />
catchment areas for secondary and tertiary centres are larger than those for primary<br />
schools. But especially for secondary and tertiary education, average minimum trip<br />
distances will have fallen, because of the increased number of new campuses in the<br />
middle and outer suburbs<br />
Patterns of shopping have also changed greatly Real retail expenditure per urban<br />
resident has doubled between the 1947/8 and 1985/6 surveys of retail establishments<br />
(ABS 1949, 1987) Further, in 1948, the Central mnnicipality in each city (containing<br />
the CBD) averaged over half of each city's retail sales, bnt by 1986 Central sales averaged<br />
only about one-eighth of the total But even in 1948, most food shopping was done in<br />
local shopping centres Today, both central and local shopping centres have lost market<br />
share to the regional drive-in shopping centres<br />
265
Moriarty andReed<br />
In all cities, the trip length to the major shopping centre (still the CBD) has risen,<br />
since the average residential distance from the CBD has risen (Tables I and 2). The<br />
average distances to local shops may also be slightly greater On the other hand, the<br />
average resident is now much closer to a larger retail centre, For example, in MelboUIne<br />
in 1948, only one sijburban LOA (PraInan) had a retail turnover exceeding $200 million<br />
in 1986 values; by 1986, there were 36 Most of these LOAs had individual shopping<br />
centres with sales exceeding $(1986) 100 million (ABS 1987) In summary, average<br />
residential separation from the traditional centres of shopping - central and local _ has<br />
increased, but the average resident in all five cities is now much closer to a major<br />
shopping centre than she was in 1948<br />
Overall in this section, we have found density to have contradictory effects on<br />
personal travel levels, depending on which vehicular travel mode is dominant<br />
FurtherffiOIe. over the period studied, we found no evidence that ongoing<br />
subwbanization has increased the average separation between residences and<br />
workplaces, shopping centres or educational institutions ofa given level The evidence<br />
suggests that the strong present-day relationship found by comparing density betweeu<br />
and within cities (for a given year) with personal travel is the result of one or more other<br />
factors which correlate strongly with density<br />
Why have personal travel levels increased?<br />
We have already shown that a reversal in the correlation of density and personal travel<br />
accompanied the change from public transport to car as the leading travel mode, and<br />
further suggested that we need to examine factors other than density - or other land-use<br />
parameters, Here, we defend the view that changes in vehicular travel convenience best<br />
explain the data we have presented. We fIrst look at how travel, and its convenience, has<br />
changed since 1947<br />
Before the surge in car ownership which began in the late I940s, most urban<br />
residents relied on non-motorised travel, especially walking, for accessing local shops<br />
and schools, or visiting friends, if such destinations were within a kilometre or so of<br />
their home Typically, some 20% of work trips were made on foot or by bicycle..<br />
Vehicular travel was mainly used for travel to the city centre, where the majority of<br />
workplaces. retail sales, major sports centres and entertainment activities were<br />
concentrated, The central city was - and remains - the focus of the public transport<br />
system, although the adjacent suburbs were usually also well served. In surburbs further<br />
out, however, many short trips were either not possible by public transport, or could be<br />
made faster by non-motorised means<br />
The rise of mass car ownership changed all this. The continuously upgraded<br />
road network joined any origin to all possible destinations.. Local trips, except for the<br />
very shortest, were now made by car rather than on foo!" Longer non-radial trips,<br />
hitherto slow and difficult - ifeven possible - by public transport, could now be made<br />
266
Moriarty andBeed<br />
Travel convenience can thus provide reasonable explanations for all three sets of<br />
travel data Land-use, ou the other hand, is inadequate as an explanation of the 1947<br />
travel data, and the changes since then Moreover, we argue that the main reason why<br />
the high densities of Europe and Japan today have lower personal travel levels than<br />
Australian or U"S" cities is because they are much less convenient for car traffic<br />
Similarly. inner city residents have lower travel· levels than outer suburban residents<br />
because of the inferior traffic service levels closer to the CBD (NAASRA, 1984)<br />
Policy implications<br />
What are the policy iinplications of our argument? We are not denying that certain landuse<br />
changes can help reduce travel Increasing the population and/or job density of the<br />
inner and ntiddle suburbs will reduce travel- but mainly by reducing travel convenience<br />
But increasing the density of outer suburbs will not of itself reduce travel; such density<br />
increases have occured since 1947, but travel by each outer suburban resident has also<br />
grown rapidly Densities there are still too low to constrain car traveL Even high-density<br />
development (for example, around railway stations) will reduce travel minimally, if<br />
traffic is only constrained over this small area,<br />
In Australian cities, at least, modifying land-use is thus really only an indirect<br />
way of increasing traffic consuaint It is better to practise such restraint directly, since<br />
policies such as speed limit reductions, parking restrictions or road closures are cheaper<br />
and faster to implement. Even if politically feasible, large density increases in the inner<br />
areas of OUI cities would fake decades to accomplish, Nevertheless land-use policies are<br />
still necessary in Australian cities, to conserve agricultural and bush land, for example<br />
T'ravellevels ar'e not solely determined by travel convenience" Generally, income<br />
levels and the costs of travel are also important, since rising incomes enable mass car<br />
ownership and the associated suburban life-style In poor societies, income is the<br />
obvious constraint on vehicular travel, But for high-income countries, there is no<br />
relationship between income and travel; Japanese cities have higher incomes, but much<br />
lower personal travel levels than Australian cities today Also, the rising personal costs<br />
of travel as the car replaced public transport did not prevent the huge growth in travel<br />
levels (Even so, increasing car travel costs could complement traffic restraint asa travel<br />
reduction policy)<br />
Finally, rising incomes are also linked with social changes such as declining<br />
household size, increased enrolment in secondary and tertiary education and greater<br />
numbers of women in the workforce All these changes would increase per capita travel<br />
frequency; on the other hand, other social changes (eg declining church or cinema<br />
atrendance) would decrease it<br />
268
Conclusions<br />
Explanation oj urban travel increases<br />
The main aim of this paper has been to examine whether land-use can explain urban<br />
travel patterns in the five largest Australian cities Travel data were calculated for 1947<br />
and 1986 For 1986, the conventional inverse relationship between density and per<br />
capita travel was found, but in 1947, when public transport was dominant, the denser<br />
cities of Sydney and Melbourne had higher travel levels than the smaller, less dense<br />
capitals Further, over the period 1947-86, suburbanisation probably shortened the<br />
average distances between residencies and activities such as work and shopping, yet per<br />
capita travel grew apace<br />
Travel convenience was then proposed as the major factor influencing travel lt<br />
was able to explain both the higher travel levels in the larger cities in 1947 in terms of<br />
better public transport provision, and the reverse result in 1986 in terms of the superior<br />
traffic service levels in the smaller capitals Per capita travel growth over the period in all<br />
cities is matched by the evident increase in overall travel convenience accompanying the<br />
shift from public transport to cars<br />
The strong inverse correlation found between density and (car) travel per capita in<br />
Western cities is argued to result from the much higher levels of restraint on car travel<br />
provided by the more densely populated cities Although increasing the density of cities<br />
can in some circumstances reduce travel, it is inferior to direct measures to increase travel<br />
restraint, as these can be introduced both more rapidly and more cheaply.<br />
269


