PDF: 529 KB - ATRF.info
PDF: 529 KB - ATRF.info
PDF: 529 KB - ATRF.info

You also want an ePaper? Increase the reach of your titles
YUMPU automatically turns print PDFs into web optimized ePapers that Google loves.
Mar iarty and Seed<br />
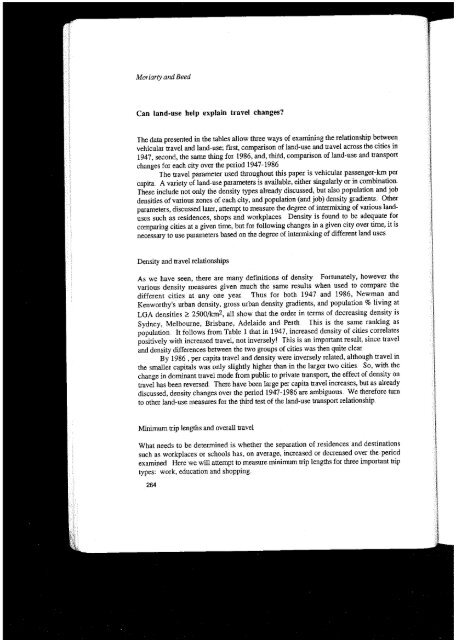
Can land-use help explain havel changes?<br />
The data presented in the tables allow three ways of examining the relationship between<br />
vehicular travel and land-use; fIrst, comparison ofland-use and travel across the cities in<br />
1947, second, the same thing for 1986, and, thitd, comparison ofland-use and transport<br />
changes for each city over the period 1947-1986<br />
The travel parameter used throughout this paper is vehicular passenger-km per<br />
capita.. A variety of land-use parameters is available, either singularly or in combination<br />
These include not ouly the density types already discussed, but also population and job<br />
densities ofvarious zones of each city, and population (and job) density gradients. Other<br />
parameter s, discussed later, attempt to measure the degree ofintermixing of various landuses<br />
such as residences, shops and workplaces Density is found to be adequate for<br />
comparing cities at a given time, but £01 following changes in a given city over time, it is<br />
necessary to use paIametel's based on the degree ofintermixing of different land uses<br />
Density and travel relationships<br />
As we have seen, there are many definitions of density Fortunately, however the<br />
various density measures given much the same results when used to compare the<br />
different cities at anyone year Thus for both 1947 and 1986, Newman and<br />
Kenworthy's urban density, gross urban density gradients, and population % living at<br />
LGA densities;" 2500/krn2, all show that the order in terms of decreasing density is<br />
Sydney, Melbourne, Brisbane, Adelaide and Perth This is the same raukiug as<br />
populatiou. It follows from Table 1 that iu 1947, iucreased density of cities correlates<br />
positively with increased travel, not inversely! This is an impOItant result, since travel<br />
and density differences between the two groups of cities was then quite clear<br />
By 1986 ,per capita travel and density were inversely related, although travel in<br />
the smailer capitals was only slightly higher than in the larger two cities So, with the<br />
change in dominant travel mode from public to private transport, the effect of density on<br />
travel has been reversed There have been large per capita travel increases, but as aheady<br />
discussed, density changes over the period 1947-1986 are ambiguous .. We therefore turn<br />
to other land-use measures for the third test ofthe land-use transport relationship<br />
Minimwn trip lengths and overailtravel<br />
What needs to be determined is whether the separation of residences and destinations<br />
such as workplaces or schools has, on average, increased or decreased over the: period<br />
examined Here we will atrempt to measure minimwn trip lengths for three important trip<br />
types: work, education and shopping.<br />
264