Habitat distribution, population status, and genetic diversity of ...
Habitat distribution, population status, and genetic diversity of ...
Habitat distribution, population status, and genetic diversity of ...
You also want an ePaper? Increase the reach of your titles
YUMPU automatically turns print PDFs into web optimized ePapers that Google loves.
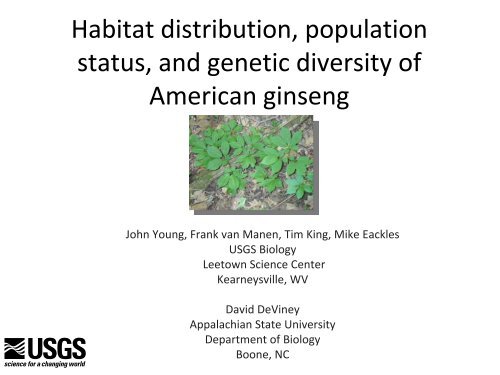
<strong>Habitat</strong> <strong>distribution</strong>, <strong>population</strong><br />
<strong>status</strong>, <strong>and</strong> <strong>genetic</strong> <strong>diversity</strong> <strong>of</strong><br />
American ginseng<br />
John Young, Frank van Manen, Tim King, Mike Eackles<br />
USGS Biology<br />
Leetown Science Center<br />
Kearneysville, WV<br />
David DeViney<br />
Appalachian State University<br />
Department <strong>of</strong> Biology<br />
Boone, NC
1.<br />
2.<br />
3.<br />
Project Objectives<br />
Develop habitat <strong>distribution</strong> models for<br />
American ginseng for portions <strong>of</strong> 18 states.<br />
Determine demographic parameters <strong>and</strong><br />
<strong>population</strong> characteristics.<br />
Determine <strong>genetic</strong> <strong>diversity</strong> <strong>and</strong> structure<br />
within <strong>and</strong> among field sampled <strong>population</strong>s.
1.<br />
2.<br />
Goals <strong>of</strong> Analysis<br />
Contrast American ginseng <strong>distribution</strong>,<br />
<strong>population</strong> structure, <strong>and</strong> <strong>genetic</strong> <strong>diversity</strong> by<br />
l<strong>and</strong> ownership<br />
Public conservation<br />
‐ National & State Parks,<br />
Wildlife areas, Wilderness<br />
Public multiple use<br />
‐National <strong>and</strong> State Forests,<br />
Game L<strong>and</strong>s, etc.<br />
Private conservation<br />
‐ Private conservancy l<strong>and</strong>s<br />
Other private<br />
Assess relationship between habitat<br />
suitability, connectivity, <strong>and</strong> <strong>genetic</strong> <strong>diversity</strong>
Ginseng Model Study Area<br />
o Study Ar ea<br />
200<br />
Managed Areas<br />
_ Forest L<strong>and</strong> 2001
<strong>Habitat</strong> modeling (previous study)<br />
Regression equation to predict relative<br />
probability <strong>of</strong> occurrence:<br />
‐1.2931 (intercept) + (slope * 0.0589)<br />
– (elevation * 0.0012) + (% deciduous forest *<br />
0.0181 ‐ (average solar insolation * 0.0129)<br />
Probability <strong>of</strong> occurrence increases with:<br />
‐Decreasing elevation<br />
‐Increasing slope<br />
‐Deciduous forest cover<br />
‐Low sun exposure<br />
2004‐2005 model study area
<strong>Habitat</strong> modeling<br />
(current study –1 st<br />
draft)<br />
Extrapolated logistic regression<br />
parameters from previous models<br />
to 15 “mapping zones” using GIS<br />
Zones correspond to regional l<strong>and</strong> cover<br />
mapping area <strong>of</strong> the National L<strong>and</strong><br />
Cover Database (USGS/EPA)
200<br />
o Study Area<br />
_ Forest L<strong>and</strong> 200 1<br />
o NLCD Mapping Zones<br />
Ginseng Model Mapping Zones
* Preliminary, for Mapping Zone 61 only, using prime habitat cut<strong>of</strong>f from 2004‐2005 study
Modeling issues<br />
• Draft regional models used to guide field sampling<br />
– Models based on topography, solar radiation, <strong>and</strong><br />
forest cover only<br />
– Models did not extrapolate well outside <strong>of</strong> previous<br />
study area<br />
• New model development<br />
– Additional variables (i.e., geology [soils], precipitation)<br />
– Additional data (known plant locations) from 2007‐<br />
2008 field surveys, herbaria records, <strong>and</strong> other<br />
investigators records
Field Sampling<br />
• Sampled 196 plots during 2007‐2008 in 11 states (NY,<br />
PA, OH, WV, VA, TN, KY, NC, SC, IN, MO)<br />
• 30‐m sampling plots<br />
– Searched for, <strong>and</strong> counted ginseng plants by size class<br />
– Measured elevation, aspect, slope, slope position, canopy<br />
cover<br />
– Recorded associated species <strong>and</strong> disturbance<br />
– Collected site photos <strong>and</strong> GPS coordinates<br />
• Sampled DNA from up to 8 plants/plot<br />
– 802 <strong>genetic</strong>s samples from 11 states<br />
– Measured height, # prongs, reproductive <strong>status</strong>
Field Sampling<br />
GPS location<br />
(plot center)<br />
Plot size = 30x30 m (0.09ha)<br />
20 plants = 222 plants/ha<br />
Plants sampled for <strong>genetic</strong>s
Plots sampled 2007‐2008, N=196
Population <strong>status</strong> at field plots<br />
* 33.8 plants/plot across all sites sampled 2007‐2008, N=196
Genetic Analysis in Plants<br />
• Long lived, out‐crossing, late successional species<br />
retain most <strong>of</strong> their <strong>genetic</strong> variability within<br />
<strong>population</strong>s 1<br />
• Annual, selfing, <strong>and</strong>/or early successional species<br />
allocate relatively more <strong>genetic</strong> variability among<br />
<strong>population</strong>s 1<br />
• American ginseng ??<br />
– Mixed mating system, self compatible<br />
– long‐lived<br />
– late successional forest species<br />
1 Nybom (2004) review <strong>of</strong> 307 studies using DNA markers
• Allozymes:<br />
Ginseng ‐<br />
Genetic Analysis<br />
Previous studies<br />
– More variation found among <strong>population</strong>s than within for wild <strong>population</strong>s,<br />
more within than among pop variation for cultivated (Grubbs <strong>and</strong> Case 2004)<br />
– Wild <strong>population</strong>s differ from cultivated pops in amount <strong>and</strong> <strong>distribution</strong> <strong>of</strong><br />
<strong>genetic</strong> <strong>diversity</strong>, but differences in total <strong>genetic</strong> <strong>diversity</strong> not large (Grubbs<br />
<strong>and</strong> Case 2004)<br />
– Evidence <strong>of</strong> isolation by distance (Cruse‐S<strong>and</strong>ers <strong>and</strong> Hamrick 2004)<br />
• DNA markers [RAPD]:<br />
– High degree <strong>of</strong> <strong>genetic</strong> <strong>diversity</strong> within wild <strong>and</strong> cultivated ginseng (Schluter<br />
<strong>and</strong> Punja 2002, Boehm et al. 1999, Bai et al. 1997)<br />
– More variation detected within <strong>population</strong>s rather than among for both<br />
cultivated <strong>and</strong> wild <strong>population</strong>s (Schluter <strong>and</strong> Punja 2002)<br />
– Distinct <strong>population</strong>s observed (Lim et al. 1997), natural <strong>population</strong>s<br />
<strong>genetic</strong>ally distinct from cultivated (Schluter <strong>and</strong> Punja 2002, Boehm et al.<br />
1999)<br />
– Evidence <strong>of</strong> mixing <strong>of</strong> wild <strong>population</strong>s with cultivated <strong>population</strong>s in PA<br />
(Boehm et al. 1999)
Genetic Markers<br />
• Allozyme markers (enzymes)<br />
– Advantages:<br />
• Good for range wide analysis (broad scale variation)<br />
• Inexpensive<br />
– Disadvantages:<br />
• Limited to protein encoding loci<br />
• Underestimate <strong>genetic</strong> <strong>diversity</strong> (fewer polymorphic loci)<br />
• Require fresh plant material, sample preservation<br />
• DNA markers (e.g. RAPD, Microsatellites, AFLP)<br />
– Advantages:<br />
• More resolution for detecting <strong>population</strong> size, structure, gene flow,<br />
bottlenecks (more polymorphic loci)<br />
• Discrimination <strong>of</strong> individuals <strong>and</strong> source <strong>population</strong>s possible<br />
• Minimal sample preservation needed (FTA cards, silica gel)<br />
– Disadvantages:<br />
• Reproducibility (RAPDs only)<br />
• Anonymous regions <strong>of</strong> DNA, dominant markers (RAPD, AFLP)<br />
• High level <strong>of</strong> expertise required for marker development (microsatellites)
Genetic Markers ‐<br />
Microsatellites<br />
• Short sections <strong>of</strong> repeated sequences <strong>of</strong> DNA<br />
• Mutations in non‐coding (neutral) DNA region<br />
– Some mutations common to genus, species, <strong>population</strong>s<br />
– Some mutations unique to individual<br />
• Variation in length <strong>of</strong> repeats = marker<br />
• Uses sequence information<br />
Flanking region Flanking region<br />
CTAGCTAG<br />
CTAGCTAG<br />
CTAGCTAG<br />
GATAGATAGATA TTGTCA<br />
GATAGATAGATA TTGTCA<br />
GATA TTGTCA<br />
CTAGCTAG GATAGATAGATAGATA TTGTCA<br />
207<br />
199 211<br />
600<br />
400<br />
200<br />
6000<br />
4000<br />
2000
Genetic Markers –<br />
King Lab<br />
Microsatellites<br />
• Need 12‐15 markers for <strong>population</strong> <strong>and</strong> individual<br />
discrimination<br />
• Tested published markers for Korean ginseng (Panax<br />
ginseng)<br />
– Kim et al. 2007 [10/14], Ma et al. 2007 [14/22])<br />
• Amplification problems in Panax quinquefolius<br />
• Lack <strong>of</strong> polymorphism<br />
• Developed our own set <strong>of</strong> 25 microsatellite markers for<br />
American ginseng, 14 look most promising<br />
– Enriched microsatellite DNA libraries created<br />
– Markers screened <strong>and</strong> tested in our laboratory
Ginseng<br />
Microsatellite Patterns<br />
PquC225<br />
GRSM<br />
GRSM<br />
GRSM<br />
GRSM<br />
SHEN<br />
SHEN<br />
SHEN<br />
SHEN
Ginseng<br />
Microsatellite Patterns<br />
PquD109<br />
GRSM<br />
GRSM<br />
GRSM<br />
GRSM<br />
SHEN<br />
SHEN<br />
SHEN<br />
SHEN
Ginseng<br />
Microsatellite Patterns<br />
PquC202<br />
GRSM<br />
GRSM<br />
GRSM<br />
GRSM<br />
SHEN<br />
SHEN<br />
SHEN<br />
SHEN
Test <strong>of</strong> microsatellite markers<br />
• Subset <strong>of</strong> sites across geographic range, <strong>and</strong> l<strong>and</strong><br />
ownerships (78 individuals)<br />
• Test <strong>of</strong> allele frequency differences across 12 <strong>of</strong> 14<br />
loci,3‐9 alleles each, (66 markers)<br />
• Sites:<br />
– GRSM = Great Smoky National Park (4 plants)<br />
– SHEN5, SHEN6, SHEN7 = Shen<strong>and</strong>oah National Park, VA (3<br />
sites, 18 plants)<br />
– MO10 = Roaring River State Park, MO (8 plants)<br />
– MO7 = Caney Mountain Conservation Area, MO (8 plants)<br />
– PA02 = Allegheny National Forest, PA (8 plants)<br />
– PA10 = Private l<strong>and</strong>, western PA (8 plants)<br />
– NY3 = Private l<strong>and</strong>, Cairo, NY (8 plants)<br />
– OH22 = Cultivated ginseng farm, OH (8 plants)<br />
– OH21 = Edge <strong>of</strong> Appalachia Preserve, OH (8 plants)
Coordinate 2<br />
Microsatellite DNA Collection<br />
Differentiation<br />
Non‐metric Multidimensional Scaling (MDS)<br />
Plot <strong>of</strong> individual Jaccard’s distance values<br />
MO10<br />
OH22<br />
‐0.2 ‐0.16 ‐0.12 ‐0.08 ‐0.04 0.04 0.08 0.12 0.16<br />
PA10<br />
PA02<br />
NY3<br />
SHEN5<br />
SHEN6<br />
Polygons depict inter‐ <strong>and</strong> intra‐collection variation in Jaccard’s Distance<br />
0.16<br />
0.12<br />
0.08<br />
0.04<br />
‐0.04<br />
‐0.08<br />
‐0.12<br />
‐0.16<br />
‐0.2<br />
Coordinate 1<br />
GRSM<br />
MO7<br />
SHEN7<br />
OH21
Similarity<br />
0.6<br />
OH21-A<br />
OH21-B<br />
OH21-C<br />
OH21-D<br />
OH21-E<br />
OH21-F<br />
OH21-G<br />
OH21-H<br />
MO-07-D<br />
MO-07-G<br />
MO-07-H<br />
MO-07-A<br />
MO-07-C<br />
MO-07-F<br />
MO-07-B<br />
MO-07-E<br />
VA-07-A<br />
VA-07-B<br />
VA-07-E<br />
0.5<br />
0.4<br />
0.3<br />
0.2<br />
0.1<br />
0<br />
‐0.1<br />
‐0.2<br />
Microsatellite DNA Collection<br />
Differentiation<br />
Neighbor Joining Tree on Jaccard’s distance values<br />
VA-07-H<br />
GSM-13b<br />
GSM-13c<br />
GSM-17a<br />
GSM-20d<br />
VA-05-D<br />
VA-05-E<br />
VA-05-F<br />
VA-05-G<br />
VA-05-H<br />
VA-05-A<br />
VA-05-B<br />
VA-05-C<br />
VA-06-A<br />
VA-06-E<br />
VA-06-C<br />
VA-06-B<br />
VA-06-D<br />
VA-06-F<br />
MO-10-E<br />
MO-10-G<br />
MO-10-C<br />
MO-10-A<br />
MO-10-B<br />
MO-10-F<br />
MO-10-H<br />
MO-10-D<br />
OH-22-E<br />
OH-22-H<br />
OH-22-B<br />
OH-22-F<br />
OH-22-C<br />
OH-22-G<br />
OH-22-D<br />
OH-22-A<br />
PA02-A<br />
PA02-B<br />
PA02-C<br />
PA02-D<br />
PA02-E<br />
PA02-F<br />
PA02-G<br />
PA02-H<br />
PA10-E<br />
NY-03-F<br />
PA10-B<br />
PA10-D<br />
PA10-F<br />
PA10-G<br />
PA10-C<br />
PA10-H<br />
PA10-A<br />
8 16 24 32 40 48 56 64 72<br />
NY-03-A<br />
NY-03-C<br />
NY-03-H<br />
NY-03-B<br />
NY-03-G<br />
NY-03-D<br />
NY-03-E
Φ PT<br />
‐<br />
Test <strong>of</strong> Genetic Differentiation<br />
(FST analog for binomial data)<br />
Pair‐wise ΦPT (below diagonal) <strong>and</strong> probability ΦPT value is > 0 (above).<br />
Comparison in yellow is not statistically significant.
Allocation to Collection<br />
Overall Assignment Success: 96.2%
Microsatellite DNA<br />
Allocation Graphic
*<br />
AMOVA (Analysis<br />
<strong>of</strong><br />
MOlecular<br />
VAriance)<br />
Preliminary results (AMOVA, pair‐wise ΦPT , <strong>and</strong> assignment tests),<br />
needs validation with larger dataset<br />
*
Genetic Markers ‐<br />
• AFLP = “Amplified Fragment Length Polymorphism”<br />
– No sequence information required<br />
– Highly repeatable<br />
• Two step process:<br />
1.<br />
2.<br />
Cut DNA with restriction enzymes (primers), bind<br />
adapters to end <strong>of</strong> fragments<br />
Use PCR to amplify fragments<br />
• Polymorphisms from:<br />
– Sequence variation in <strong>and</strong> around restriction sites<br />
– Insertions or deletions in amplified fragments<br />
• High numbers <strong>of</strong> dominant (presence/absence)<br />
allelic markers produced<br />
AFLP
Genetic Markers –AFLP<br />
David DeViney, M.S. Student, ASU<br />
• We tested 3 primer pairs for American<br />
ginseng:<br />
1)<br />
2)<br />
3)<br />
“Pqu1‐A”: EcoRI‐ACT, MseI‐CAA<br />
“Pqu4‐H”: EcoRI‐ACC, MseI‐CTT<br />
“Pqu7‐A”: EcoRI‐AGG, MseI‐CAA<br />
• Number <strong>of</strong> allelic markers generated for<br />
American ginseng:<br />
– 378 with 3 primers (1+2+3)<br />
– 240 with 2 primers (1+2)
GRSM<br />
GRSM<br />
GRSM<br />
GRSM<br />
SHEN<br />
SHEN<br />
SHEN<br />
SHEN<br />
PquI‐A
GRSM<br />
GRSM<br />
GRSM<br />
GRSM<br />
SHEN<br />
SHEN<br />
SHEN<br />
SHEN<br />
Pqu4‐H
Component 2<br />
Population discrimination –AFLP<br />
Principal Components Analysis<br />
KY02D<br />
KY02A<br />
OH01C<br />
OH01D<br />
OH01E<br />
IN08D<br />
NY102A NY102D<br />
1.2 NY102C<br />
‐4 ‐3.2 KY02C<br />
‐2.4 ‐1.6 ‐0.8 0.8 1.6 2.4 NC04C<br />
KY02F<br />
GSMP03A WV108D<br />
TN011B<br />
TN011A TN011C TN011D<br />
‐3<br />
Component 1<br />
2.4<br />
1.8<br />
0.6<br />
‐0.6<br />
‐1.2<br />
‐1.8<br />
‐2.4<br />
IN08B<br />
NY102B<br />
WV108C<br />
WV108B<br />
NC04D<br />
NC04A<br />
NC04B<br />
WV108A<br />
GSMP03D<br />
GSMP03C
Remaining tasks:<br />
• Winter‐Spring 2009<br />
– Develop new ginseng <strong>distribution</strong> models<br />
– Survey all <strong>genetic</strong> samples for AFLP <strong>and</strong> microsatellite<br />
variation<br />
• Early summer 2009<br />
– Collect additional <strong>genetic</strong> samples<br />
• Late summer‐early fall 2009<br />
– Data analysis<br />
• Assess phylogeographic <strong>and</strong> <strong>population</strong> structure<br />
• Diversity within/among sites by l<strong>and</strong> ownership<br />
• Genetic <strong>diversity</strong> compared to habitat <strong>distribution</strong>/quality
Acknowledgements<br />
• Marcus Springmann (USGS) – field data<br />
collection, <strong>genetic</strong> laboratory assistance<br />
• Chris Walter (USGS) – field data collection,<br />
assistance with GIS data compilation<br />
• Pat Ford (FWS), state ginseng coordinators –<br />
contacts with l<strong>and</strong> owners<br />
• Bob Beyfuss, Eric Burkhart – contacts with private<br />
<strong>and</strong> state l<strong>and</strong>owners<br />
• Numerous l<strong>and</strong>owners <strong>and</strong> l<strong>and</strong> managers who<br />
provided access to their property for sampling


