Examples of SPSS MANOVA Syntax for Univariate & Multivariate ...
Examples of SPSS MANOVA Syntax for Univariate & Multivariate ...
Examples of SPSS MANOVA Syntax for Univariate & Multivariate ...

Create successful ePaper yourself
Turn your PDF publications into a flip-book with our unique Google optimized e-Paper software.
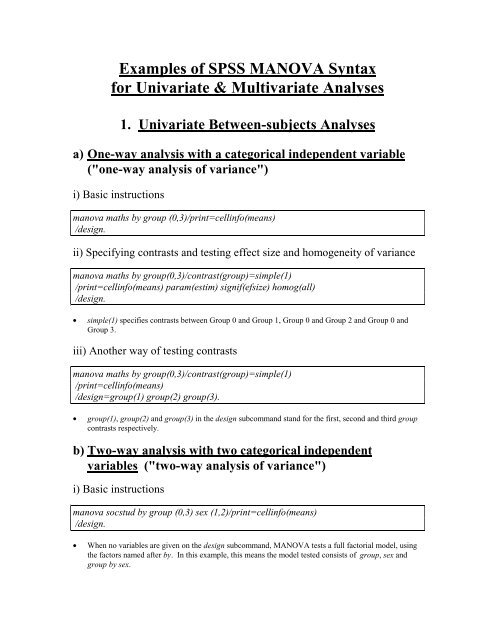
<strong>Examples</strong> <strong>of</strong> <strong>SPSS</strong> <strong>MANOVA</strong> <strong>Syntax</strong><br />
<strong>for</strong> <strong>Univariate</strong> & <strong>Multivariate</strong> Analyses<br />
1. <strong>Univariate</strong> Between-subjects Analyses<br />
a) One-way analysis with a categorical independent variable<br />
("one-way analysis <strong>of</strong> variance")<br />
i) Basic instructions<br />
manova maths by group (0,3)/print=cellinfo(means)<br />
/design.<br />
ii) Specifying contrasts and testing effect size and homogeneity <strong>of</strong> variance<br />
manova maths by group(0,3)/contrast(group)=simple(1)<br />
/print=cellinfo(means) param(estim) signif(efsize) homog(all)<br />
/design.<br />
• simple(1) specifies contrasts between Group 0 and Group 1, Group 0 and Group 2 and Group 0 and<br />
Group 3.<br />
iii) Another way <strong>of</strong> testing contrasts<br />
manova maths by group(0,3)/contrast(group)=simple(1)<br />
/print=cellinfo(means)<br />
/design=group(1) group(2) group(3).<br />
• group(1), group(2) and group(3) in the design subcommand stand <strong>for</strong> the first, second and third group<br />
contrasts respectively.<br />
b) Two-way analysis with two categorical independent<br />
variables ("two-way analysis <strong>of</strong> variance")<br />
i) Basic instructions<br />
manova socstud by group (0,3) sex (1,2)/print=cellinfo(means)<br />
/design.<br />
• When no variables are given on the design subcommand, <strong>MANOVA</strong> tests a full factorial model, using<br />
the factors named after by. In this example, this means the model tested consists <strong>of</strong> group, sex and<br />
group by sex.
-2-<br />
ii) Using a sequential analysis to test factors in different orders<br />
manova socstud by group (0,3) sex (1,2)/print=cellinfo(means)<br />
/method=sequential<br />
/design=group sex/design=sex group.<br />
iii) Specifying contrasts and testing a main effects model<br />
manova socstud by group (0,3) sex (1,2)/print=param(estim)<br />
/contrast(group)=polynomial/contrast(sex)=simple(2)/<br />
/design=group sex.<br />
• Simple(2) specifies the second level <strong>of</strong> sex as the reference category. It’s coincidental that the code <strong>for</strong><br />
this level is 2. If the codes <strong>for</strong> sex were 0 and 1, and we wanted category 1 to be the reference<br />
category, we would still specify simple(2).<br />
iv) Testing simple effects<br />
manova socstud by group (0,3) sex (1,2)<br />
/design<br />
/design=sex group within sex(1) group within sex(2)<br />
/design=group sex within group(1) sex within group(2)<br />
sex within group(3) sex within group(4).<br />
• group within sex(1) tests the overall effect <strong>of</strong> group within the first level <strong>of</strong> sex. Again, if the first level<br />
<strong>of</strong> sex was 0, we would still use sex(1) to indicate the first level.<br />
iv) Testing simple effects <strong>of</strong> contrasts<br />
manova socstud by group (0,3) sex (1,2)/print=cellinfo(means)<br />
contrast(group)=polynomial<br />
/design=sex group(1) within sex(1) group(2) within sex(1)<br />
group(3) within sex(1)<br />
group(1) within sex(2) group(2) within sex(2)<br />
group(3) within sex(2).<br />
• group(1) within sex(1) tests the first group contrast within the first level <strong>of</strong> sex.
-3-<br />
c) One continuous independent variable ("bivariate" or<br />
"simple" regression)<br />
i) Basic instructions<br />
manova english iq/analysis=english/print=param(estim)<br />
/design=constant iq.<br />
• The analysis subcommand specifies the dependent variable.<br />
• When there is no by, the model must be specified in the design subcommand.<br />
ii) Obtaining residual plots<br />
manova english iq/analysis=english/print=param(estim)<br />
/resid=plot/design=constant iq.<br />
d) Several continuous independent variables ("multiple<br />
regression")<br />
i) Basic instructions<br />
manova socstud age iq selfest/analysis=socstud<br />
/print=param(estim)/design=constant age iq selfest.<br />
ii) Obtaining sequential sums <strong>of</strong> squares, fitting the independent variables in<br />
different orders and obtaining effect sizes<br />
manova socstud age iq selfest/analysis=socstud/method=sequential<br />
/print=param(estim) signif(efsize)<br />
/design=age iq selfest/design=iq age selfest/design=selfest age iq.<br />
• Regardless <strong>of</strong> whether a unique or sequential analysis is specified, the regression coefficients always<br />
show the effect <strong>of</strong> each variable fitted last.
-4-<br />
ii) Testing an interaction between two independent variables<br />
compute iqxse=iq * selfest.<br />
manova socstud age iq selfest iqxse/analysis=socstud/method=sequential<br />
/print=param(estim)<br />
/design=constant age iq selfest iqxse.<br />
• When both components <strong>of</strong> an interaction are treated as continuous variables (i.e., not specified after the<br />
by statement), the interaction term must be computed be<strong>for</strong>e the manova command and included in the<br />
list <strong>of</strong> continuous variables.<br />
ii) Testing all interactions<br />
compute iqxse=iq * selfest.<br />
compute iqxage=iq * age.<br />
compute agexse=age * selfest.<br />
compute ixsxa=iq * selfest * age.<br />
manova socstud age iq selfest iqxse iqxage agexse ixsxa<br />
/analysis=socstud<br />
/print=param(estim)<br />
/design=constant age iq selfest iqxse iqxage agexse ixsxa.<br />
e) Both categorical and continuous independent variables<br />
("general linear model")<br />
i) Basic instructions (leaving <strong>SPSS</strong> to create the coding <strong>for</strong> both the<br />
categorical variables)<br />
manova maths age iq by group(0,3) cond (1,3)/<br />
analysis=maths/contrast(group)=simple(1)<br />
/print=param(estim)<br />
/design=age iq cond group.<br />
• If a mixture <strong>of</strong> continuous and categorical (i.e., specified after the by) variables is used, all variables<br />
must be specified in the design subcommand if they are to be included in the model.
-5-<br />
ii) Basic instructions (creating your own dummy coding <strong>for</strong> one <strong>of</strong> the<br />
categorical variables)<br />
do if (group eq 1).<br />
compute grp1=1.<br />
else.<br />
compute grp1=0.<br />
end if.<br />
do if (group eq 2).<br />
compute grp2=1.<br />
else.<br />
compute grp2=0.<br />
end if.<br />
do if (group eq 3).<br />
compute grp3=1.<br />
else.<br />
compute grp3=0.<br />
end if.<br />
manova maths age iq grp1 grp2 grp3 by cond (1,3)/<br />
analysis=maths/print=param(estim)<br />
/design=age iq cond grp1+grp2+grp3.<br />
• Using the do if method <strong>of</strong> creating dummy variables means that cases which are missing on the variable<br />
<strong>for</strong> which the dummy variables are being <strong>for</strong>med (group in this case) will also be missing on the<br />
dummy variables.<br />
• Putting + between variables in the design subcommand means that the variables will be tested as a<br />
group in the analysis <strong>of</strong> variance table (but does not affect the way the regression coefficients are tested<br />
– they are always tested as one degree-<strong>of</strong>-freedom effects).<br />
iii) "Officially" declaring two <strong>of</strong> the continuous independent variables as<br />
covariates and requesting adjusted means (“analysis <strong>of</strong> covariance”)<br />
manova maths age iq selfest by group(0,3) cond (1,3)/<br />
analysis=maths with age iq<br />
/print=param(estim)<br />
/pmeans=vars(maths) tables(group cond group by cond)<br />
/design=selfest cond group.<br />
• pmeans asks <strong>for</strong> the means <strong>of</strong> the dependent variable by group, etc, adjusted <strong>for</strong> the covariates.
-6-<br />
iv) Testing an interaction between a categorical and a continuous<br />
independent variable ("testing the homogeneity <strong>of</strong> the regression slopes")<br />
manova maths age by group(0,3)/<br />
analysis=maths<br />
/print=param(estim)<br />
/design=age group age by group.<br />
• Testing the interaction between age and group tests whether the relationship between the covariate (age<br />
in this case) and the dependent variable (maths) is the same <strong>for</strong> each group.<br />
2. Within-subjects Analyses ('<strong>Multivariate</strong>' layout <strong>of</strong><br />
data)<br />
a) One-way analysis<br />
i) Basic instructions (two levels <strong>of</strong> the within-subjects factor: equivalent to<br />
a<br />
paired t-test)<br />
manova time1 time2<br />
/wsfactor=time(2)/print=cellinfo(means)<br />
/design.<br />
ii) Basic instructions (more than two levels in the within-subjects factor)<br />
manova time1 time2 time3<br />
/wsfactor=time(3)/print=cellinfo(means) signif(multiv univ averf gg hf)<br />
design.<br />
• When there are more than two levels in the within-subject factor, two different approaches to withinsubject<br />
analyses are possible, the univariate (averf) and the multivariate (multiv). The univariate<br />
approach is based on the assumption that the variance <strong>of</strong> differences between levels <strong>of</strong> the withinsubject<br />
factor is the same <strong>for</strong> any pair <strong>of</strong> levels. gg and hf ask <strong>for</strong> in<strong>for</strong>mation about the extent <strong>of</strong> the<br />
departure <strong>of</strong> the data from this assumption. The multivariate approach does not require this<br />
assumption.
iii) Specifying contrasts<br />
-7-<br />
manova time1 time2 time3<br />
/wsfactor=time(3)/contrast(time)=helmert<br />
/rename=cons t1v23 t2v3<br />
/print=cellinfo(means) signif(multiv uni averf gg hf) trans<strong>for</strong>m<br />
design.<br />
• The rename subcommand applies labels to the contrasts which help when interpreting the output<br />
• trans<strong>for</strong>m in the print subcommand asks <strong>for</strong> the coefficients used in trans<strong>for</strong>ming the dependent<br />
variables to be displayed. As well as creating the specified (or default) contrasts <strong>for</strong> the dependent<br />
variables, the coefficients are such that the variables are orthonormalised. This means that the sum <strong>of</strong><br />
the squares <strong>of</strong> the coefficients applied to the variables add to one. The trans<strong>for</strong>med variables are then<br />
such that a test <strong>of</strong> sphericity is a test <strong>of</strong> the assumption that the variances <strong>of</strong> the differences between the<br />
levels <strong>of</strong> the within-subject factor are homogeneous.<br />
• The helmert contrast compares each level <strong>of</strong> the factor with the mean <strong>of</strong> succeeding levels. In this case<br />
time has three levels, so the two contrasts are {2,-1,-1} and {0,1,-1}. The Helmert contrasts are<br />
orthogonal. Manova insists that all contrasts on within-subject factors are orthogonal, and if you<br />
specify non-orthogonal contrasts, Manova will orthogonalise them, which is why it’s a good idea to<br />
request the trans<strong>for</strong>mation matrix. Difference contrasts (not used here) are also orthogonal, and are<br />
there<strong>for</strong>e acceptable to Manova. They are the opposite to Helmert contrasts, in that they compare each<br />
level <strong>of</strong> the factor with the mean <strong>of</strong> preceding levels. For time in this example, they would be<br />
{-1,1,0} and {-1,-1,2}.<br />
a) Two-way analysis<br />
i) Basic instructions<br />
manova t1c1 t1c2 t2c1 t2c2 t3c1 t3c2<br />
/wsfactor=time(3) cond(2)<br />
/print=cellinfo(means) signif(multiv uni averf gg hf)<br />
design.<br />
• The order <strong>of</strong> the factor names in the wsfactor subcommand reflects the frequency with which the levels<br />
<strong>of</strong> the factors change in the variable list. In this case the first two variables (t1c1 and t1c2) both have<br />
the same level <strong>of</strong> time (t1) but different levels <strong>of</strong> cond (c1 and c2), so time comes be<strong>for</strong>e cond.<br />
ii) Specifying contrasts<br />
manova t1c1 t1c2 t2c1 t2c2 t3c1 t3c2<br />
/wsfactor=time(3) cond(2)/contrast(time)=helmert<br />
/rename=cons t1v23 t2v3 c1v2 tc1xc tc2xc<br />
/print=signif(multiv uni averf gg hf)<br />
design.
iii) Testing simple effects<br />
-8-<br />
manova t1c1 t1c2 t2c1 t2c2 t3c1 t3c2<br />
/wsfactor=time(3) cond(2)/contrast(time)=helmert<br />
/rename=cons t1v23 t2v3 c1v2 tc1xc tc2xc<br />
/signif(multiv uni averf gg hf)<br />
/wsdesign=cond time within cond(1) time within cond(2)<br />
/design<br />
/wsdesign=time cond within time(1) cond within time(2)<br />
cond within time(3)<br />
/design.<br />
3. Mixed Analyses ('<strong>Multivariate</strong>' layout <strong>of</strong> data)<br />
a) Two levels in the within-subject factor<br />
i) Basic instructions<br />
manova t1 t2 by group (0,1)<br />
/wsfactor=time(2)<br />
/print=cellinfo(means)<br />
/design.<br />
ii) Testing simple effects<br />
manova t1 t2 by group (0,1)<br />
/wsfactor=time(2)<br />
/print=cellinfo(means)<br />
/wsdesign=time<br />
/design=mwithin group(1) mwithin group(2)<br />
/wsdesign=mwithin time(1) mwithin time(2)<br />
/design=group.<br />
• mwithin is used because we are testing the effect <strong>of</strong> a within-subject factor (time) within each level <strong>of</strong> a<br />
between-subject factor, group (then the effect <strong>of</strong> a between-subject factor (group) within each level <strong>of</strong> a<br />
within-subject factor, time). The m stands <strong>for</strong> mixed.
-9-<br />
b) Three levels in the within-subject factor<br />
i) Basic instructions<br />
manova t1 t2 t3 by group (0,1)<br />
/wsfactor=time(3)<br />
/print=cellinfo(means) signif(multiv univ averf gg hf)<br />
/design.<br />
ii) Testing simple effects<br />
manova t1 t2 t3 by group (0,1)<br />
/wsfactor=time(3)<br />
/print=cellinfo(means) signif(multiv univ averf gg hf)<br />
/wsdesign=time<br />
/design=mwithin group(1) mwithin group(2)<br />
/wsdesign=mwithin time(1) mwithin time(2) mwithin time(3)<br />
/design=group.<br />
iii) Testing interaction contrasts<br />
manova t1 t2 t3 by group (0,1)<br />
/wsfactor=time(3)/contrast(time)=helmert<br />
/wsdesign=time(1) time(2)<br />
/design=group.<br />
• This breaks the interaction down into the group x time contrasts. Group x time(1) tests whether the<br />
difference between the first level <strong>of</strong> time and the mean <strong>of</strong> the second and third levels <strong>of</strong> time (the first<br />
Helmert contrast) is different <strong>for</strong> group 0 and group 1. Group x time(2) tests whether the second<br />
Helmert contrast <strong>of</strong> time (2 nd level versus 3 rd level) is different <strong>for</strong> the two groups.
a) One factor<br />
i) Basic instructions<br />
-10-<br />
4. <strong>Multivariate</strong> Analyses<br />
manova test1 test2 test3 by group (1,3)<br />
/print=cellinfo(means) signif(multiv univ dimenr)<br />
/discrim=all<br />
/design.<br />
• discrim=all asks <strong>for</strong> in<strong>for</strong>mation about the discriminant function(s).<br />
• dimenr tests the significance <strong>of</strong> second and later discriminant functions.<br />
ii) Specifying and testing contrasts<br />
manova test1 test2 test3 by group (1,3)<br />
/contrast(group)=simple(1)<br />
/print=signif(multiv univ dimenr)<br />
/discrim=all<br />
design=group(1) group(2).<br />
b) Two factors<br />
i) Basic instructions<br />
manova test1 test2 test3 by group (1,3) cond (1,2)<br />
/print=cellinfo(means) signif(multiv univ)<br />
/discrim=all<br />
/design.<br />
ii) Testing simple effects<br />
manova test1 test2 test3 by group (1,3) cond (1,2)/<br />
print=signif(multiv univ)/<br />
discrim=all/<br />
design=cond group within cond(1) group within cond(2)/<br />
design=group cond within group(1) cond within group(2)<br />
cond within group(3).
-11-<br />
c) Including a continuous independent variable<br />
manova test1 test2 test3 age by group (1,3) cond (1,2)<br />
/analysis=test1 to test3<br />
/print=signif(multiv univ)<br />
/discrim=all<br />
/design=age group cond<br />
/design=age group cond group by cond.<br />
d) <strong>Multivariate</strong> multiple regression<br />
manova test1 test2 test3 age iq<br />
/analysis=test1 to test3<br />
/print=signif(multiv univ)<br />
/discrim=all<br />
/design=age iq.<br />
e) Canonical correlation<br />
manova test1 test2 test3 with age iq score1<br />
/print=signif(multiv dimenr eigen) param(estim)/<br />
/discrim=all<br />
/design.<br />
• No by is used – variables on both sides <strong>of</strong> the equation are continuous, so with is used rather than by.<br />
• eigen asks <strong>for</strong> the canonical correlation coefficients.
f) Pr<strong>of</strong>ile analysis<br />
manova test1 test2 test3 test4 by group (0,3)/<br />
/trans<strong>for</strong>m=repeated<br />
/rename=cons t1_t2 t2_t3 t3_t4/<br />
/analysis=(cons/t1_t2 t2_t3 t3_t4)<br />
/design.<br />
-12-<br />
• Pr<strong>of</strong>ile analysis is used with dependent variables which are measured on the same scale but where there<br />
is no suggestion <strong>of</strong> a within-subject factor.<br />
• trans<strong>for</strong>m=repeated asks <strong>for</strong> the dependent variables to be trans<strong>for</strong>med into the differences between<br />
neighbouring variables. The first trans<strong>for</strong>med variable is the difference between test1 and test2; the<br />
second trans<strong>for</strong>med variable is the difference between test2 and test3, and so on.<br />
• analysis=(cons/t1_t2 t2_t3 t3_t4) specifies two analyses: a univariate analysis <strong>of</strong> the average <strong>of</strong> all<br />
dependent variables (cons), followed by a multivariate analysis <strong>of</strong> the differences between the<br />
dependent variables. It is the second analysis which tests <strong>for</strong> differences between the pr<strong>of</strong>iles <strong>of</strong><br />
different groups. A significant multivariate effect means that the pattern <strong>of</strong> differences between the<br />
dependent variables is different over groups.<br />
Alan Taylor<br />
School <strong>of</strong> Behavioural Sciences<br />
13 th June 1997