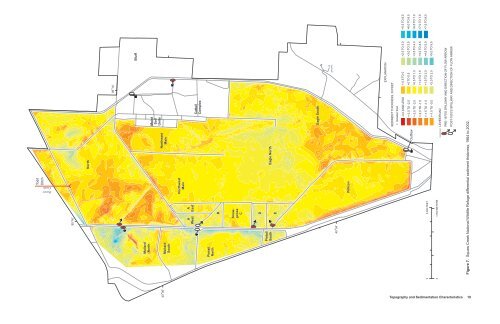
Todd Ditch Porter <strong>Creek</strong> 95°16' North 95°14' Bluff Mallard North Moist Soil Units Nor<strong>the</strong>ast Main Mallard South 40°06' Northwest Main A East A West Cattail Complex Pintail North B Snowgoose C D Eagle North Pintail South E Eagle South 40°04' Pelican EXPLANATION SEDIMENT THICKNESS, IN FEET > Greater than >5.5 TO 6.0 >2.5 TO 3.0 >-0.5 TO 0 -3.0 AND LESS >6.0 TO 6.5 >3.0 TO 3.5 >0 TO 0.5 >-3.0 TO -2.5 Outflow >6.5 TO 7.0 >3.5 TO 4.0 >0.5 TO 1.0 >-2.5 TO -2.0 >7.0 TO 7.5 >4.0 TO 4.5 >1.0 TO 1.5 >-2.0 TO -1.5 >7.5 TO 8.0 >4.5 TO 5.0 >1.5 TO 2.0 >-1.5 TO -1.0 0 5,000 FEET >5.0 TO 5.5 >2.0 TO 2.5 >-1.0 TO -0.5 0 1,500 METERS LEVEE/ROAD PRE-1970'S SPILLWAY AND DIRECTION OF FLOW ARROW POST-1970'S SPILLWAY AND DIRECTION OF FLOW ARROW Figure 7. <strong>Squaw</strong> <strong>Creek</strong> National Wildlife Refuge differential sediment thickness, 1964 to 2002. <strong>Topography</strong> <strong>and</strong> <strong>Sedimentation</strong> <strong>Characteristics</strong> 19
Sediment Deposition, 1937 to 2002 The greatest amounts <strong>of</strong> sediment deposition in <strong>the</strong> Refuge have been near <strong>the</strong> <strong>Squaw</strong> <strong>and</strong> Davis <strong>Creek</strong> inflow spillways, which have been located at various locations in <strong>the</strong> northwest <strong>and</strong> nor<strong>the</strong>ast sections <strong>of</strong> <strong>the</strong> Refuge (figs. 6 to 8). Maximum deposits near historic inflow spillways (fig. 3) have exceeded 8 ft in <strong>the</strong> Mallard pools <strong>and</strong> North pool, <strong>and</strong> more than 3 ft in <strong>the</strong> inflow areas corresponding with <strong>the</strong> current Snowgoose pools (fig. 8). When an inflow spillway is relocated, this can reduce additional sediment deposition at <strong>the</strong> original location, but cause increased sediment deposition at <strong>the</strong> new inflow location. Such reductions occurred in <strong>the</strong> North pool that directly received <strong>Squaw</strong> <strong>Creek</strong> inflows from 1937 to 1964, <strong>and</strong> had a deposition rate <strong>of</strong> 0.081 ft/yr reduced to 0.012 ft/yr from 1964 to 2002 (table 2), after inflows were redirected in <strong>the</strong> 1970’s. The current inflows from <strong>Squaw</strong> <strong>Creek</strong> are closer to <strong>the</strong> Snowgoose <strong>and</strong> Pintail pools (fig. 8), <strong>and</strong> Pintail <strong>and</strong> <strong>the</strong> nor<strong>the</strong>rnmost Snowgoose pools all received greater mean annual accumulations <strong>of</strong> sediment from 1964 to 2002 than from 1937 to 1964. While <strong>the</strong> greatest deposition depths exist near present or historic inflow spillways, essentially <strong>the</strong> entire Refuge has received, on average, 2 ft <strong>of</strong> sediment deposition since 1937 (table 2). The individual pools that received <strong>the</strong> greatest amounts <strong>of</strong> mean sediment deposition include Mallard north (3.96 ft), Mallard south (3.41 ft), <strong>and</strong> Snowgoose pool D (3.34 ft), all located near current or historic <strong>Squaw</strong> <strong>Creek</strong> spillways. The pools receiving <strong>the</strong> least amount <strong>of</strong> average deposition between 1937 <strong>and</strong> 2002 include Northwest Main (0.98 ft), Snowgoose pool A East (1.19 ft), <strong>and</strong> Eagle South (1.26 ft). While pools received, on average, 1 to 3 ft <strong>of</strong> deposition, <strong>the</strong>re were areas <strong>of</strong> <strong>the</strong> Refuge that remained relatively unchanged since 1937 including parts <strong>of</strong> <strong>the</strong> Nor<strong>the</strong>ast <strong>and</strong> Northwest Main pools, eastern sections <strong>of</strong> North pool, <strong>and</strong> <strong>the</strong> central part <strong>of</strong> Eagle South pool (fig. 8). While <strong>the</strong> <strong>Squaw</strong> <strong>and</strong> Davis <strong>Creek</strong> Basins were <strong>the</strong> primary contributors <strong>of</strong> sediment to <strong>the</strong> Refuge between 1937 <strong>and</strong> 2002, sediment contributions also could have been made by o<strong>the</strong>r Refuge tributaries <strong>and</strong> flooding from <strong>the</strong> Missouri River. The peak stage in <strong>the</strong> Refuge during <strong>the</strong> July 1993 Missouri River flood was 858.20 ft [National Geodetic Vertical Datum <strong>of</strong> 1929 (NGVD 29)] <strong>and</strong> <strong>the</strong> refuge was inundated by floodwaters for weeks (Ron Bell, oral commun., 2003). A comparable event to <strong>the</strong> 1993 flood, in terms <strong>of</strong> streamflow, occurred in 1952 on <strong>the</strong> Missouri River in north- west Missouri. No mention was made <strong>of</strong> sediment contributions from <strong>the</strong> 1952 flood to <strong>the</strong> Refuge in <strong>the</strong> 1964 USFWS Refuge management plan (U.S. Fish <strong>and</strong> Wildlife Service, 1964), <strong>and</strong> <strong>the</strong>re are no records or observations <strong>of</strong> possible sediment contributions to <strong>the</strong> Refuge from ei<strong>the</strong>r <strong>of</strong> <strong>the</strong>se floods. The strong association between <strong>Squaw</strong> <strong>and</strong> Davis <strong>Creek</strong> spillway locations <strong>and</strong> Refuge sediment deposits, <strong>the</strong> lack <strong>of</strong> measurable deposition over some areas in <strong>the</strong> Refuge that were inundated during <strong>the</strong> 1993 flood (areas <strong>of</strong> Nor<strong>the</strong>ast, Northwest Main pool, eastern section <strong>of</strong> North pool, <strong>and</strong> central Eagle pools that in 2002 were unchanged from 1937 topography), <strong>and</strong> <strong>the</strong> distance <strong>of</strong> <strong>the</strong> Refuge from <strong>the</strong> Missouri River (approximately 5 miles) indicate or suggest that sediment contributions from <strong>the</strong> Missouri River floods were not substantial. The sediment contributions from Porter <strong>Creek</strong> (fig. 3), Little Tarkio <strong>Creek</strong> (fig. 1), <strong>and</strong> Swope <strong>Creek</strong> (fig. 1) during <strong>the</strong> 1937 to 2002 period are likely insignificant in comparison with <strong>Squaw</strong> <strong>and</strong> Davis <strong>Creek</strong> but still unknown. Sediment Volume <strong>and</strong> Mass Sediment deposits have resulted in a substantial cumulative loss <strong>of</strong> pool volume in <strong>the</strong> Refuge pools since 1937. Total volume <strong>of</strong> sediment deposited in all pools between 1937 <strong>and</strong> 1964 was about 7,750 acre-ft (acre-feet) (table 2). A comparable volume for 1964 to 2002 is unavailable as <strong>the</strong> Cattail Complex/Moist soil units <strong>and</strong> Bluff pool data were lacking for <strong>the</strong> 2002 survey, but <strong>the</strong> 1937 to 1964 sediment volume for all pools excluding <strong>the</strong>se areas was about 6,200 acre-ft, or 230 acre-ft/yr (acre-feet per year) <strong>and</strong> <strong>the</strong> 1964 to 2002 deposition value was about 3,700 acre-ft, or 97.3 acre-ft/yr (table 2). The 1937 to 2002 total sediment volume deposited in <strong>the</strong> 2002 surveyed pool area in <strong>the</strong> Refuge was about 9,900 acre-ft, or 152 acre-ft/yr. Any errors associated with <strong>the</strong> 1937 <strong>and</strong> 1964 sediment surveys, <strong>and</strong> comparisons between <strong>the</strong> 2002 survey <strong>and</strong> <strong>the</strong> earlier surveys, would be reflected in <strong>the</strong> volume <strong>and</strong> mass calculations. However, <strong>the</strong> methods, data, <strong>and</strong> errors associated with <strong>the</strong>se historic surveys are unknown. While it is unlikely that any areas <strong>of</strong> extensive erosion (figs. 6 to 8) actually occurred in <strong>the</strong> Refuge between 1937 <strong>and</strong> 2002, <strong>the</strong>se erosion values were included in <strong>the</strong> total net volume values (table 2). Sediment erosion losses amounted to approximately 3 percent <strong>of</strong> <strong>the</strong> total deposition between 1937 <strong>and</strong> 1964, <strong>and</strong> 0.3 percent <strong>of</strong> <strong>the</strong> deposition between 1964 <strong>and</strong> 2002. These values (3 percent, 0.3 percent) can perhaps <strong>Topography</strong> <strong>and</strong> <strong>Sedimentation</strong> <strong>Characteristics</strong> 21