Ten-year Trends in the Financing of Family Medicine ... - STFM
Ten-year Trends in the Financing of Family Medicine ... - STFM
Ten-year Trends in the Financing of Family Medicine ... - STFM

You also want an ePaper? Increase the reach of your titles
YUMPU automatically turns print PDFs into web optimized ePapers that Google loves.
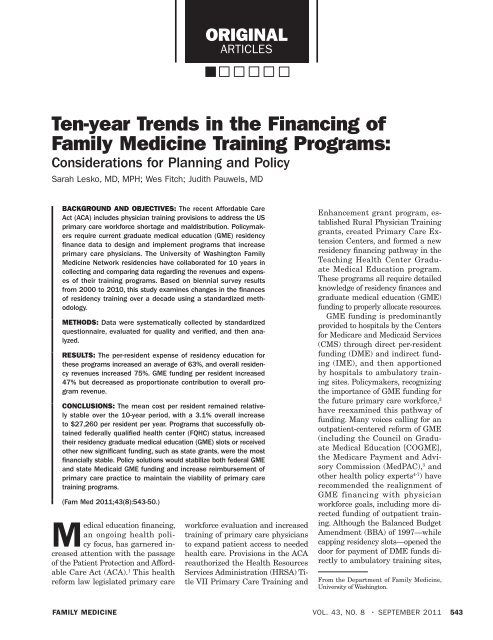
ORIGINAL<br />
ARTICLES<br />
<strong>Ten</strong>-<strong>year</strong> <strong>Trends</strong> <strong>in</strong> <strong>the</strong> F<strong>in</strong>anc<strong>in</strong>g <strong>of</strong><br />
<strong>Family</strong> Medic<strong>in</strong>e Tra<strong>in</strong><strong>in</strong>g Programs:<br />
Considerations for Plann<strong>in</strong>g and Policy<br />
Sarah Lesko, MD, MPH; Wes Fitch; Judith Pauwels, MD<br />
BACKGROUND AND OBJECTIVES: The recent Affordable Care<br />
Act (ACA) <strong>in</strong>cludes physician tra<strong>in</strong><strong>in</strong>g provisions to address <strong>the</strong> US<br />
primary care workforce shortage and maldistribution. Policymakers<br />
require current graduate medical education (GME) residency<br />
f<strong>in</strong>ance data to design and implement programs that <strong>in</strong>crease<br />
primary care physicians. The University <strong>of</strong> Wash<strong>in</strong>gton <strong>Family</strong><br />
Medic<strong>in</strong>e Network residencies have collaborated for 10 <strong>year</strong>s <strong>in</strong><br />
collect<strong>in</strong>g and compar<strong>in</strong>g data regard<strong>in</strong>g <strong>the</strong> revenues and expenses<br />
<strong>of</strong> <strong>the</strong>ir tra<strong>in</strong><strong>in</strong>g programs. Based on biennial survey results<br />
from 2000 to 2010, this study exam<strong>in</strong>es changes <strong>in</strong> <strong>the</strong> f<strong>in</strong>ances<br />
<strong>of</strong> residency tra<strong>in</strong><strong>in</strong>g over a decade us<strong>in</strong>g a standardized methodology.<br />
METHODS: Data were systematically collected by standardized<br />
questionnaire, evaluated for quality and verified, and <strong>the</strong>n analyzed.<br />
RESULTS: The per-resident expense <strong>of</strong> residency education for<br />
<strong>the</strong>se programs <strong>in</strong>creased an average <strong>of</strong> 63%, and overall residency<br />
revenues <strong>in</strong>creased 75%. GME fund<strong>in</strong>g per resident <strong>in</strong>creased<br />
47% but decreased as proportionate contribution to overall program<br />
revenue.<br />
CONCLUSIONS: The mean cost per resident rema<strong>in</strong>ed relatively<br />
stable over <strong>the</strong> 10-<strong>year</strong> period, with a 3.1% overall <strong>in</strong>crease<br />
to $27,260 per resident per <strong>year</strong>. Programs that successfully obta<strong>in</strong>ed<br />
federally qualified health center (FQHC) status, <strong>in</strong>creased<br />
<strong>the</strong>ir residency graduate medical education (GME) slots or received<br />
o<strong>the</strong>r new significant fund<strong>in</strong>g, such as state grants, were <strong>the</strong> most<br />
f<strong>in</strong>ancially stable. Policy solutions would stabilize both federal GME<br />
and state Medicaid GME fund<strong>in</strong>g and <strong>in</strong>crease reimbursement <strong>of</strong><br />
primary care practice to ma<strong>in</strong>ta<strong>in</strong> <strong>the</strong> viability <strong>of</strong> primary care<br />
tra<strong>in</strong><strong>in</strong>g programs.<br />
(Fam Med 2011;43(8):543-50.)<br />
Medical education f<strong>in</strong>anc<strong>in</strong>g,<br />
an ongo<strong>in</strong>g health policy<br />
focus, has garnered <strong>in</strong>creased<br />
attention with <strong>the</strong> passage<br />
<strong>of</strong> <strong>the</strong> Patient Protection and Affordable<br />
Care Act (ACA). 1 This health<br />
reform law legislated primary care<br />
workforce evaluation and <strong>in</strong>creased<br />
tra<strong>in</strong><strong>in</strong>g <strong>of</strong> primary care physicians<br />
to expand patient access to needed<br />
health care. Provisions <strong>in</strong> <strong>the</strong> ACA<br />
reauthorized <strong>the</strong> Health Resources<br />
Services Adm<strong>in</strong>istration (HRSA) Title<br />
VII Primary Care Tra<strong>in</strong><strong>in</strong>g and<br />
Enhancement grant program, established<br />
Rural Physician Tra<strong>in</strong><strong>in</strong>g<br />
grants, created Primary Care Extension<br />
Centers, and formed a new<br />
residency f<strong>in</strong>anc<strong>in</strong>g pathway <strong>in</strong> <strong>the</strong><br />
Teach<strong>in</strong>g Health Center Graduate<br />
Medical Education program.<br />
These programs all require detailed<br />
knowledge <strong>of</strong> residency f<strong>in</strong>ances and<br />
graduate medical education (GME)<br />
fund<strong>in</strong>g to properly allocate resources.<br />
GME fund<strong>in</strong>g is predom<strong>in</strong>antly<br />
provided to hospitals by <strong>the</strong> Centers<br />
for Medicare and Medicaid Services<br />
(CMS) through direct per-resident<br />
fund<strong>in</strong>g (DME) and <strong>in</strong>direct fund<strong>in</strong>g<br />
(IME), and <strong>the</strong>n apportioned<br />
by hospitals to ambulatory tra<strong>in</strong><strong>in</strong>g<br />
sites. Policymakers, recogniz<strong>in</strong>g<br />
<strong>the</strong> importance <strong>of</strong> GME fund<strong>in</strong>g for<br />
<strong>the</strong> future primary care workforce, 2<br />
have reexam<strong>in</strong>ed this pathway <strong>of</strong><br />
fund<strong>in</strong>g. Many voices call<strong>in</strong>g for an<br />
outpatient-centered reform <strong>of</strong> GME<br />
(<strong>in</strong>clud<strong>in</strong>g <strong>the</strong> Council on Graduate<br />
Medical Education [COGME],<br />
<strong>the</strong> Medicare Payment and Advisory<br />
Commission (MedPAC), 3 and<br />
o<strong>the</strong>r health policy experts 4-7 ) have<br />
recommended <strong>the</strong> realignment <strong>of</strong><br />
GME f<strong>in</strong>anc<strong>in</strong>g with physician<br />
workforce goals, <strong>in</strong>clud<strong>in</strong>g more directed<br />
fund<strong>in</strong>g <strong>of</strong> outpatient tra<strong>in</strong><strong>in</strong>g.<br />
Although <strong>the</strong> Balanced Budget<br />
Amendment (BBA) <strong>of</strong> 1997—while<br />
capp<strong>in</strong>g residency slots—opened <strong>the</strong><br />
door for payment <strong>of</strong> DME funds directly<br />
to ambulatory tra<strong>in</strong><strong>in</strong>g sites,<br />
From <strong>the</strong> Department <strong>of</strong> <strong>Family</strong> Medic<strong>in</strong>e,<br />
University <strong>of</strong> Wash<strong>in</strong>gton.<br />
FAMILY MEDICINE VOL. 43, NO. 8 • SEPTEMBER 2011 543
ORIGINAL ARTICLES<br />
<strong>the</strong> exclusion <strong>of</strong> IME (<strong>the</strong> majority<br />
<strong>of</strong> GME fund<strong>in</strong>g) from this policy<br />
change effectively prohibited its<br />
adoption. 5<br />
F<strong>in</strong>ancial concerns have stressed<br />
primary care residency programs, especially<br />
family medic<strong>in</strong>e programs.<br />
F<strong>in</strong>ances significantly contributed<br />
to <strong>the</strong> closure <strong>of</strong> 27 family medic<strong>in</strong>e<br />
programs <strong>in</strong> one calendar <strong>year</strong>, 8<br />
prompt<strong>in</strong>g a call for improved and<br />
more efficient fund<strong>in</strong>g mechanisms.<br />
Detailed residency f<strong>in</strong>ancial costaccount<strong>in</strong>g<br />
<strong>in</strong>formation is limited<br />
and outdated, especially for primary<br />
care programs. Cost estimates <strong>of</strong> 1<br />
<strong>year</strong> <strong>of</strong> tra<strong>in</strong><strong>in</strong>g for one family medic<strong>in</strong>e<br />
resident (most prior to <strong>the</strong> <strong>year</strong><br />
2000) have ranged from $50,000 to<br />
more than $350,000. 9-14<br />
Although family medic<strong>in</strong>e department<br />
f<strong>in</strong>ances have been reported, 15<br />
family medic<strong>in</strong>e residency tra<strong>in</strong><strong>in</strong>g<br />
f<strong>in</strong>ances have been challeng<strong>in</strong>g<br />
to def<strong>in</strong>e and track for several reasons.<br />
Because GME fund<strong>in</strong>g predom<strong>in</strong>antly<br />
flows through hospitals<br />
to <strong>the</strong> ambulatory tra<strong>in</strong><strong>in</strong>g site, <strong>the</strong><br />
cost and cl<strong>in</strong>ical revenue streams are<br />
separated, which may obfuscate account<strong>in</strong>g.<br />
Cl<strong>in</strong>ical and educational<br />
revenues and expenses can be <strong>in</strong>tertw<strong>in</strong>ed<br />
<strong>in</strong> account<strong>in</strong>g systems, and<br />
<strong>in</strong>direct costs can be accounted for<br />
<strong>in</strong> many different ways. Additionally,<br />
<strong>the</strong> highly variable structures<br />
<strong>of</strong> programs make comparisons less<br />
reliable. The “true cost” <strong>of</strong> ambulatory<br />
residency tra<strong>in</strong><strong>in</strong>g, as required<br />
by funders and programs, is <strong>in</strong>deed<br />
difficult to quantify.<br />
In an effort to understand family<br />
medic<strong>in</strong>e residency costs over time<br />
despite <strong>the</strong>se challenges, <strong>the</strong> University<br />
<strong>of</strong> Wash<strong>in</strong>gton <strong>Family</strong> Medic<strong>in</strong>e<br />
Residency Network (UWFMRN) has<br />
conducted a f<strong>in</strong>ancial benchmark<strong>in</strong>g<br />
survey biennially from 2000 through<br />
2010 <strong>of</strong> all family medic<strong>in</strong>e residencies<br />
<strong>in</strong> <strong>the</strong> five-state region compris<strong>in</strong>g<br />
Wash<strong>in</strong>gton, Wyom<strong>in</strong>g, Alaska,<br />
Montana, and Idaho (WWAMI).<br />
Fourteen residencies <strong>in</strong> 2000 completed<br />
<strong>the</strong> survey, <strong>in</strong>creas<strong>in</strong>g to 18<br />
by 2010. This report is an update to<br />
<strong>the</strong> previous two analyses <strong>of</strong> <strong>the</strong>se<br />
benchmark<strong>in</strong>g results 16,17 and summarizes<br />
10-<strong>year</strong> changes <strong>in</strong> family<br />
medic<strong>in</strong>e residency patient revenue,<br />
GME support, <strong>in</strong>surance payor mix,<br />
residency expenses, and average perresident<br />
net cost.<br />
Methods<br />
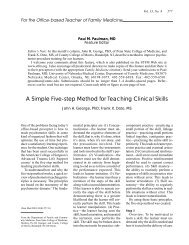
The UWFMRN is composed <strong>of</strong> 18<br />
<strong>in</strong>dependently operated programs<br />
<strong>in</strong> <strong>the</strong> WWAMI states that are connected<br />
through an affiliation with<br />
<strong>the</strong> University <strong>of</strong> Wash<strong>in</strong>gton. The<br />
WWAMI Network <strong>of</strong> residencies is<br />
comprised <strong>of</strong> two university-based<br />
programs, 11 programs sponsored<br />
by community hospitals, three programs<br />
that are self-sponsored, and<br />
two uniformed services programs<br />
(Table 1). Only two civilian programs<br />
have o<strong>the</strong>r residency programs sponsored<br />
at <strong>the</strong>ir <strong>in</strong>stitutions, although<br />
<strong>in</strong>dividual residents from o<strong>the</strong>r programs<br />
may rotate electively at o<strong>the</strong>r<br />
<strong>in</strong>stitutions. Medical students<br />
rotate <strong>in</strong> family medic<strong>in</strong>e (as well<br />
as some o<strong>the</strong>r specialties) at all<br />
<strong>of</strong> <strong>the</strong> programs. The programs <strong>in</strong><br />
2010 housed an average <strong>of</strong> 23.0 residents<br />
(range 15–34, an <strong>in</strong>crease <strong>of</strong><br />
5.1% from 2000, with eight residencies<br />
<strong>in</strong>creas<strong>in</strong>g <strong>the</strong>ir resident complement),<br />
and 10.8 faculty (range<br />
6-19.7, a 21% <strong>in</strong>crease from 2000).<br />
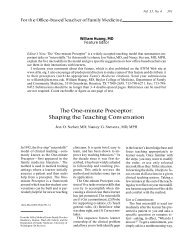
Six programs have added satellite<br />
sites or rural tra<strong>in</strong><strong>in</strong>g tracks <strong>in</strong> addition<br />
to <strong>the</strong> core program, and three<br />
have closed such sites dur<strong>in</strong>g this period.<br />
The ma<strong>in</strong> family practice center<br />
(FPC) was an FQHC <strong>in</strong> five programs<br />
<strong>in</strong> 2010, <strong>in</strong>creased from two<br />
<strong>in</strong> 2000, and an additional two programs<br />
had satellite residency cl<strong>in</strong>ics<br />
<strong>in</strong> FQHC sett<strong>in</strong>gs.<br />
The survey <strong>in</strong>strument was developed<br />
<strong>in</strong> collaboration with program<br />
directors and adm<strong>in</strong>istrators,<br />
and <strong>the</strong> same <strong>in</strong>strument was used<br />
for all five data sets. Emphasis was<br />
placed on understand<strong>in</strong>g data elements<br />
and def<strong>in</strong>itions to achieve<br />
as much <strong>in</strong>put uniformity as possible<br />
for comparison purposes. The<br />
current program adm<strong>in</strong>istrators at<br />
each site completed surveys; all but<br />
one site had at least one change <strong>in</strong><br />
adm<strong>in</strong>istrator over <strong>the</strong> 10 <strong>year</strong>s <strong>of</strong><br />
<strong>the</strong> survey, and new adm<strong>in</strong>istrators<br />
were oriented to <strong>the</strong> survey prior to<br />
first completion. Data were received<br />
at <strong>the</strong> central UWFMRN <strong>of</strong>fice, and<br />
a team <strong>of</strong> an adm<strong>in</strong>istrative assistant<br />
and two physician project managers<br />
exam<strong>in</strong>ed and analyzed <strong>the</strong><br />
data for completeness and <strong>in</strong>ternal<br />
consistency. Data discrepancies and<br />
miss<strong>in</strong>g data were brought back to<br />
<strong>in</strong>dividual programs for clarification.<br />
Standardized spreadsheets <strong>of</strong> data<br />
for each <strong>of</strong> <strong>the</strong> five data sets for all<br />
programs were created. Each data<br />
set was analyzed us<strong>in</strong>g <strong>the</strong> same approach.<br />
The analysis was done both<br />
by exam<strong>in</strong><strong>in</strong>g trends with<strong>in</strong> each<br />
program over <strong>the</strong> 10 <strong>year</strong>s and compar<strong>in</strong>g<br />
those trends and by exam<strong>in</strong><strong>in</strong>g<br />
trends <strong>in</strong> program averages over<br />
<strong>the</strong> 10 <strong>year</strong>s. This study was exempted<br />
from review by <strong>the</strong> University <strong>of</strong><br />
Wash<strong>in</strong>gton Institutional Review<br />
Board (IRB).<br />
Results<br />
All data reported “per resident” are<br />
calculated per full-time equivalent<br />
(FTE) residents, as program actual<br />
resident numbers fluctuated with<br />
part-time residents.<br />
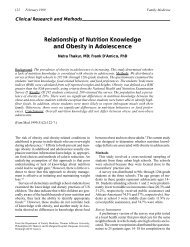
GME Revenue<br />
All 12 programs reported GME revenue<br />
for each <strong>of</strong> <strong>the</strong> 5 <strong>year</strong>s. Table 2<br />
presents <strong>the</strong> aggregate GME figures<br />
for <strong>the</strong> 12 programs, report<strong>in</strong>g GME/<br />
actual resident FTE <strong>in</strong> <strong>the</strong> program.<br />
Medicaid GME was excluded from<br />
this table and is discussed <strong>in</strong> <strong>the</strong> follow<strong>in</strong>g<br />
section. DME as a percentage<br />
<strong>of</strong> total GME (IME+DME) is reported<br />
for <strong>the</strong> 10 programs able to separately<br />
list those contributions. Only<br />
three programs <strong>in</strong>dicated that <strong>the</strong><br />
GME revenues received by <strong>the</strong> <strong>in</strong>stitutions<br />
were directly allocated back<br />
to <strong>the</strong> program’s budget. Of note, all<br />
programs reported <strong>in</strong>creas<strong>in</strong>g GME/<br />
resident over <strong>the</strong> 10 <strong>year</strong>s but with<br />
a progressive decrease <strong>of</strong> DME relative<br />
to total GME contributions. The<br />
programs with <strong>the</strong> greatest GME <strong>in</strong>crease<br />
were those programs able to<br />
<strong>in</strong>crease <strong>the</strong>ir resident GME caps,<br />
544 SEPTEMBER 2011 • VOL. 43, NO. 8 FAMILY MEDICINE
ei<strong>the</strong>r through reallocation from<br />
o<strong>the</strong>r residency programs that decreased<br />
<strong>in</strong> size at <strong>the</strong>ir <strong>in</strong>stitution<br />
(two programs) or through an <strong>in</strong>crease<br />
with recent reallocations by<br />
CMS (three programs).<br />
For <strong>year</strong>s 2006–2010, 10 <strong>of</strong> <strong>the</strong><br />
12 programs or <strong>the</strong>ir sponsor<strong>in</strong>g <strong>in</strong>stitutions<br />
were “over cap”: <strong>the</strong> currently<br />
approved residency size and<br />
current FTEs were greater than <strong>the</strong><br />
DME cap as allotted by federal GME<br />
calculations <strong>in</strong> <strong>the</strong> 1996 base <strong>year</strong>;<br />
n<strong>in</strong>e <strong>of</strong> <strong>the</strong>se 10 are s<strong>in</strong>gle-residency<br />
programs. The GME figures are<br />
from <strong>the</strong> programs’ pre-cost report<strong>in</strong>g<br />
for comparison across <strong>the</strong> <strong>year</strong>s<br />
ra<strong>the</strong>r than from actual GME cost<br />
reports, which are not yet available<br />
for recent <strong>year</strong>s. Additionally, some<br />
programs are contest<strong>in</strong>g CMS determ<strong>in</strong>ations<br />
<strong>of</strong> prior cost reports. Because<br />
programs were on average five<br />
residents over cap, <strong>the</strong> actual GME/<br />
FTE resident <strong>in</strong> 2010 was 23.2% less<br />
than <strong>the</strong> GME/DME resident cap.<br />
Medicaid GME Revenue<br />
Medicaid GME revenue was highly<br />
variable and subject to report<strong>in</strong>g errors<br />
and was <strong>the</strong>refore not <strong>in</strong>cluded<br />
<strong>in</strong> <strong>the</strong> GME program totals but is<br />
none<strong>the</strong>less critical to f<strong>in</strong>ancial considerations<br />
for GME tra<strong>in</strong><strong>in</strong>g. Second<br />
to Medicare, Medicaid is <strong>the</strong><br />
largest explicit payer <strong>of</strong> GME; unlike<br />
Medicare, state Medicaid programs<br />
have no statutory requirement to<br />
support GME. 18 Medicaid GME, because<br />
it is a state payment, has been<br />
vulnerable to state budgets; whe<strong>the</strong>r<br />
states have participated <strong>in</strong> support<strong>in</strong>g<br />
Medicaid GME, whe<strong>the</strong>r DME<br />
and/or IME was <strong>in</strong>cluded, and <strong>the</strong><br />
methodology used to determ<strong>in</strong>e <strong>the</strong><br />
level <strong>of</strong> support has varied significantly<br />
over time. As <strong>of</strong> 2009, <strong>the</strong>re<br />
has been a significant decl<strong>in</strong>e <strong>in</strong> <strong>the</strong><br />
number <strong>of</strong> states provid<strong>in</strong>g Medicaid<br />
GME, with five states ceas<strong>in</strong>g <strong>the</strong>se<br />
payments, and n<strong>in</strong>e states consider<strong>in</strong>g<br />
withdrawal <strong>of</strong> fund<strong>in</strong>g. 19<br />
In <strong>the</strong> WWAMI region, <strong>the</strong> number<br />
<strong>of</strong> states contribut<strong>in</strong>g Medicaid<br />
GME support has varied over<br />
this 10-<strong>year</strong> period, with only two<br />
<strong>of</strong> five states contribut<strong>in</strong>g <strong>in</strong> 2000,<br />
State<br />
County<br />
Population<br />
Size, 2009*<br />
<strong>in</strong>creas<strong>in</strong>g to four <strong>of</strong> five <strong>in</strong> 2006–<br />
2008, and recently decreas<strong>in</strong>g to<br />
three <strong>of</strong> five states s<strong>in</strong>ce 2008. Additionally,<br />
programs have significant<br />
difficulty obta<strong>in</strong><strong>in</strong>g <strong>in</strong>formation<br />
about <strong>the</strong>se payments, and all report<br />
that <strong>the</strong>se monies are not directly<br />
attributed to <strong>the</strong> program by <strong>the</strong><br />
sponsor<strong>in</strong>g <strong>in</strong>stitution. Therefore,<br />
<strong>the</strong>se monies were not <strong>in</strong>cluded <strong>in</strong><br />
this analysis <strong>of</strong> program f<strong>in</strong>anc<strong>in</strong>g.<br />
However, <strong>the</strong> amount provided by<br />
<strong>the</strong> six programs able to report it<br />
varied from $117,000 to $1,820,000,<br />
averag<strong>in</strong>g $812,000 with a median<br />
<strong>of</strong> $648,000.<br />
Cl<strong>in</strong>ical Revenue and Payor Mix<br />
Cl<strong>in</strong>ical revenue historically has<br />
comprised about half <strong>of</strong> total program<br />
revenues 16,17 and is <strong>the</strong>refore<br />
Table 1: UWFMN Program Structures<br />
Sett<strong>in</strong>g<br />
(University/<br />
Community)<br />
ORIGINAL ARTICLES<br />
Total Resident FTE<br />
(% Change From<br />
2000 to 2010)<br />
Total Faculty FTE<br />
(% Change From<br />
2000 to 2010)<br />
AK 286,174 Community 34.0 (+42%) 10.1 (9%)<br />
ID 384,656 Community 32.0 (+14%) 19.7 (4%)<br />
WA 240,862 Military n/r n/r<br />
WY 74,508 Community 21.0 (+5%) 2.0 (n/a)<br />
WA 1,916,441 Community 29.0 (-6.5%) 8.3 (-12%)<br />
WY 88,854 Community 19.0 (+5.6%) 15.0 (n/a)<br />
WA 1,916,441 Community 32.0 (+7%) 15.3 (50%)<br />
WA 1,916,441 Community 15.0 (0%) 3.4 (-59%)<br />
ID 82,539 University 18.0 (+38%) 9.6 (+42.9%)<br />
WA 796,836 Military n/r n/r<br />
MT 144,797 Community 18.0 (0%) 6.0 (2%)<br />
WA 250,979 Community 18.0 (0%) 9.8 (5%)<br />
WA 468,684 Community 21.0 (-22%) 11.2 (53%)<br />
WA 796,836 Community 24.0 (0%) 13.4 (46%)<br />
WA 1,916,441 University 24.0 (0%) 9.2 (1%)<br />
WA 1,916,441 Community 24.0 (0%) 11.4 (3%)<br />
WA 432,002 Community 20.0 (+6.4%) 16.0 (90.5%)<br />
WA 239,054 Community 19.0 (+11.8%) 11.1 (22%)<br />
Average, exclud<strong>in</strong>g military (n=16) 23.0 (5.1%) 10.3 (21%)<br />
UWFMN—University <strong>of</strong> Wash<strong>in</strong>gton <strong>Family</strong> Medic<strong>in</strong>e Network<br />
FTE—full-time equivalent<br />
n/r—not recorded<br />
* US Census Bureau<br />
an important track<strong>in</strong>g measure.<br />
Cl<strong>in</strong>ical revenues for <strong>the</strong>se programs<br />
<strong>in</strong>cluded bill<strong>in</strong>gs from outpatient<br />
family medic<strong>in</strong>e center visits, <strong>in</strong>patient<br />
visits, and visits at o<strong>the</strong>r sites<br />
such as nurs<strong>in</strong>g homes and emergency<br />
rooms; only three programs<br />
reported direct revenues from ancillaries<br />
and for all three <strong>the</strong> amount<br />
was less than 2% <strong>of</strong> total revenues.<br />
Detailed description <strong>of</strong> <strong>the</strong> cl<strong>in</strong>ical<br />
practices are reported <strong>in</strong> a separate<br />
paper, <strong>in</strong>clud<strong>in</strong>g volumes <strong>of</strong> patients,<br />
both <strong>in</strong>patient and outpatient, and<br />
<strong>the</strong> implementation <strong>of</strong> electronic<br />
health records and Patient-centered<br />
Medical Home efforts.<br />
Total gross cl<strong>in</strong>ical revenue for<br />
<strong>the</strong> 12 programs <strong>in</strong>creased 112.6%<br />
over <strong>the</strong> 10 <strong>year</strong>s, with a net cl<strong>in</strong>ical<br />
revenue <strong>in</strong>crease <strong>of</strong> 58.9%; dur<strong>in</strong>g<br />
FAMILY MEDICINE VOL. 43, NO. 8 • SEPTEMBER 2011 545
State<br />
ORIGINAL ARTICLES<br />
# <strong>of</strong> O<strong>the</strong>r<br />
Residencies<br />
<strong>in</strong> Sponsor<br />
this time <strong>the</strong>re was only an 11.9%<br />
<strong>in</strong>crease <strong>in</strong> associated cl<strong>in</strong>ical volumes.<br />
Outpatient revenue was <strong>the</strong><br />
largest source <strong>of</strong> cl<strong>in</strong>ical revenue and<br />
was stable as a percentage <strong>of</strong> total<br />
patient revenue across <strong>the</strong> decade,<br />
at 87% <strong>in</strong> 2003 and 85.2% <strong>in</strong> 2010.<br />
Programs <strong>in</strong>creased gross bill<strong>in</strong>g per<br />
visit an average <strong>of</strong> 94% while reported<br />
net collections per visit <strong>in</strong>creased<br />
only 44% over <strong>the</strong> decade (charges<br />
<strong>in</strong>creased more than payment), <strong>in</strong>dicat<strong>in</strong>g<br />
larger write-<strong>of</strong>fs.<br />
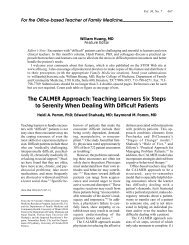
Changes <strong>in</strong> patient payor mix<br />
potentially could affect <strong>the</strong> overall<br />
revenue from patient care. Table 3<br />
summarizes aggregate payor <strong>in</strong>formation<br />
for each <strong>of</strong> <strong>the</strong> five data sets.<br />
Table 1a: UWFMN Program Structures<br />
Satellite<br />
# <strong>of</strong><br />
Residents/<br />
Year RTT, Fellowships<br />
AK 0 No No<br />
ID 0 no RTT, 2<br />
fellowships<br />
WA n/r n/a n/a<br />
Ma<strong>in</strong> FPC Is FQHC<br />
or Look-alike,<br />
*=Satellite <strong>in</strong> FQHC<br />
Yes (New 2010)<br />
WY 0 No No Yes<br />
WA 1 6 No *<br />
WY 0 No No Yes<br />
WA 0 5 2 fellowships *<br />
WA 0 No No<br />
ID 0 No No<br />
WA n/r n/a n/a<br />
MT 0 No No Yes<br />
WA 0 No No<br />
WA 0 No RTT, 1 fellowship<br />
WA 0 No 1 fellowship<br />
WA >6 2 1 fellowship<br />
WA 0 No No<br />
WA 0 No No<br />
WA 0 No No Yes<br />
UWFMN—University <strong>of</strong> Wash<strong>in</strong>gton <strong>Family</strong> Medic<strong>in</strong>e Network<br />
RTT—rural tra<strong>in</strong><strong>in</strong>g track<br />
FPC—family practice center<br />
FQHC—federally qualified health center<br />
n/r—not recorded, n/a—not applicable<br />
A few programs reported specific<br />
capitation contracts for only one <strong>of</strong><br />
<strong>the</strong> <strong>year</strong>s; this category was <strong>in</strong>sufficiently<br />
answered to report separately.<br />
While <strong>the</strong> <strong>in</strong>ter-program variation<br />
<strong>in</strong> patient payor pr<strong>of</strong>iles was high,<br />
few dramatic aggregate payor changes<br />
were noted over 10 <strong>year</strong>s. Notably,<br />
<strong>the</strong> average un<strong>in</strong>sured patient visits<br />
rose from 8% <strong>of</strong> visits to 12% <strong>of</strong> visits<br />
primarily due to <strong>the</strong> conversion<br />
<strong>of</strong> three programs to FQHC status.<br />
O<strong>the</strong>r Revenue<br />
Additional sources <strong>of</strong> program revenues<br />
<strong>in</strong>cluded state fund<strong>in</strong>g, <strong>in</strong>clud<strong>in</strong>g<br />
both long-term l<strong>in</strong>e items and<br />
specific time-limited allocations;<br />
grants from o<strong>the</strong>r sources, <strong>in</strong>clud<strong>in</strong>g<br />
Health Resource Service Adm<strong>in</strong>istration<br />
grants, research grants, or o<strong>the</strong>r<br />
grants such as from <strong>in</strong>stitutional or<br />
o<strong>the</strong>r foundations; and community<br />
health center grants for support <strong>of</strong><br />
patient care. Medical student education<br />
through residency programs<br />
is not directly paid for by <strong>the</strong> University<br />
<strong>of</strong> Wash<strong>in</strong>gton, so does not<br />
contribute to revenues. The largest<br />
percentage <strong>in</strong>creases <strong>in</strong> overall<br />
revenues were <strong>in</strong> this “o<strong>the</strong>r” category,<br />
where <strong>the</strong> median program<br />
<strong>in</strong>creased 148%; this primarily resulted<br />
from three programs with<br />
grants associated with a change to<br />
an FQHC structure to <strong>the</strong> program,<br />
or large state grants to support primary<br />
care education <strong>in</strong> <strong>the</strong> state.<br />
Total Revenue<br />
Table 4 summarizes <strong>the</strong> changes<br />
<strong>in</strong> total revenue, exclud<strong>in</strong>g Medicaid<br />
GME, as well as total federal GME,<br />
net patient care revenue, and o<strong>the</strong>r<br />
revenue. Due to <strong>the</strong> extreme variability<br />
related to “o<strong>the</strong>r” revenue<br />
described above, only <strong>the</strong> medians<br />
are presented for that category. Total<br />
mean revenue, exclud<strong>in</strong>g Medicaid<br />
GME, <strong>in</strong>creased 59.3% from<br />
2000–2010.<br />
Expenses<br />
Expenses have traditionally been<br />
<strong>the</strong> most difficult element to analyze<br />
<strong>in</strong> tra<strong>in</strong><strong>in</strong>g program f<strong>in</strong>ances.<br />
Because <strong>of</strong> <strong>in</strong>dividualized contractual<br />
relationships between academic<br />
<strong>in</strong>stitutions and cl<strong>in</strong>ic sites, each<br />
program may have reported <strong>in</strong>direct<br />
costs, build<strong>in</strong>g and ma<strong>in</strong>tenance<br />
costs, and operational expenses differently,<br />
and even with<strong>in</strong> programs,<br />
expense report<strong>in</strong>g varied from <strong>year</strong><br />
to <strong>year</strong>. Indirect costs consisted <strong>of</strong><br />
those program costs not directly allocated<br />
to <strong>the</strong> program but paid by<br />
<strong>the</strong> <strong>in</strong>stitutional sponsor; <strong>the</strong>se varied<br />
from build<strong>in</strong>g and ma<strong>in</strong>tenance<br />
costs to human resources, <strong>in</strong>formation<br />
technology, bill<strong>in</strong>g, and o<strong>the</strong>r operations<br />
costs. On <strong>the</strong> o<strong>the</strong>r hand,<br />
programs more easily reported compensation<br />
expenses. Table 5 summarizes<br />
<strong>the</strong> aggregate measures for<br />
546 SEPTEMBER 2011 • VOL. 43, NO. 8 FAMILY MEDICINE
Year<br />
ORIGINAL ARTICLES<br />
Table 2: Total GME Program Revenues, Not Includ<strong>in</strong>g Medicaid GME, 2000 to 2010<br />
Mean # FTE<br />
Residents Over<br />
DME Cap GME/Program Resident FTE<br />
Mean Median Range<br />
DME as a<br />
Percentage<br />
<strong>of</strong> GME<br />
2000 $76,898 $74,439 $45,074–$127,507 37.6<br />
2003 $90,586 $89,154 $38,366–$175,061 35.0<br />
2006 4.3 $98,414 $95,277 $43,571–$176,923 31.7<br />
2008 5.3 $106,721 $116,791 $41,944–$177,878 31.1<br />
2010 5.4 $112,739 $112,354 $52,778–$197,118 27.9<br />
Change 2000–<br />
2010<br />
n=12 programs<br />
FTE—full-time equivalent<br />
“GME”=IME + DME<br />
IME—<strong>in</strong>direct fund<strong>in</strong>g, DME—direct fund<strong>in</strong>g<br />
% Medicare FFS<br />
(mean, range)<br />
% Medicaid FFS<br />
(mean, range)<br />
% self-pay or<br />
un<strong>in</strong>sured (mean,<br />
range)<br />
% commercial FFS<br />
(mean, range)<br />
46.6% 50.9%<br />
Table 3: Average Payor Mix <strong>of</strong> FPC Patients, 2000 to 2010<br />
2000 2003 2006 2008 2010<br />
16.8%<br />
(9%–30.8%)<br />
24.5%<br />
(14%–50%)<br />
8%<br />
(3%–17%)<br />
30%<br />
(14.9%–55%)<br />
16.9%<br />
(6%–38%)<br />
28%<br />
(5%–47%)<br />
7%<br />
(3%–24%)<br />
28.2%<br />
(12.6%–58%)<br />
18.6%<br />
(5%–36%)<br />
27.6%<br />
(3%–46%)<br />
11%<br />
(2%–63%)<br />
30%<br />
(11%–64%)<br />
18.7%<br />
(4%–40.8%)<br />
25.8%<br />
(7%–54%)<br />
11%<br />
(1%–59%)<br />
29%<br />
(14%–63%)<br />
16.2%<br />
(3.2%–32.4%)<br />
22.5%<br />
(3%–45.5%)<br />
12%<br />
(1%–51%)<br />
26.2%<br />
(10%–52%)<br />
Note: Mean values reported, total % does not add to 100% because less common types <strong>of</strong> reimbursement were excluded, n=12<br />
programs.<br />
FFS—fee for service<br />
total expenses and <strong>the</strong> largest categories<br />
<strong>of</strong> def<strong>in</strong>ed expenses.<br />
Average total compensation <strong>in</strong>creased<br />
by 80.1%, result<strong>in</strong>g from<br />
both a 26.5% <strong>in</strong>crease <strong>of</strong> total employees<br />
on payroll and <strong>in</strong>creased<br />
salary per FTE, averag<strong>in</strong>g 29.1%<br />
for staff and 41.9% for faculty. By<br />
comparison, average total compensation<br />
for family medic<strong>in</strong>e faculty<br />
nationally <strong>in</strong>creased an average<br />
<strong>of</strong> 21.7% dur<strong>in</strong>g this period; western<br />
region faculty salaries have rema<strong>in</strong>ed<br />
at 97% <strong>of</strong> national averages<br />
throughout this period. 20 Compensation<br />
rema<strong>in</strong>ed <strong>the</strong> most significant<br />
part <strong>of</strong> overall expenses at 73.2% <strong>in</strong><br />
2010, relatively stable over all five<br />
data sets. In contrast, FPC and program<br />
operations expenses <strong>in</strong>creased<br />
68.9%, while build<strong>in</strong>g and ma<strong>in</strong>tenance<br />
expenses only <strong>in</strong>creased on average<br />
36.2%, and <strong>in</strong>direct expenses<br />
decreased 68.6%. This change <strong>in</strong> expenses<br />
<strong>in</strong>dicated a shift <strong>of</strong> allocation<br />
for several programs from <strong>in</strong>direct to<br />
direct expense report<strong>in</strong>g.<br />
Average total expenses <strong>in</strong>creased<br />
79.6% over <strong>the</strong> 10 <strong>year</strong>s.<br />
Malpractice<br />
Malpractice expense <strong>in</strong>creased significantly<br />
for many programs dur<strong>in</strong>g<br />
<strong>the</strong>se <strong>year</strong>s. The greatest impact<br />
was <strong>the</strong> dissolution after 2000 <strong>of</strong><br />
<strong>the</strong> Network’s self-<strong>in</strong>sured system,<br />
which had previously provided malpractice<br />
<strong>in</strong>surance for all Network<br />
programs. Subsequently, <strong>in</strong>dividual<br />
programs were forced to f<strong>in</strong>d malpractice<br />
<strong>in</strong>surance through o<strong>the</strong>r<br />
sources. These sources <strong>in</strong>cluded<br />
self-<strong>in</strong>surance through <strong>the</strong>ir own<br />
sponsor<strong>in</strong>g <strong>in</strong>stitutions, federal tort<br />
claims act, or purchase by programs<br />
through regional brokers that varied<br />
by state. The n<strong>in</strong>e programs with a<br />
reported malpractice expense reported<br />
a median <strong>in</strong>crease from $183,542<br />
to $266,360 (2006–2010), a 45% <strong>in</strong>crease,<br />
but <strong>the</strong> amounts paid by <strong>the</strong><br />
programs varied from $0 for self-<strong>in</strong>sured<br />
systems to more than $1 million<br />
for one program purchas<strong>in</strong>g<br />
FAMILY MEDICINE VOL. 43, NO. 8 • SEPTEMBER 2011 547
ORIGINAL ARTICLES<br />
Table 4: Total and GME Revenues, Not Includ<strong>in</strong>g<br />
Medicaid GME, 2000 to 2010<br />
<strong>in</strong>surance <strong>in</strong>dependently. Because<br />
<strong>of</strong> <strong>the</strong> extreme variability <strong>of</strong> <strong>the</strong>se<br />
amounts, malpractice expenses have<br />
not been <strong>in</strong>cluded <strong>in</strong> any data analysis.<br />
Cost Per Resident<br />
We def<strong>in</strong>ed <strong>the</strong> cost per resident by<br />
us<strong>in</strong>g <strong>the</strong> follow<strong>in</strong>g def<strong>in</strong>itions:<br />
• “Revenue per resident exclud<strong>in</strong>g<br />
Medicaid GME.” Medicaid GME was<br />
excluded as discussed above.<br />
• “Expense per resident exclud<strong>in</strong>g<br />
malpractice.” Malpractice costs were<br />
also excluded as discussed above.<br />
Us<strong>in</strong>g <strong>the</strong>se def<strong>in</strong>itions, Table 6<br />
shows <strong>the</strong> mean and median expense<br />
and revenue per resident for <strong>the</strong> five<br />
data sets, as well as <strong>the</strong> range <strong>of</strong> values<br />
among <strong>the</strong> 12 programs. Table<br />
7 shows <strong>the</strong> mean and median cost<br />
per resident (total expense exclud<strong>in</strong>g<br />
malpractice, m<strong>in</strong>us total revenue<br />
exclud<strong>in</strong>g Medicaid GME) as well as<br />
Total Revenue GME Revenue<br />
Absolute Absolute % <strong>of</strong> Total<br />
2000 $4,484,927 $1,825,930 45.4<br />
2003 $5,271,301 $2,315,378 46.9<br />
2006 $6,312,699 $2,279,298 41.8<br />
2008 $6,877,503 $2,590,514 40.5<br />
2010 $7,145,231 $2,683,188 41.8<br />
Change 2000–<br />
2010<br />
Note: mean values<br />
n=12 programs<br />
59.3% 46.9%<br />
Table 4a: Net Patient Care and O<strong>the</strong>r Revenues, 2000 to 2010<br />
Net Patient Care Revenue O<strong>the</strong>r Revenue<br />
Absolute % <strong>of</strong> Total Absolute % <strong>of</strong> Total<br />
2000 $1,918,788 47.7 $275,119 6.1<br />
2003 $2,155,616 43.7 $462,400 9.4<br />
2006 $2,595,010 47.6 $576,629 10.6<br />
2008 $3,211,892 50.2 $590,613 9.2<br />
2010 $3,048,738 47.5 $681,854 10.6<br />
Change<br />
2000–<br />
2010<br />
58.9% 147.8%<br />
Note: mean values reported except for “o<strong>the</strong>r revenue,” where median values are reported.<br />
n=12 programs<br />
<strong>the</strong> range <strong>of</strong> values among <strong>the</strong> 12<br />
programs.<br />
Of note, <strong>the</strong> cost per resident rema<strong>in</strong>ed<br />
relatively stable over <strong>the</strong><br />
10-<strong>year</strong> period, with a 3.1% overall<br />
<strong>in</strong>crease to an average <strong>of</strong> $27,260/<br />
resident/<strong>year</strong> although <strong>the</strong> median<br />
decreased 30.1% to $18,310. The<br />
extremely wide range <strong>of</strong> values <strong>in</strong>creased<br />
<strong>in</strong> spread over <strong>the</strong> 10 <strong>year</strong>s.<br />
Three Network programs rported <strong>in</strong><br />
2010 that rvenue per resident exceeded<br />
expense per resident; two <strong>of</strong><br />
<strong>the</strong>se programs convrted dur<strong>in</strong>g this<br />
decade from residency-based cl<strong>in</strong>ics<br />
to FQHC status with enhanced reimbursements<br />
and grants, and <strong>the</strong><br />
o<strong>the</strong>r program successfully captured<br />
additional GME slots so that <strong>the</strong>y<br />
rema<strong>in</strong>ed at or below <strong>the</strong> resident<br />
GME cap as <strong>the</strong>y expanded <strong>the</strong>ir<br />
program. The most expensive programs<br />
experienced a large shift <strong>in</strong><br />
costs from <strong>in</strong>direct to direct expense<br />
account<strong>in</strong>g by <strong>the</strong> sponsor<strong>in</strong>g <strong>in</strong>stitution.<br />
Satellite Programs: Cost<br />
Implications<br />
Five programs <strong>in</strong> 2010 reported <strong>the</strong><br />
existence <strong>of</strong> satellite residency sites,<br />
and four provided some additional<br />
<strong>in</strong>formation. Three <strong>of</strong> those four<br />
could not separate <strong>the</strong> direct expenses<br />
with regard to <strong>the</strong> satellite site;<br />
one paid a contract fee directly to <strong>the</strong><br />
satellite site. Patient revenues from<br />
satellite sites were not <strong>in</strong>cluded <strong>in</strong><br />
program revenues. Because <strong>of</strong> <strong>in</strong>complete<br />
<strong>in</strong>formation, <strong>the</strong>se sites could<br />
not be <strong>in</strong>dependently analyzed.<br />
Discussion<br />
The UWFMRN f<strong>in</strong>ancial benchmark<strong>in</strong>g<br />
data demonstrate <strong>the</strong> difficulties<br />
<strong>in</strong> creat<strong>in</strong>g f<strong>in</strong>ancial account<strong>in</strong>g models<br />
for residency education, due to<br />
<strong>the</strong> disparate methods <strong>of</strong> report<strong>in</strong>g<br />
and hidden f<strong>in</strong>ancial relationships<br />
<strong>of</strong> programs. However, this detailed<br />
survey does clarify certa<strong>in</strong> trends <strong>of</strong><br />
WWAMI family medic<strong>in</strong>e residencies,<br />
and <strong>the</strong> consistency <strong>in</strong> programs<br />
and methods over time add legitimacy<br />
to <strong>the</strong> f<strong>in</strong>d<strong>in</strong>gs. Viewed over 10<br />
<strong>year</strong>s, <strong>the</strong> average expense <strong>of</strong> residency<br />
education for <strong>the</strong>se programs<br />
<strong>in</strong>creased an average <strong>of</strong> 62.6%, to<br />
$338K per resident, compared with<br />
a 26.9% 21 <strong>in</strong>flation rate. Dur<strong>in</strong>g <strong>the</strong><br />
same time, overall residency revenue<br />
<strong>in</strong>creased an average <strong>of</strong> 74.7%.<br />
Although mean GME per resident<br />
fund<strong>in</strong>g was <strong>in</strong>-l<strong>in</strong>e with national allprogram<br />
per-resident GME amounts<br />
(approximately $100,000/resident <strong>in</strong><br />
2008), 22 GME fund<strong>in</strong>g among programs<br />
was highly variable; <strong>the</strong> ongo<strong>in</strong>g<br />
survival <strong>of</strong> <strong>the</strong> lowest-funded<br />
programs po<strong>in</strong>ts to <strong>the</strong> creative fund<strong>in</strong>g<br />
solutions <strong>of</strong>ten required by fiscal<br />
pressures. These WWAMI residencies<br />
cared for a vulnerable segment<br />
<strong>of</strong> <strong>the</strong> population, with greater than<br />
half <strong>of</strong> all patient care provided to<br />
publicly <strong>in</strong>sured or un<strong>in</strong>sured patients.<br />
Programs that were successful<br />
<strong>in</strong> obta<strong>in</strong><strong>in</strong>g FQHC status,<br />
<strong>in</strong>creas<strong>in</strong>g <strong>the</strong>ir residency GME<br />
slots, or obta<strong>in</strong><strong>in</strong>g o<strong>the</strong>r significant<br />
fund<strong>in</strong>g such as state grants were<br />
<strong>the</strong> most f<strong>in</strong>ancially stable.<br />
548 SEPTEMBER 2011 • VOL. 43, NO. 8 FAMILY MEDICINE
Table 5: Overall Expenses, Not Includ<strong>in</strong>g Malpractice Expense, 2000 to 2010<br />
ORIGINAL ARTICLES<br />
Total Expenses Total Compensation, All Employees FPC and Program Operations<br />
Absolute Absolute % <strong>of</strong> Total Absolute % <strong>of</strong> Total<br />
2000 $4,607,433 $3,360,543 72.9 $916,039 19.9<br />
2003 $4,468,257 $3,660,445 81.9 $1,326,500 29.7<br />
2006 $6,185,219 $4,641,969 75.0 $1,493,087 24.1<br />
2008 $6,647,816 $4,640,380 69.8 $1,291,641 19.4<br />
2010 $8,273,738 $6,052,753 73.2 $1,546,977 18.7<br />
Change 2000–<br />
2010<br />
79.6% 80.1% 68.9%<br />
Table 6: Expense Per Resident (Exclud<strong>in</strong>g Malpractice) and Revenue Per Resident (Excludng Medicaid GME)*<br />
Expense Per Resident Revenue Per Resident<br />
Mean Median Range Mean Median Range<br />
2000 $208,075 $205,410 $142,630–$275,540 $181,645 $183,335 $115,633–$240,433<br />
2003 $248,169 $262,723 $119,845–$333,461 $227,614 $221,846 $178,700–$310,242<br />
2006 $301,791 $288,343 $141,698–$676,326 $261,947 $246,588 $154,183–$363,796<br />
2008 $282,473 $246,382 $152,372–$510,522 $301,103 $231,988 $190,874–$361,180<br />
2010 $338,421 $306,703 $129,897–$652,234 $317,248 $279,433 $160,802–$501,754<br />
Change<br />
2000–<br />
2010<br />
62.6% 49.3% 74.7% 52.4%<br />
* Us<strong>in</strong>g actual number <strong>of</strong> reidents, and with exclusions as noted.<br />
n=12 programs<br />
Table 7: Cost Per Resident*<br />
Cost Per Resident<br />
Mean Median Range<br />
2000 $26,430 $26,198 ($39,572)–$77,684<br />
2003 $20,355 $20,304 ($105,234)–$149,236<br />
2006 $22,691 $20,073 ($44,965)–$482,654<br />
2008 $23,253 $27,242 ($227,793)–$302,341<br />
2010 $27,260 $18,310 ($167,413)–$410,676<br />
Change 2000–<br />
2010<br />
3.1% -30.1%<br />
* Us<strong>in</strong>g actual number <strong>of</strong> residents and with exclusions as noted.<br />
n=12 programs<br />
These f<strong>in</strong>ancial models also highlight<br />
<strong>the</strong> <strong>in</strong>herent difficulties <strong>in</strong><br />
quantify<strong>in</strong>g residency costs. One<br />
limitation <strong>of</strong> <strong>the</strong>se data—similar to<br />
o<strong>the</strong>r attempts to benchmark—is <strong>the</strong><br />
<strong>year</strong>-to-<strong>year</strong> variability <strong>in</strong> <strong>the</strong> data<br />
that could not be fully addressed<br />
despite all efforts to standardize<br />
<strong>the</strong> questionnaire and responses and<br />
to verify data, as well as <strong>the</strong> small<br />
sample size <strong>in</strong> number <strong>of</strong> programs<br />
that prohibits more sophisticated<br />
data analysis. More importantly, it<br />
is nearly impossible to separate out<br />
<strong>the</strong> true education costs from <strong>the</strong><br />
cl<strong>in</strong>ic operat<strong>in</strong>g costs. What policymakers<br />
<strong>in</strong>evitably want to know<br />
is: how much “extra” does it cost to<br />
place a resident <strong>in</strong> a family practice<br />
center? The direct costs (resident salary,<br />
faculty teach<strong>in</strong>g time, residency<br />
adm<strong>in</strong>istrators, and possibly malpractice)<br />
are easier to quantify, but<br />
<strong>the</strong> <strong>in</strong>direct expenses (cl<strong>in</strong>ic <strong>in</strong>efficiencies<br />
and physical plant costs) are<br />
nearly impossible to tease out. This<br />
analysis unfortunately was also not<br />
able to make that crucial step. Cost<br />
comparisons with o<strong>the</strong>r types <strong>of</strong> residency<br />
tra<strong>in</strong><strong>in</strong>g are difficult, due to<br />
variations <strong>in</strong> methods, but have suggested<br />
that primary care program<br />
costs are lower than surgery, radiology,<br />
emergency medic<strong>in</strong>e, anes<strong>the</strong>siology,<br />
and pathology, but <strong>in</strong>clude<br />
more adm<strong>in</strong>istrative costs. 23<br />
The f<strong>in</strong>ancial susta<strong>in</strong>ability <strong>of</strong><br />
family medic<strong>in</strong>e residency programs<br />
FAMILY MEDICINE VOL. 43, NO. 8 • SEPTEMBER 2011 549
ORIGINAL ARTICLES<br />
is <strong>in</strong> question, not only because <strong>of</strong><br />
threats to state and grant fund<strong>in</strong>g<br />
and <strong>the</strong> potential for decreased patient<br />
revenue, but due to threats<br />
to GME fund<strong>in</strong>g as well. Medicaid<br />
GME, not <strong>in</strong>cluded <strong>in</strong> this analysis,<br />
is critical for many programs and is<br />
threatened to an even greater degree<br />
as state budget crises <strong>in</strong>tensify.<br />
Indirect GME (IME), historically<br />
funded 2:1 compared to DME from<br />
CMS and an <strong>in</strong>creas<strong>in</strong>g proportion<br />
<strong>of</strong> <strong>the</strong> Network residency GME,<br />
is a tenuous fund<strong>in</strong>g stream. The<br />
Medicare Payment Advisory Commission<br />
(MedPAC) recently recommended<br />
cutt<strong>in</strong>g IME by 55%, 24<br />
and re-direct<strong>in</strong>g those funds to a<br />
residency accountability <strong>in</strong>centive<br />
program. IME pass-through to ambulatory<br />
programs (variable and<br />
somewhat discretionary depend<strong>in</strong>g<br />
on <strong>the</strong> agreement with <strong>the</strong> sponsor<strong>in</strong>g<br />
hospital) could shr<strong>in</strong>k. Ambulatory<br />
tra<strong>in</strong><strong>in</strong>g programs, called upon<br />
to prove <strong>the</strong>ir economic worth to <strong>the</strong><br />
sponsor<strong>in</strong>g <strong>in</strong>stitution, may not be<br />
able to quantify <strong>the</strong>ir “<strong>in</strong>tangible”<br />
benefits 25 to secure <strong>in</strong>stitutional support.<br />
Outpatient tra<strong>in</strong><strong>in</strong>g sites are<br />
not exempt from “<strong>in</strong>direct costs”: <strong>the</strong><br />
best estimate to date <strong>in</strong>dicates that<br />
teach<strong>in</strong>g outpatient cl<strong>in</strong>ics <strong>of</strong> comparable<br />
size have 36% higher operat<strong>in</strong>g<br />
costs than non-teach<strong>in</strong>g cl<strong>in</strong>ics, 38%<br />
<strong>of</strong> which are <strong>in</strong>frastructure costs. 26<br />
Solutions to national health care<br />
workforce challenges require creative<br />
th<strong>in</strong>k<strong>in</strong>g. Some have argued that <strong>the</strong><br />
IME versus DME separation may be<br />
an artificial construct, 27 which could<br />
be comb<strong>in</strong>ed <strong>in</strong>to total GME and<br />
<strong>the</strong>n allocated accord<strong>in</strong>g to national<br />
workforce goals. Targeted GME<br />
fund<strong>in</strong>g <strong>of</strong> ambulatory tra<strong>in</strong><strong>in</strong>g sites,<br />
such as <strong>the</strong> Teach<strong>in</strong>g Health Center<br />
(THC) health reform provision 28 and<br />
o<strong>the</strong>r proposals by MedPAC and <strong>the</strong><br />
Council on Graduate Medical Education<br />
(COGME) 2 could stabilize and<br />
enhance fund<strong>in</strong>g <strong>of</strong> family medic<strong>in</strong>e<br />
residencies <strong>in</strong> <strong>the</strong> future. 29 Conversion<br />
<strong>of</strong> more programs to FQHC<br />
status, <strong>in</strong>dependent <strong>of</strong> THC reforms<br />
that currently target only new programs<br />
or expansions, could also save<br />
many programs currently struggl<strong>in</strong>g<br />
with low reimbursements for <strong>the</strong><br />
high cost <strong>of</strong> care <strong>of</strong> un<strong>in</strong>sured and<br />
under<strong>in</strong>sured patients. State fund<strong>in</strong>g,<br />
<strong>in</strong>clud<strong>in</strong>g Medicaid GME reimbursements,<br />
needs to be closely<br />
evaluated and possibly standardized.<br />
Cost-trend analyses help identify <strong>the</strong><br />
cost <strong>of</strong> family medic<strong>in</strong>e tra<strong>in</strong><strong>in</strong>g to<br />
assist o<strong>the</strong>r programs <strong>in</strong> plann<strong>in</strong>g, as<br />
well as po<strong>in</strong>t out both <strong>the</strong> f<strong>in</strong>ancial<br />
threats to family medic<strong>in</strong>e residency<br />
programs and potential fund<strong>in</strong>g<br />
solutions.<br />
CORRESPONDING AUTHOR: Address correspondence<br />
to Dr Lesko, University <strong>of</strong> Wash<strong>in</strong>gton,<br />
P.O. Box 1195, Mercer Island, WA 98040.<br />
drlesko@gmail.com.<br />
References<br />
1. Kaiser <strong>Family</strong> Foundation summary <strong>of</strong> health<br />
reform law. June 2010. http://www.kff.org/<br />
healthreform/upload/8061.pdf. Accessed June<br />
23, 2010.<br />
2. N<strong>in</strong>eteenth report: enhanc<strong>in</strong>g flexibility <strong>in</strong><br />
graduate medical education. Rockville, MD:<br />
Council on Graduate Medical Education,<br />
September 2007. http://www.cogme.<br />
gov/19thReport/default.htm. Accessed June 4,<br />
2009.<br />
3. Medicare Payment Advisory Commission. Report<br />
to <strong>the</strong> Congress: align<strong>in</strong>g <strong>in</strong>centives <strong>in</strong><br />
Medicare. 2010.<br />
4. Rich EC, Liebow M, Sr<strong>in</strong>ivasam M, et al. Medicare<br />
f<strong>in</strong>anc<strong>in</strong>g <strong>of</strong> graduate medical education.<br />
Intractable problems, elusive solutions. J Gen<br />
Intern Med 2002;17:283-92.<br />
5. Phillips RL Jr, Fryer G Jr, Green LA. GME<br />
f<strong>in</strong>anc<strong>in</strong>g reform: <strong>the</strong> saga cont<strong>in</strong>ues. J Gen<br />
Intern Med 2002;17(4):311-2.<br />
6. Anderson GF, Greenberg GD, Wynn BO.<br />
Graduate medical education: <strong>the</strong> policy debate.<br />
Annu Rev Public Health 2001;22:35-47.<br />
7. Ambrose PW. Wash<strong>in</strong>gton policy makers<br />
and rural health: do <strong>the</strong>y get it? Fam Med<br />
1999;31(4):237-8.<br />
8. Gonzalez EH, Phillips RL Jr, Pugno PA. A<br />
study <strong>of</strong> closure <strong>of</strong> family practice residency<br />
programs. Fam Med 2004;36(3):158.<br />
9. Franz<strong>in</strong>i L, Monteiro FM, Fowler GC, Low MD.<br />
A cost construction model to assess <strong>the</strong> cost <strong>of</strong><br />
a family practice residency program. Fam Med<br />
1999;31(3):159-70.<br />
10. Casey L, Gillanders WR, Oprandi AM, Gilchrist<br />
VJ, Iverson D. Economic analysis <strong>of</strong> family<br />
practice residency programs: a report from<br />
<strong>the</strong> Nor<strong>the</strong>astern Ohio Network. Fam Med<br />
1995;27(7):424-30.<br />
11. Carlisle R. F<strong>in</strong>anc<strong>in</strong>g and budget<strong>in</strong>g <strong>of</strong> community-based<br />
family medic<strong>in</strong>e residency programs.<br />
South Med J 2006;99(6):576-80.<br />
12. Jones TF, Culpepper L, Shea C. Analysis <strong>of</strong><br />
<strong>the</strong> cost <strong>of</strong> tra<strong>in</strong><strong>in</strong>g residents <strong>in</strong> a community<br />
health center. Acad Med 1995;70:523-31.<br />
13. Zweifler J. <strong>Family</strong> practice residencies <strong>in</strong><br />
community health centers—an approach to<br />
cost and access concerns. Public Health Rep<br />
1995;110(3):312-8.<br />
14. Lewis E. Teach<strong>in</strong>g cost estimates for health<br />
center graduate medical education grant and<br />
f<strong>in</strong>anc<strong>in</strong>g programs. Wash<strong>in</strong>gton, DC: National<br />
Association <strong>of</strong> Community Health Centers,<br />
April 1993.<br />
15. Ma<strong>the</strong>ny SC, Love MM, Smith AW, Pugno<br />
PA. Six-<strong>year</strong> update on <strong>the</strong> f<strong>in</strong>ancial status <strong>of</strong><br />
US family medic<strong>in</strong>e departments. Fam Med<br />
2008;40(3):172-80.<br />
16. Pauwels J, Oliveira A, Stevens N. Benchmark<strong>in</strong>g<br />
<strong>the</strong> Costs <strong>of</strong> Residency Tra<strong>in</strong><strong>in</strong>g <strong>in</strong> <strong>Family</strong><br />
Practice. Fam Med 2003;35(5):330-6.<br />
17. Pauwels J, Oliveira A. Three-<strong>year</strong> trends <strong>in</strong> <strong>the</strong><br />
costs <strong>of</strong> residency tra<strong>in</strong><strong>in</strong>g <strong>in</strong> family medic<strong>in</strong>e.<br />
Fam Med 2006;38(6):408-15.<br />
18. COGME. Traditional approaches by states to<br />
f<strong>in</strong>anc<strong>in</strong>g medical education. http://www.cogme.<br />
gov/ManagedCare/5.htm. Accessed January 6,<br />
2011.<br />
19. Henderson TM. Medicaid direct and <strong>in</strong>direct<br />
graduate medical education payments: a<br />
50-state survey. Wash<strong>in</strong>gton,DC: Association<br />
<strong>of</strong> American Medical Colleges, April 2010.<br />
20. AAMC faculty compensation data.<br />
https://services.aamc.org/dsportal2/<strong>in</strong>dex.<br />
cfm?fuseaction=log<strong>in</strong>.log<strong>in</strong>&thread=jump.FS<br />
SREPORTS&appname=FSSREPORTS&from<br />
permissionscheck=true. Accessed with permission<br />
January 15, 2011.<br />
21. US <strong>in</strong>flation calculator. http://www.us<strong>in</strong>flationcalculator.com/.<br />
Accessed October 23, 2010.<br />
22. MedPAC. Medical education <strong>in</strong> <strong>the</strong> United<br />
States: support<strong>in</strong>g long-term delivery system<br />
reforms. Report to <strong>the</strong> Congress: Improv<strong>in</strong>g<br />
<strong>in</strong>centives <strong>in</strong> <strong>the</strong> Medicare program. 2009.<br />
23. Blewett LA, Smith MA, Caldis TG. Measur<strong>in</strong>g<br />
<strong>the</strong> direct costs <strong>of</strong> graduate medical<br />
education tra<strong>in</strong><strong>in</strong>g <strong>in</strong> M<strong>in</strong>nesota. Acad Med<br />
2001;76(5):446-52.<br />
24. MedPAC Report to Congress: Align<strong>in</strong>g <strong>in</strong>centives<br />
<strong>in</strong> Medicare. June 2010. tp://www.medpac.<br />
gov/documents/Jun10_EntireReport.pdf.<br />
25. Pugno PA, Gillanders WR, Kozakowski SM.<br />
The direct, <strong>in</strong>direct, and <strong>in</strong>tanglible benefits<br />
<strong>of</strong> graduate medical education programs to<br />
<strong>the</strong>ir sponsor<strong>in</strong>g <strong>in</strong>stitutions and communities.<br />
JGME 2010:154-9.<br />
26. Hogan AJ, Franz<strong>in</strong>i L, Boex JR. Estimat<strong>in</strong>g <strong>the</strong><br />
cost <strong>of</strong> primary care tra<strong>in</strong><strong>in</strong>g <strong>in</strong> ambulatory<br />
sett<strong>in</strong>gs. Health Econ 2000;9(8):715-26.<br />
27. Newhouse P, Wilensky G. Pay<strong>in</strong>g for graduate<br />
medical education: <strong>the</strong> debate goes on. Health<br />
Aff (Millwood) 2001;20(2):136-47.<br />
28. Legislative Language <strong>of</strong> Teach<strong>in</strong>g Health Centers,<br />
The Education Health Center Initiative.<br />
http://www.teach<strong>in</strong>ghealthcenter.org/resources/<br />
THCreformBill2010.pdf. Accessed November 5,<br />
2010.<br />
29. Bodenheimer T, Grumbach K, Berenson RA.<br />
A lifel<strong>in</strong>e for primary care. N Engl J Med<br />
2009;360(26):2693-6.<br />
550 SEPTEMBER 2011 • VOL. 43, NO. 8 FAMILY MEDICINE