Using "Fixed Percent" Scales in Telechart
Using "Fixed Percent" Scales in Telechart
Using "Fixed Percent" Scales in Telechart

You also want an ePaper? Increase the reach of your titles
YUMPU automatically turns print PDFs into web optimized ePapers that Google loves.
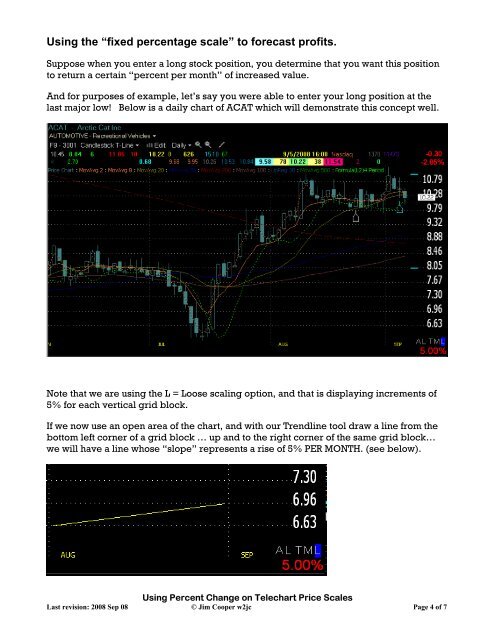
<strong>Us<strong>in</strong>g</strong> the “fixed percentage scale” to forecast profits.<br />
Suppose when you enter a long stock position, you determ<strong>in</strong>e that you want this position<br />
to return a certa<strong>in</strong> “percent per month” of <strong>in</strong>creased value.<br />
And for purposes of example, let’s say you were able to enter your long position at the<br />
last major low! Below is a daily chart of ACAT which will demonstrate this concept well.<br />
Note that we are us<strong>in</strong>g the L = Loose scal<strong>in</strong>g option, and that is display<strong>in</strong>g <strong>in</strong>crements of<br />
5% for each vertical grid block.<br />
If we now use an open area of the chart, and with our Trendl<strong>in</strong>e tool draw a l<strong>in</strong>e from the<br />
bottom left corner of a grid block … up and to the right corner of the same grid block…<br />
we will have a l<strong>in</strong>e whose “slope” represents a rise of 5% PER MONTH. (see below).<br />
<strong>Us<strong>in</strong>g</strong> Percent Change on <strong>Telechart</strong> Price <strong>Scales</strong><br />
Last revision: 2008 Sep 08 © Jim Cooper w2jc Page 4 of 7