Using "Fixed Percent" Scales in Telechart
Using "Fixed Percent" Scales in Telechart
Using "Fixed Percent" Scales in Telechart

Create successful ePaper yourself
Turn your PDF publications into a flip-book with our unique Google optimized e-Paper software.
The Secret to <strong>Us<strong>in</strong>g</strong> Percent Change on <strong>Telechart</strong> Price <strong>Scales</strong><br />
by Jim Cooper w2jc<br />
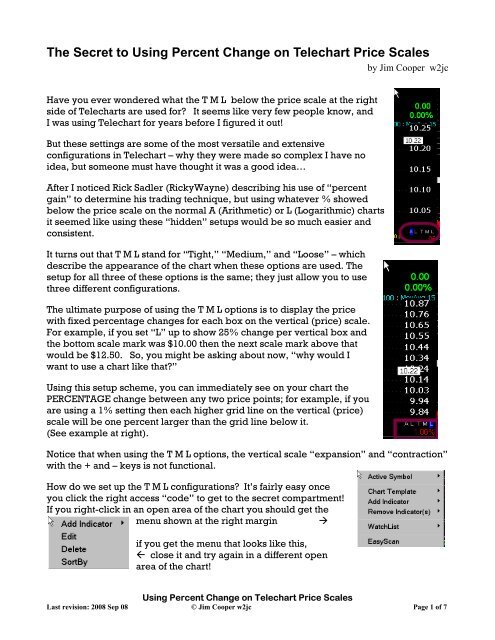
Have you ever wondered what the T M L below the price scale at the right<br />
side of <strong>Telechart</strong>s are used for? It seems like very few people know, and<br />
I was us<strong>in</strong>g <strong>Telechart</strong> for years before I figured it out!<br />
But these sett<strong>in</strong>gs are some of the most versatile and extensive<br />
configurations <strong>in</strong> <strong>Telechart</strong> – why they were made so complex I have no<br />
idea, but someone must have thought it was a good idea…<br />
After I noticed Rick Sadler (RickyWayne) describ<strong>in</strong>g his use of “percent<br />
ga<strong>in</strong>” to determ<strong>in</strong>e his trad<strong>in</strong>g technique, but us<strong>in</strong>g whatever % showed<br />
below the price scale on the normal A (Arithmetic) or L (Logarithmic) charts<br />
it seemed like us<strong>in</strong>g these “hidden” setups would be so much easier and<br />
consistent.<br />
It turns out that T M L stand for “Tight,” “Medium,” and “Loose” – which<br />
describe the appearance of the chart when these options are used. The<br />
setup for all three of these options is the same; they just allow you to use<br />
three different configurations.<br />
The ultimate purpose of us<strong>in</strong>g the T M L options is to display the price<br />
with fixed percentage changes for each box on the vertical (price) scale.<br />
For example, if you set “L” up to show 25% change per vertical box and<br />
the bottom scale mark was $10.00 then the next scale mark above that<br />
would be $12.50. So, you might be ask<strong>in</strong>g about now, “why would I<br />
want to use a chart like that?”<br />
<strong>Us<strong>in</strong>g</strong> this setup scheme, you can immediately see on your chart the<br />
PERCENTAGE change between any two price po<strong>in</strong>ts; for example, if you<br />
are us<strong>in</strong>g a 1% sett<strong>in</strong>g then each higher grid l<strong>in</strong>e on the vertical (price)<br />
scale will be one percent larger than the grid l<strong>in</strong>e below it.<br />
(See example at right).<br />
Notice that when us<strong>in</strong>g the T M L options, the vertical scale “expansion” and “contraction”<br />
with the + and – keys is not functional.<br />
How do we set up the T M L configurations? It’s fairly easy once<br />
you click the right access “code” to get to the secret compartment!<br />
If you right-click <strong>in</strong> an open area of the chart you should get the<br />
menu shown at the right marg<strong>in</strong> �<br />
if you get the menu that looks like this,<br />
� close it and try aga<strong>in</strong> <strong>in</strong> a different open<br />
area of the chart!<br />
<strong>Us<strong>in</strong>g</strong> Percent Change on <strong>Telechart</strong> Price <strong>Scales</strong><br />
Last revision: 2008 Sep 08 © Jim Cooper w2jc Page 1 of 7
Once you have the correct menu w<strong>in</strong>dow, place the<br />
cursor over the “Chart Template” option and a<br />
second, larger menu should appear.<br />
When it does, move the cursor over the “Scal<strong>in</strong>g”<br />
selection and left-click.<br />
� The “Chart Scal<strong>in</strong>g”<br />
menu should now<br />
appear, and it will show<br />
sett<strong>in</strong>gs for whichever of the<br />
A L T M L options is currently selected.<br />
If the “Chart Scal<strong>in</strong>g” menu does not appear with the “Loose”<br />
option selected (bottom of w<strong>in</strong>dow), then click on the button to<br />
select the “Loose” option [which we will use here for the<br />
example setup].<br />
Next, click on the [ Configure ] button to the right of the Loose.<br />
This should cause a large, complex configuration menu<br />
w<strong>in</strong>dow to appear. (I said earlier that this provides one of the<br />
most complex configurations <strong>in</strong> <strong>Telechart</strong>!)<br />
The “Scale Table” menu w<strong>in</strong>dow allows you to set a<br />
different “Gridl<strong>in</strong>e %” for each of the 19 time frames<br />
shown <strong>in</strong> the menu w<strong>in</strong>dow. (Which, <strong>in</strong> my op<strong>in</strong>ion, is far<br />
more complex than I want to use it, but the versatility is<br />
there if you decide to use it.)<br />
For simplicity, I suggest sett<strong>in</strong>g all of the non-<strong>in</strong>traday<br />
sett<strong>in</strong>gs to the same percent value; for the “Loose”<br />
configuration I have chosen to use 5%.<br />
Because it is unlikely to have really big percentage moves<br />
<strong>in</strong>tra-day, I have chosen to set those to 1% or less (as you<br />
can see <strong>in</strong> the screen shot at the right marg<strong>in</strong>).<br />
Be sure to leave all the “Scale Method” sett<strong>in</strong>gs at<br />
“Custom” or you will not be able to set the “Gridl<strong>in</strong>e %”<br />
value. (Tick is probably best left as “Arithmetic”).<br />
When you have f<strong>in</strong>ished sett<strong>in</strong>g the configurations on the<br />
“Scale Table” menu,<br />
click [ OK ] to save the sett<strong>in</strong>gs.<br />
<strong>Us<strong>in</strong>g</strong> Percent Change on <strong>Telechart</strong> Price <strong>Scales</strong><br />
Last revision: 2008 Sep 08 © Jim Cooper w2jc Page 2 of 7
The “Chart Scal<strong>in</strong>g” menu w<strong>in</strong>dow should still be open. Repeat the [Configure] process<br />
for “Medium” and for “Tight” if you wish to use those options. My choice of sett<strong>in</strong>gs for<br />
these options is shown with the two screen captures on the follow<strong>in</strong>g page.<br />
When you have f<strong>in</strong>ished configur<strong>in</strong>g all three Time Frame options,<br />
click on the [Close] button to close the “Chart Scal<strong>in</strong>g” menu w<strong>in</strong>dow.<br />
Which of the T M L options you use for your chart read<strong>in</strong>g will now probably depend on<br />
how much price change the stock you are view<strong>in</strong>g has made.<br />
• For those hav<strong>in</strong>g only fairly small changes use the “L” Loose option.<br />
• For charts that are show<strong>in</strong>g huge ga<strong>in</strong>s, you can use the “T” Tight option to<br />
compress the price move onto the chart space.<br />
Now that your charts are configured with these three extra options, there are some unique<br />
ways you can use them while ‘read<strong>in</strong>g’ the charts. One way that I developed some time<br />
ago (but have not really implemented <strong>in</strong> my “plan” as yet) is described on the next page.<br />
<strong>Us<strong>in</strong>g</strong> Percent Change on <strong>Telechart</strong> Price <strong>Scales</strong><br />
Last revision: 2008 Sep 08 © Jim Cooper w2jc Page 3 of 7
<strong>Us<strong>in</strong>g</strong> the “fixed percentage scale” to forecast profits.<br />
Suppose when you enter a long stock position, you determ<strong>in</strong>e that you want this position<br />
to return a certa<strong>in</strong> “percent per month” of <strong>in</strong>creased value.<br />
And for purposes of example, let’s say you were able to enter your long position at the<br />
last major low! Below is a daily chart of ACAT which will demonstrate this concept well.<br />
Note that we are us<strong>in</strong>g the L = Loose scal<strong>in</strong>g option, and that is display<strong>in</strong>g <strong>in</strong>crements of<br />
5% for each vertical grid block.<br />
If we now use an open area of the chart, and with our Trendl<strong>in</strong>e tool draw a l<strong>in</strong>e from the<br />
bottom left corner of a grid block … up and to the right corner of the same grid block…<br />
we will have a l<strong>in</strong>e whose “slope” represents a rise of 5% PER MONTH. (see below).<br />
<strong>Us<strong>in</strong>g</strong> Percent Change on <strong>Telechart</strong> Price <strong>Scales</strong><br />
Last revision: 2008 Sep 08 © Jim Cooper w2jc Page 4 of 7
Or, if I were a bit more greedy, I could create a l<strong>in</strong>e for TEN percent per month by us<strong>in</strong>g<br />
two vertical grid blocks for one month of horizontal time:<br />
Now that we have the “slope” of the l<strong>in</strong>e set on our<br />
chart, we can MOVE the l<strong>in</strong>e to any position we<br />
want; for our example, let’s start the “10% per<br />
month” l<strong>in</strong>e at the low po<strong>in</strong>t of the price chart at<br />
July 15 th – we move the slope l<strong>in</strong>e by hover<strong>in</strong>g the<br />
cursor around the CENTER of the l<strong>in</strong>e until the<br />
small circle appears… then “grab” the circle with the cursor and drag the slop<strong>in</strong>g l<strong>in</strong>e to<br />
where ever you want it.<br />
CAUTION: There is a serious ‘caveat’ about mov<strong>in</strong>g trendl<strong>in</strong>es <strong>in</strong> <strong>Telechart</strong>… you must<br />
be very careful not to allow the right-hand end of<br />
the trendl<strong>in</strong>e to go off the right side of the chart –<br />
otherwise the slope of the l<strong>in</strong>e will change. �<br />
(Try this with two parallel l<strong>in</strong>es you have drawn on<br />
the chart – then move one off the right side of the<br />
chart a bit, release the mouse and then drag it back next to the unchanged l<strong>in</strong>e…)<br />
Back to the chart and our “rate of return” project.<br />
<strong>Us<strong>in</strong>g</strong> Percent Change on <strong>Telechart</strong> Price <strong>Scales</strong><br />
Last revision: 2008 Sep 08 © Jim Cooper w2jc Page 5 of 7
When we have dragged our slop<strong>in</strong>g l<strong>in</strong>e over to our long position entry po<strong>in</strong>t at July 15 th<br />
and turned on the “extensions” for the trend l<strong>in</strong>e (use Control T several times), we now<br />
have a “rate of return trendl<strong>in</strong>e” on the chart show<strong>in</strong>g a rate of TEN PERCENT PER<br />
MONTH.<br />
As long as the price stays above that slop<strong>in</strong>g l<strong>in</strong>e, we are earn<strong>in</strong>g a rate of return <strong>in</strong><br />
excess of 120% per year!! How’s that compared to 4% for certificates of deposit?<br />
You can see that ACAT is return<strong>in</strong>g far more than 10% per month; which leads us to<br />
another use for the “fixed percentage” scal<strong>in</strong>g of our chart – which will be described on<br />
the next page.<br />
<strong>Us<strong>in</strong>g</strong> Percent Change on <strong>Telechart</strong> Price <strong>Scales</strong><br />
Last revision: 2008 Sep 08 © Jim Cooper w2jc Page 6 of 7
<strong>Us<strong>in</strong>g</strong> the “fixed percentage scale” to estimate “rate of return.”<br />
If we sort of reverse the previous procedure, and draw a trendl<strong>in</strong>e on a segment of the<br />
exist<strong>in</strong>g price chart, we can use the fixed percentage scale to get a fast estimate of the<br />
percent change of the stock.<br />
Draw a trend l<strong>in</strong>e from the po<strong>in</strong>t of entry for our long position (<strong>in</strong> this case, we are us<strong>in</strong>g<br />
the low of July) to what ever target date we are <strong>in</strong>terested <strong>in</strong>. Use the trendl<strong>in</strong>e without<br />
extensions (aga<strong>in</strong>, use Control T several times).<br />
Next, f<strong>in</strong>d the little circle at the center of the trendl<strong>in</strong>e and use the cursor to drag the<br />
trendl<strong>in</strong>e so that the lower left end of the l<strong>in</strong>e is at the lower left corner of a grid box. Try<br />
to f<strong>in</strong>d an area on the chart where the candles do not <strong>in</strong>terfere with see<strong>in</strong>g the grid boxes<br />
clearly. Also, remember the earlier “caveat” about not mov<strong>in</strong>g the l<strong>in</strong>e past the right<br />
edge of the chart.<br />
Look<strong>in</strong>g at the vertical grid l<strong>in</strong>e for the next<br />
month, we can count the vertical grid boxes<br />
up to where the trendl<strong>in</strong>e crosses.<br />
Know<strong>in</strong>g that each vertical grid box is a 5%<br />
<strong>in</strong>crease <strong>in</strong> price, you can see that dur<strong>in</strong>g the<br />
month of July ACAT ga<strong>in</strong>ed 50% PER MONTH !!<br />
(You could do this percentage calculation<br />
us<strong>in</strong>g the Logarithmic scale also, but while the<br />
vertical blocks there are all equal they are not<br />
a fixed or “round” value – like 5% or 10%).<br />
<strong>Us<strong>in</strong>g</strong> Percent Change on <strong>Telechart</strong> Price <strong>Scales</strong><br />
Last revision: 2008 Sep 08 © Jim Cooper w2jc Page 7 of 7