Score Report Quickview - nocti
Score Report Quickview - nocti
Score Report Quickview - nocti

You also want an ePaper? Increase the reach of your titles
YUMPU automatically turns print PDFs into web optimized ePapers that Google loves.
800.334.6283 www.<strong>nocti</strong>.org<br />
<strong>Score</strong> <strong>Report</strong> <strong>Quickview</strong> Guide<br />
03-31-2011<br />
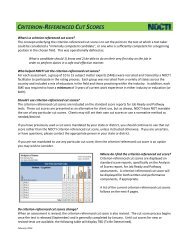
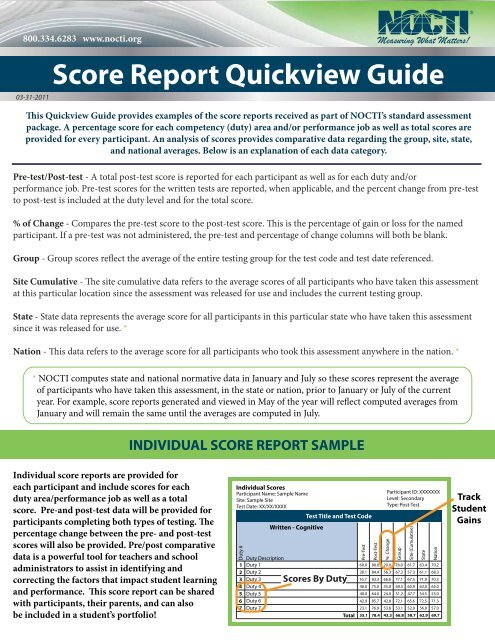
�is <strong>Quickview</strong> Guide provides examples of the score reports received as part of NOCTI’s standard assessment<br />
package. A percentage score for each competency (duty) area and/or performance job as well as total scores are<br />
provided for every participant. An analysis of scores provides comparative data regarding the group, site, state,<br />
and national averages. Below is an explanation of each data category.<br />
Pre-test/Post-test - A total post-test score is reported for each participant as well as for each duty and/or<br />
performance job. Pre-test scores for the written tests are reported, when applicable, and the percent change from pre-test<br />
to post-test is included at the duty level and for the total score.<br />
% of Change - Compares the pre-test score to the post-test score. �is is the percentage of gain or loss for the named<br />
participant. If a pre-test was not administered, the pre-test and percentage of change columns will both be blank.<br />
Group - Group scores re�ect the average of the entire testing group for the test code and test date referenced.<br />
Site Cumulative - �e site cumulative data refers to the average scores of all participants who have taken this assessment<br />
at this particular location since the assessment was released for use and includes the current testing group.<br />
State - State data represents the average score for all participants in this particular state who have taken this assessment<br />
since it was released for use. *<br />
Nation - �is data refers to the average score for all participants who took this assessment anywhere in the nation. *<br />
* NOCTI computes state and national normative data in January and July so these scores represent the average<br />
of participants who have taken this assessment, in the state or nation, prior to January or July of the current<br />
year. For example, score reports generated and viewed in May of the year will re�ect computed averages from<br />
January and will remain the same until the averages are computed in July.<br />
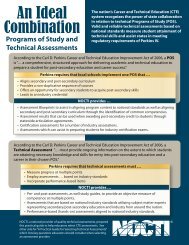
Individual score reports are provided for<br />
each participant and include scores for each<br />
duty area/performance job as well as a total<br />
score. Pre-and post-test data will be provided for<br />
participants completing both types of testing. �e<br />
percentage change between the pre- and post-test<br />
scores will also be provided. Pre/post comparative<br />
data is a powerful tool for teachers and school<br />
administrators to assist in identifying and<br />
correcting the factors that impact student learning<br />
and performance. �is score report can be shared<br />
with participants, their parents, and can also<br />
be included in a student’s portfolio!<br />
INDIVIDUAL SCORE REPORT SAMPLE<br />
Individual <strong>Score</strong>s<br />
Participant Name: Sample Name<br />
Site: Sample Site<br />
Test Date: XX/XX/XXXX<br />
Test Title and Test Code<br />
Written - Cognitive<br />
1<br />
2<br />
3<br />
4<br />
5<br />
6<br />
7<br />
Duty Description<br />
Duty 1<br />
Duty 2<br />
Duty 3<br />
Duty 4<br />
Duty 5<br />
Duty 6<br />
Duty 7<br />
<strong>Score</strong>s By Duty<br />
Participant ID: XXXXXXX<br />
Level: Secondary<br />
Type: Post-Test<br />
60.0 80.0 20.0 76.0 61.7 63.4 70.2<br />
28.1 84.4 56.3 67.2 57.3 61.1 68.3<br />
16.7 83.3 66.6 77.1 67.5 71.9 70.3<br />
40.0 75.0 35.0 69.5 60.9 63.0 65.0<br />
40.0 64.0 24.0 51.2 47.7 54.5 53.0<br />
42.9 85.7 42.8 72.1 65.6 72.5 71.3<br />
23.1 76.9 53.8 53.1 52.0 56.0 57.0<br />
Total 35.1 78.4 43.3 66.8 58.7 62.9 69.7<br />
Track<br />
Student<br />
Gains
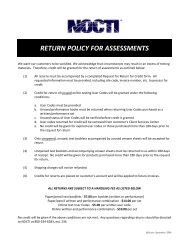
�e group score report is a summary of the assessment results for all participants within the particular test<br />
group. Participants are listed alphabetically with individual scores displayed for duty areas/performance jobs as<br />
well as a total score. Group averages can be used to identify strength and gap areas in the program.<br />
Group <strong>Score</strong> <strong>Report</strong><br />
Site: SAMPLE<br />
Test Date: XX/XX/XXXX<br />
1<br />
2<br />
3<br />
4<br />
5<br />
6<br />
7<br />
Duty Description<br />
Duty 1<br />
Duty 2<br />
Duty 3<br />
Duty 4<br />
Duty 5<br />
Duty 6<br />
Duty 7<br />
Written - Cognitive<br />
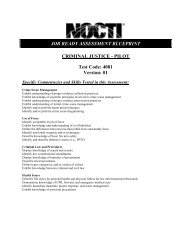
�e analysis of scores section of the<br />
report provides useful comparative data<br />
that can be helpful in making inferences<br />
about the assessment results. Group, site,<br />
state and national averages are displayed<br />
for both total assessment and duty<br />
areas/performance jobs. State and<br />
national averages are updated in<br />
January and July each year. Group and<br />
site averages are updated with every<br />
assessment administration.<br />
NOCTI o�ers<br />
• Task Link<br />
• Comparison to Cut <strong>Score</strong><br />
customized<br />
• Demographic Analysis<br />
• Year-to-Year Comparisons<br />
• Integrated Academics<br />
reports that can<br />
customized reports, including pricing.<br />
be<br />
NOCTI o�ers customized reports that can be<br />
tailored to customer needs. Examples include:<br />
Contact NOCTI for more information about<br />
GROUP SCORE REPORT SAMPLE<br />
Test Title and Test Code<br />
85.0 55.0 80.0 80.0 75.0 75.0 85.0 80.0 70.0 75.0<br />
59.4 37.5 84.4 84.4 31.3 53.1 81.3 84.4 75.0 81.3<br />
41.7 62.5 83.3 83.3 79.2 75.0 83.3 83.3 83.3 95.8<br />
50.0 60.0 75.0 75.0 70.0 60.0 85.0 75.0 65.0 80.0<br />
32.0 24.0 64.0 64.0 20.0 56.0 64.0 60.0 56.0 72.0<br />
42.9 57.1 85.7 85.7 21.4 78.6 85.7 85.7 92.9 85.7<br />
38.5 38.5 76.9 76.9 23.1 46.2 76.9 76.9 38.5 61.5<br />
Total 50.7 46.6 78.4 78.4 46.6 62.8 77.7 77.7 69.6 79.7<br />
ANALYSIS OF SCORES REPORT SAMPLE<br />
Comparative Data<br />
Analysis of <strong>Score</strong>s<br />
Site: Sample Site<br />
Test Date: XX/XX/XXXX<br />
Test Title and Test Code<br />
Written - Cognitive<br />
1<br />
2<br />
3<br />
4<br />
5<br />
6<br />
7<br />
Duty Description<br />
Duty 1<br />
Duty 2<br />
Duty 3<br />
Duty 4<br />
Duty 5<br />
Duty 6<br />
Duty 7<br />
Level: Secondary<br />
Type: Post-Test<br />
17%<br />
14%<br />
22%<br />
Written - Cognitive<br />
Level: Secondary<br />
Type: Post-Test<br />
Duty 1<br />
Duty 2<br />
Duty 3<br />
Duty 4<br />
Duty 5<br />
Duty 6<br />
Duty 7<br />
N= 10 25 339 1034<br />
76.0 68.6 63.4 70.2 13.9 4.4<br />
67.2 61.0 61.1 68.3 15.3 4.8<br />
77.1 75.5 71.9 70.3 16.1 5.1<br />
69.5 65.0 63.0 65.0 17.7 5.6<br />
51.2 52.5 54.5 53.0 13.7 4.3<br />
72.1 71.1 72.5 71.3 17.0 5.4<br />
53.1 56.6 56.0 57.0 20.7 6.5<br />
Total 66.8 64.1 62.9 69.7 55.1 11.9 3.8<br />
NOCTI <strong>Score</strong> reports can be exported to PDF or<br />
Excel formats. Exporting the score reports to PDF<br />
format allows for easy printing and storage to the<br />
site’s choice of media (i.e., local network, �ash<br />
drive, etc.). �e Excel export feature provides<br />
schools with a method for easily manipulating<br />
data. �is option can be helpful with a variety of<br />
analysis and reporting needs.<br />
Test Title Test Date Name Student ID Total <strong>Score</strong><br />
Test Title 3/19/20XX Student Name XXXXXX 76.8<br />
Test Title 3/19/20XX Student Name XXXXXX 66.2<br />
9%<br />
9%<br />
14%<br />
16%<br />
Content Breakdown