ANNUAL REPORT ANNUAL REPORT
ANNUAL REPORT ANNUAL REPORT
ANNUAL REPORT ANNUAL REPORT

You also want an ePaper? Increase the reach of your titles
YUMPU automatically turns print PDFs into web optimized ePapers that Google loves.
Administration report<br />
Shipping market<br />
Maritime transport<br />
Sweden’s geographic position and its<br />
considerable dependence on foreign<br />
trade give shipping a dominant role<br />
in the Swedish transport system. Cargo<br />
vessels or ferries convey more than<br />
90% of all exports and imports.<br />
Seaborne freight volumes in foreign<br />
trade amounted to 152 (147) million<br />
tonnes in 2005. Of this total freight<br />
volume, cargo vessels carried the<br />
largest portion, that is, about 116<br />
(114) million tonnes. Ferry traffic –<br />
passenger and rail ferries – transported<br />
some 36 (33) million tonnes of<br />
freight in and out of Sweden in 2005.<br />
The number of seaborne passengers<br />
arriving in Sweden totalled 14.3<br />
(13.9) million and the number of<br />
passengers travelling within Sweden<br />
amounted to 1.4 (1.4) million. Shipping<br />
is also of major significance for<br />
domestic transport. In terms of<br />
tonnes/km, maritime transport accounts<br />
for almost 40% of the total<br />
domestic transport volume. Overall,<br />
Swedish ports reported a turnover of<br />
about 163 (157) million tonnes of<br />
chargeable seaborne goods in 2005,<br />
an increase of about 4% from 2004.<br />
2001 was the first year in many that<br />
maritime transport and freight<br />
turnover at Swedish ports fell, with a<br />
decline of about 4%. During 2002<br />
and 2004, freight volumes again advanced.<br />
Following a rather flat trend<br />
in 2004, the increase added momentum<br />
in 2005, with chargeable goods<br />
volumes about 7% higher than the<br />
peak year of 2000 in the preceding<br />
boom period. Since the levelling out<br />
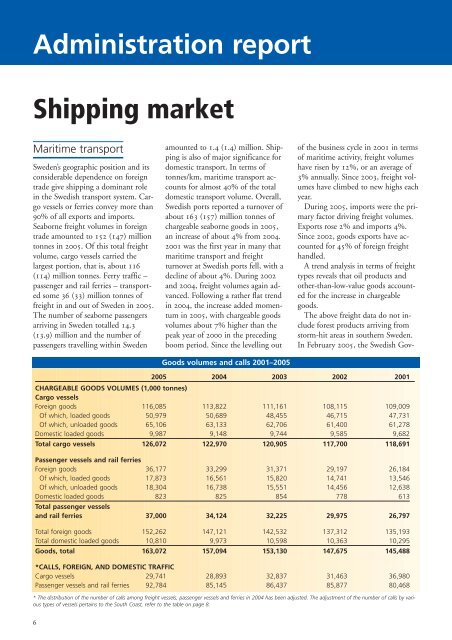
Goods volumes and calls 2001–2005<br />
of the business cycle in 2001 in terms<br />
of maritime activity, freight volumes<br />
have risen by 12%, or an average of<br />
3% annually. Since 2003, freight volumes<br />
have climbed to new highs each<br />
year.<br />
During 2005, imports were the primary<br />
factor driving freight volumes.<br />
Exports rose 2% and imports 4%.<br />
Since 2002, goods exports have accounted<br />
for 45% of foreign freight<br />
handled.<br />
A trend analysis in terms of freight<br />
types reveals that oil products and<br />
other-than-low-value goods accounted<br />
for the increase in chargeable<br />
goods.<br />
The above freight data do not include<br />
forest products arriving from<br />
storm-hit areas in southern Sweden.<br />
In February 2005, the Swedish Gov-<br />
2005<br />
CHARGEABLE GOODS VOLUMES (1,000 tonnes)<br />
Cargo vessels<br />
2004 2003 2002 2001<br />
Foreign goods 116,085 113,822 111,161 108,115 109,009<br />
Of which, loaded goods 50,979 50,689 48,455 46,715 47,731<br />
Of which, unloaded goods 65,106 63,133 62,706 61,400 61,278<br />
Domestic loaded goods 9,987 9,148 9,744 9,585 9,682<br />
Total cargo vessels 126,072 122,970 120,905 117,700 118,691<br />
Passenger vessels and rail ferries<br />
Foreign goods 36,177 33,299 31,371 29,197 26,184<br />
Of which, loaded goods 17,873 16,561 15,820 14,741 13,546<br />
Of which, unloaded goods 18,304 16,738 15,551 14,456 12,638<br />
Domestic loaded goods<br />
Total passenger vessels<br />
823 825 854 778 613<br />
and rail ferries 37,000 34,124 32,225 29,975 26,797<br />
Total foreign goods 152,262 147,121 142,532 137,312 135,193<br />
Total domestic loaded goods 10,810 9,973 10,598 10,363 10,295<br />
Goods, total 163,072 157,094 153,130 147,675 145,488<br />
*CALLS, FOREIGN, AND DOMESTIC TRAFFIC<br />
Cargo vessels 29,741 28,893 32,837 31,463 36,980<br />
Passenger vessels and rail ferries 92,784 85,145 86,437 85,877 80,468<br />
* The distribution of the number of calls among freight vessels, passenger vessels and ferries in 2004 has been adjusted. The adjustment of the number of calls by various<br />
types of vessels pertains to the South Coast, refer to the table on page 8.<br />
6