Storm Signals Flip Chart V4 - Sun Earth Day 2005
Storm Signals Flip Chart V4 - Sun Earth Day 2005
Storm Signals Flip Chart V4 - Sun Earth Day 2005

Create successful ePaper yourself
Turn your PDF publications into a flip-book with our unique Google optimized e-Paper software.
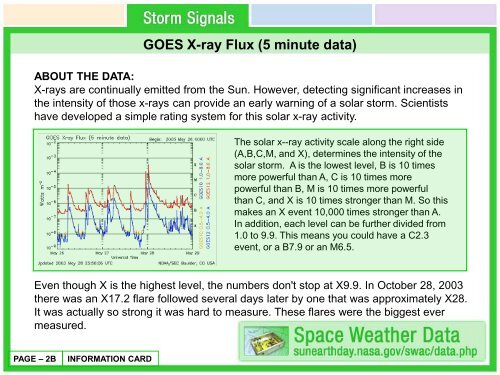
GOES X-ray Flux (5 minute data)<br />
ABOUT THE DATA:<br />
X-rays are continually emitted from the <strong>Sun</strong>. However, detecting significant increases in<br />
the intensity of those x-rays can provide an early warning of a solar storm. Scientists<br />
have developed a simple rating system for this solar x-ray activity.<br />
The solar x--ray activity scale along the right side<br />
(A,B,C,M, and X), determines the intensity of the<br />
solar storm. A is the lowest level, B is 10 times<br />
more powerful than A, C is 10 times more<br />
powerful than B, M is 10 times more powerful<br />
than C, and X is 10 times stronger than M. So this<br />
makes an X event 10,000 times stronger than A.<br />
In addition, each level can be further divided from<br />
1.0 to 9.9. This means you could have a C2.3<br />
event, or a B7.9 or an M6.5.<br />
Even though X is the highest level, the numbers don't stop at X9.9. In October 28, 2003<br />
there was an X17.2 flare followed several days later by one that was approximately X28.<br />
It was actually so strong it was hard to measure. These flares were the biggest ever<br />
measured.<br />
PAGE – 2B INFORMATION CARD