Storm Signals Flip Chart V4 - Sun Earth Day 2005
Storm Signals Flip Chart V4 - Sun Earth Day 2005
Storm Signals Flip Chart V4 - Sun Earth Day 2005

Create successful ePaper yourself
Turn your PDF publications into a flip-book with our unique Google optimized e-Paper software.
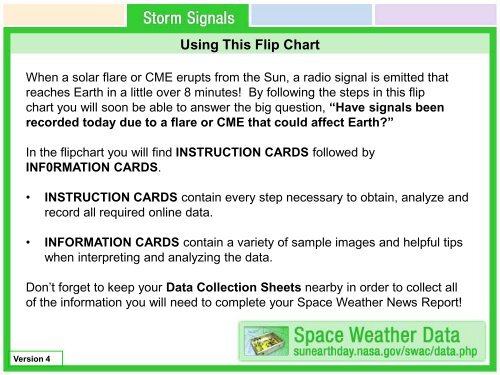
Using This <strong>Flip</strong> <strong>Chart</strong><br />
When a solar flare or CME erupts from the <strong>Sun</strong>, a radio signal is emitted that<br />
reaches <strong>Earth</strong> in a little over 8 minutes! By following the steps in this flip<br />
chart you will soon be able to answer the big question, “Have signals been<br />
recorded today due to a flare or CME that could affect <strong>Earth</strong>?”<br />
In the flipchart you will find INSTRUCTION CARDS followed by<br />
INF0RMATION CARDS.<br />
• INSTRUCTION CARDS contain every step necessary to obtain, analyze and<br />
record all required online data.<br />
• INFORMATION CARDS contain a variety of sample images and helpful tips<br />
when interpreting and analyzing the data.<br />
Don’t forget to keep your Data Collection Sheets nearby in order to collect all<br />
of the information you will need to complete your Space Weather News Report!<br />
Version 4
Using This <strong>Flip</strong> <strong>Chart</strong><br />
COLOR CODING<br />
We have divided all of the Space Weather Action Center resources into four ‘colorcoded’<br />
categories: <strong>Sun</strong>spot Regions (orange), <strong>Storm</strong> <strong>Signals</strong> (green), Magnetosphere<br />
(blue) and Aurora (purple). The same color code scheme is used in the flipchart, the<br />
data collection sheets and on the Live Data and Tutorials webpage. You can always<br />
know which section you’re in with one quick glance!<br />
SPACE WEATHER DATA<br />
All of the data links required to make your space weather observations are located on<br />
this single webpage. Beside each of the ‘live data’ links you will also find ‘tutorial’ links<br />
containing easy to read tutorials that that will help you when interpreting the data. You<br />
can always find your place by returning to this page!<br />
THE SPACE WEATHER MEDIA VIEWER<br />
The Space Weather Media Viewer is one of the main observation tools that you will be<br />
using. Once the Viewer is open, we recommend that you simply keep it open in a<br />
separate browser tab or window for faster data access when needed.
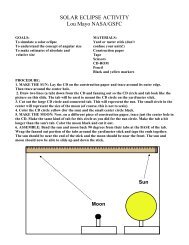
Radio JOVE Data Archive<br />
1. Open ‘Space Weather Data’ and click on “ Radio<br />
JOVE Data Archive ” (live data). A calendar for the<br />
current month will appear.<br />
2. Use the calendar to find the most recent events from<br />
radio receivers within the Radio JOVE network.<br />
3. If there is a radio signal from the sun you will see ‘sun<br />
images’ on the calendar. Click on any of the ‘sun<br />
images’ to see the corresponding data and graphs. If<br />
you do not see ‘sun images’ refer to the GOES X-ray<br />
Flux (page 2A).<br />
4. Refer to your ‘<strong>Storm</strong> <strong>Signals</strong> Data Collection’ sheet to<br />
answer questions (a) through (d).<br />
5. Close the current window and return to ‘Space Weather<br />
Data’ .<br />
PAGE – 1A INSTRUCTION CARD<br />
Observatory Data
ANALYSIS TIPS:<br />
Sharp spikes in the graph are usually due to man-made<br />
signals or lightning strikes.<br />
The graph of a solar storm would show a gradual rise<br />
and fall in the signal over several seconds to several<br />
minutes and would look somewhat like a shark’s fin.<br />
PAGE – 1B INFORMATION CARD<br />
Radio JOVE Data Archive<br />
ABOUT THE DATA:<br />
When a solar flare or coronal mass ejection<br />
erupts, hot, charged particles are accelerated<br />
away from the <strong>Sun</strong>. When this happens, a<br />
radio signal is emitted that reaches <strong>Earth</strong> in a<br />
little over 8 minutes providing the first signal<br />
that a solar storm is headed our way.<br />
However, the particles from that same storm<br />
usually take up to 3 days to reach <strong>Earth</strong>.<br />
Solar flares and Coronal Mass Ejections<br />
(CMEs) emit a broad range of light. Most of<br />
this light is invisible to us. To detect solar<br />
storms we will use radio waves, x--rays, and<br />
ultraviolet light. Radio waves are especially<br />
useful because they can be measured by<br />
instruments on the <strong>Earth</strong> and in interplanetary<br />
space.
GOES X-ray Flux (5 minute data)<br />
1. Open ‘Space Weather Data’ and select ‘GOES X-ray Flux (5<br />
minute data)’ (live data). Observe the red line on the graph. This<br />
line indicates the level of solar activity that will affect <strong>Earth</strong>.<br />
2. Using the solar x-ray activity scale (A,B,C,M, and X) along the right<br />
side of the graph, determine the power of the solar storm.<br />
• Levels A and B indicate that Aurora sightings are only possible<br />
in higher latitudes.<br />
• Level C indicates that Aurora sightings are possible further<br />
south.<br />
• Levels M and X indicate that Aurora sightings are possible as<br />
far south as Texas!<br />
3. Refer to your ‘<strong>Storm</strong> <strong>Signals</strong> Data Collection’ sheet to answer<br />
questions (e), (f), and the (Comprehension Question).<br />
4. Close the current window and return to ‘Space Weather Data’.<br />
PAGE – 2A INSTRUCTION CARD<br />
Satellite Data
GOES X-ray Flux (5 minute data)<br />
ABOUT THE DATA:<br />
X-rays are continually emitted from the <strong>Sun</strong>. However, detecting significant increases in<br />
the intensity of those x-rays can provide an early warning of a solar storm. Scientists<br />
have developed a simple rating system for this solar x-ray activity.<br />
The solar x--ray activity scale along the right side<br />
(A,B,C,M, and X), determines the intensity of the<br />
solar storm. A is the lowest level, B is 10 times<br />
more powerful than A, C is 10 times more<br />
powerful than B, M is 10 times more powerful<br />
than C, and X is 10 times stronger than M. So this<br />
makes an X event 10,000 times stronger than A.<br />
In addition, each level can be further divided from<br />
1.0 to 9.9. This means you could have a C2.3<br />
event, or a B7.9 or an M6.5.<br />
Even though X is the highest level, the numbers don't stop at X9.9. In October 28, 2003<br />
there was an X17.2 flare followed several days later by one that was approximately X28.<br />
It was actually so strong it was hard to measure. These flares were the biggest ever<br />
measured.<br />
PAGE – 2B INFORMATION CARD
GOES X-ray Flux (5 minute data)<br />
ANALYSIS TIP:<br />
Two GOES satellites record solar x-ray<br />
emission, GOES 10 and GOES 12. The<br />
red plot from GOES 12 is the one we<br />
want to use.<br />
REMEMBER:<br />
This is a 3-day plot. It usually takes 3<br />
days for solar storms to reach <strong>Earth</strong>.<br />
ABOUT THE DATA:<br />
It is important to find out if these flares were on the side of the <strong>Sun</strong> facing us.<br />
Flares from the side of the <strong>Sun</strong> facing us are more likely to disturb <strong>Earth</strong>'s<br />
magnetosphere than flares that erupt from the edges. You can use images<br />
1-6 on the <strong>Sun</strong>-<strong>Earth</strong> Viewer to evaluate the location of the emissions from<br />
the <strong>Sun</strong>.<br />
PAGE – 2C INFORMATION CARD