

handout - Daina Chiba
handout - Daina Chiba
handout - Daina Chiba
- TAGS
- handout
- daina
- chiba
- dynaman.net

Create successful ePaper yourself
Turn your PDF publications into a flip-book with our unique Google optimized e-Paper software.
3.4 Plotting Substantive Effects: When X is a Discrete Variable...<br />
If the regressor of your interest takes only a limited number of discrete values (for example,<br />
0 or 1), then consider using histograms instead of line plots. An example of histogram<br />
representation of substantive effects are shown in Figure 2. To produce this figure, run the<br />
R code under section 3.4 and you will obtain (output/figs/subeff2.pdf)<br />
Frequency<br />
0 100 200 300 400<br />
Noncontiguous dyads<br />
Contiguous dyads<br />
0.00 0.01 0.02 0.03 0.04 0.05 0.06 0.07<br />
Probability of MID Onset<br />
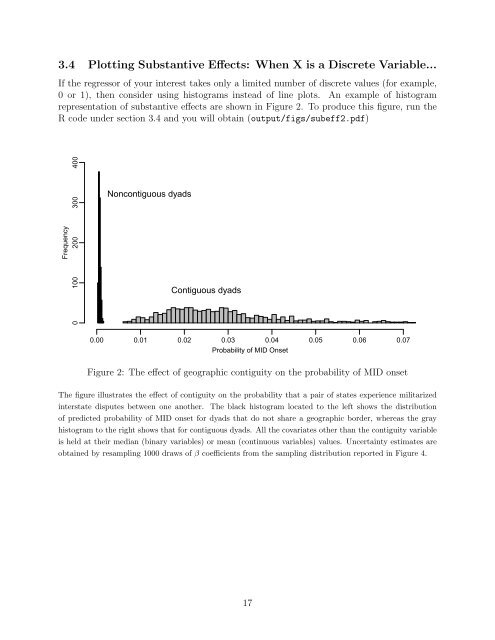
Figure 2: The effect of geographic contiguity on the probability of MID onset<br />
The figure illustrates the effect of contiguity on the probability that a pair of states experience militarized<br />
interstate disputes between one another. The black histogram located to the left shows the distribution<br />
of predicted probability of MID onset for dyads that do not share a geographic border, whereas the gray<br />
histogram to the right shows that for contiguous dyads. All the covariates other than the contiguity variable<br />
is held at their median (binary variables) or mean (continuous variables) values. Uncertainty estimates are<br />
obtained by resampling 1000 draws of β coefficients from the sampling distribution reported in Figure 4.<br />
17