

Service Management Buyers Guide 2010 - daruMath
Service Management Buyers Guide 2010 - daruMath
Service Management Buyers Guide 2010 - daruMath

Create successful ePaper yourself
Turn your PDF publications into a flip-book with our unique Google optimized e-Paper software.
SERVICE MANAGEMENT<br />
Digital EDition 04<br />
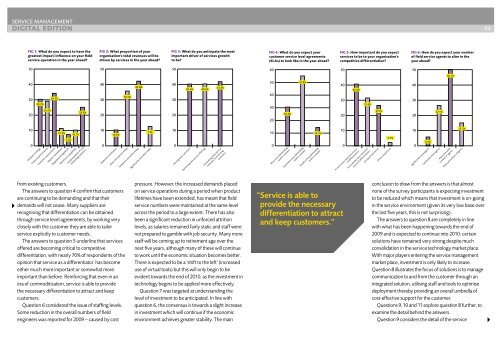
FIG 1: What do you expect to have the<br />
greatest impact/influence on your field<br />
service operation in the year ahead?<br />
50<br />
40<br />
30<br />
20<br />
10<br />
0<br />
30.2%<br />
Company strategy<br />
29.5%<br />
Financial performance<br />
34.5%<br />
Customer requirements<br />
12.2%<br />
7.2%<br />
10.1%<br />
25.9%<br />
Market competition<br />
Regulation & legislation<br />
Workforce capabilities<br />
Implementation of new<br />
technology/solutions<br />
from existing customers.<br />
The answers to question 4 confirm that customers<br />
are continuing to be demanding and that their<br />
demands will not cease. Many suppliers are<br />
recognising that differentiation can be obtained<br />
through service level agreements, by working very<br />
closely with the customer they are able to tailor<br />
service explicitly to customer needs.<br />
The answers to question 5 underline that services<br />
offered are becoming critical to competitive<br />
differentiation, with nearly 70% of respondents of the<br />
opinion that service as a differentiator has become<br />
either much more important or somewhat more<br />
important than before. Reinforcing that even in an<br />
era of commoditisation, service is able to provide<br />
the necessary differentiation to attract and keep<br />
customers.<br />
Question 6 considered the issue of staffing levels.<br />
Some reduction in the overall numbers of field<br />
engineers was reported for 2009 – caused by cost<br />
FIG 2: What proportion of your<br />
organisation’s total revenues will be<br />
driven by services in the year ahead?<br />
50<br />
40<br />
30<br />
20<br />
10<br />
0<br />
10.9%<br />
Reduced contribution<br />
35.5%<br />
About the same as today<br />
42.8%<br />
Somewhat more than today<br />
13%<br />
Significantly more than today<br />
FIG 3: What do you anticipate the most<br />
important driver of services growth<br />
to be?<br />
50<br />
40<br />
30<br />
20<br />
10<br />
0<br />
Serving new customers<br />
40.6% 40.6%<br />
Delivering new service offerings<br />
41.4%<br />
Generating more service<br />
revenues from existing<br />
customers<br />
pressure. However, the increased demands placed<br />
on service operations during a period when product<br />
lifetimes have been extended, has meant that field<br />
service numbers were maintained at the same level<br />
across the period to a large extent. There has also<br />
been a significant reduction in unforced attrition<br />
levels, as salaries remained fairly static and staff were<br />
not prepared to gamble with job security. Many more<br />
staff will be coming up to retirement age over the<br />
next five years, although many of these will continue<br />
to work until the economic situation becomes better.<br />
There is expected to be a ‘shift to the left’ (increased<br />
use of virtual tools) but this will only begin to be<br />
evident towards the end of <strong>2010</strong>, as the investment in<br />
technology begins to be applied more effectively.<br />
Question 7 was targeted at understanding the<br />
level of investment to be anticipated. In line with<br />
question 6, the consensus is towards a slight increase<br />
in investment which will continue if the economic<br />
environment achieves greater stability. The main<br />
FIG 4: What do you expect your<br />
customer service level agreements<br />
(SLAs) to look like in the year ahead?<br />
60<br />
50<br />
40<br />
30<br />
20<br />
10<br />
0<br />
30.4%<br />
Much more demanding<br />
and/or complex<br />
55.8%<br />
Somewhat more demanding<br />
and/or complex<br />
14.5%<br />
Equally or less demanding<br />
and/or complex<br />
“<strong>Service</strong> is able to<br />
provide the necessary<br />
differentiation to attract<br />
and keep customers.”<br />
FIG 5: How important do you expect<br />
services to be to your organisation’s<br />
competitive differentiation?<br />
50<br />
40<br />
30<br />
20<br />
10<br />
0<br />
40.6%<br />
31.6%<br />
27.1%<br />
A much more important source<br />
of differentiation<br />
A somewhat more important<br />
source of differentiation<br />
Of equal importance<br />
2.3%<br />
Of less importance<br />
FIG 6: How do you expect your number<br />
of field service agents to alter in the<br />
year ahead?<br />
50<br />
40<br />
30<br />
20<br />
10<br />
0<br />
6.5%<br />
Significantly more agents<br />
27.5%<br />
Somewhat more agents<br />
50.7%<br />
About the same<br />
number of agents<br />
15.2%<br />
Reduced number of agents<br />
conclusion to draw from the answers is that almost<br />
none of the survey participants is expecting investment<br />
to be reduced which means that investment is on-going<br />
in the service environment (given its very low base over<br />
the last five years, this is not surprising).<br />
The answers to question 8 are completely in line<br />
with what has been happening towards the end of<br />
2009 and is expected to continue into <strong>2010</strong>: certain<br />
solutions have remained very strong despite much<br />
consolidation in the service technology market place.<br />
With major players entering the service management<br />
market place, investment is only likely to increase.<br />
Question 8 illustrates the focus of solutions is to manage<br />
communication to and from the customer through an<br />
integrated solution, utilising staff and tools to optimise<br />
deployment thereby providing an overall umbrella of<br />
cost-effective support for the customer.<br />
Questions 9, 10 and 11 explore question 8 further, to<br />
examine the detail behind the answers.<br />
Question 9 considers the detail of the service