Community Health Index - Lithium
Community Health Index - Lithium
Community Health Index - Lithium

You also want an ePaper? Increase the reach of your titles
YUMPU automatically turns print PDFs into web optimized ePapers that Google loves.
using the community<br />
health index as a<br />
community standard<br />
As noted earlier, community health factors provide diagnostic<br />
and predictive information useful in measuring community<br />
health. Viewed either as a snapshot or mapped over time,<br />
these factors reveal a great deal about an online community.<br />
To account for factors such as community size, age, and<br />
volatility, we apply a series of smoothing and normalization<br />
algorithms to enable communities of all types to use a single<br />
formulation of the <strong>Community</strong> <strong>Health</strong> <strong>Index</strong>.<br />
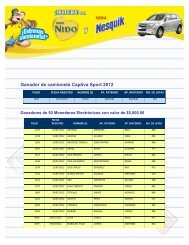
The three <strong>Community</strong> <strong>Health</strong> <strong>Index</strong> (CHI) compass diagrams<br />
below show healthy communities with the distinctly different<br />
profiles that are characteristic of support, engagement, and<br />
listening communities. Listening communities include both<br />
support and engagement elements. Although their profiles<br />
are different, all are healthy communities. These diagrams<br />
present a snapshot of health factors for a given period (in this<br />
case one week) as a relative percentage of the community’s<br />
highest scores. For the purposes of illustration, the Predictive<br />
and Diagnostic factors are normalized separately to make the<br />
different profiles easier to identify.<br />
The <strong>Community</strong> <strong>Health</strong> <strong>Index</strong> is on a scale of 0 to<br />
1000. The higher the number, the healthier the<br />
community and the more likely it will accomplish the<br />
goals of the members and the company. Regardless<br />
of a community’s score, there is always room for<br />
improvement and the individual health factors tell you<br />
exactly where to focus.<br />
6 1<br />
5 2<br />
4 S1 3<br />
6 1<br />
5 2<br />
4 L1 3<br />
1. Members - 2. Content - 3. Traffic - 4. Liveliness<br />
5. Interaction - 6. Responsiveness<br />
6 1<br />
share this whitepaper<br />
5 2<br />
4 E1 3<br />
In the sample support community (S1), the three predictive<br />
factors—Responsiveness, Interaction, and Liveliness—are<br />
balanced. In the sample, engagement (E1) and listening (L1)<br />
communities, Interaction and Liveliness are characteristically<br />
higher than Responsiveness.<br />
Simple CHI trend analysis, coupled with the ability to drill<br />
down to the individual health factors, provides an early<br />
warning of potentially serious problems within a community.<br />
It is important to note that a single health factor, like a single<br />
metric, doesn’t present the whole picture. Instead, community<br />
managers should consider the <strong>Community</strong> <strong>Health</strong> <strong>Index</strong> in<br />
conjunction with the individual health factors. As the graphs<br />
that follow show, a community can weather the decline in<br />
one or two health factors and remain healthy when the other<br />
factors are stable or improving.<br />
7