Total body fat does not influence maximal aerobic capacity
Total body fat does not influence maximal aerobic capacity
Total body fat does not influence maximal aerobic capacity

You also want an ePaper? Increase the reach of your titles
YUMPU automatically turns print PDFs into web optimized ePapers that Google loves.
844<br />
Table 1 Correlation coef®cients for the relationship between<br />
<strong>maximal</strong> oxygen consumption (l=min) and other variables in 129<br />
children in Study 1<br />
Independent variable Simple r<br />
Partial r (adjusting<br />
for FFM, gender<br />
and ethnicity)<br />
Fat-free mass (kg) 0.87 (P < 0.0001) Ð<br />
Weight (kg) 0.78 (P < 0.0001) NS<br />
Height (m) 0.75 (P < 0.0001) NS<br />
Resting oxygen<br />
consumption (l=min)<br />
0.72 (P < 0.0001) NS<br />
Sub-<strong>maximal</strong> oxygen 0.69 (P < 0.0001) 0.29 (P < 0.05)<br />
consumption (l=min)<br />
Fat mass (kg) 0.66 (P < 0.0001) NS<br />
Body mass index (kg=m 2 ) 0.61 (P < 0.0001) NS<br />
Age (y) 0.59 (P < 0.0001) NS<br />
NS ˆ <strong>not</strong> signi®cant.<br />
(r ˆ 0.66), BMI (r ˆ 0.61) and age (r ˆ 0.59). However,<br />
after adjusting for FFM, gender and ethnicity,<br />
only sub-<strong>maximal</strong> oxygen consumption remained signi®cantly<br />
related to <strong>maximal</strong> oxygen consumption<br />
(r ˆ 0.29; Table 1).<br />
For the regression between <strong>maximal</strong> oxygen consumption<br />
(VO 2max l=min) and FFM, the intercept was<br />
<strong>not</strong> signi®cantly different from zero (VO 2max ˆ<br />
0.063 <strong>fat</strong> free mass 7 0.12 l=min), implying that<br />
VO2max divided by FFM (ml=(FFM min)) is a valid<br />
ratio for comparing VO2max in children of different<br />
<strong>body</strong> size. For the regression between <strong>maximal</strong><br />
oxygen consumption (VO2max l=min) and <strong>body</strong><br />
weight, the intercept was signi®cantly different from<br />
zero (VO 2max ˆ 0.021 <strong>body</strong> weight ‡ 0.56 l=min),<br />
implying that VO 2max divided by <strong>body</strong> weight may<br />
<strong>not</strong> be a valid ratio for comparing VO2max in children<br />
of different <strong>body</strong> size.<br />
The children were separated into lean ( < 20% <strong>body</strong><br />
<strong>fat</strong>) and obese ( > 30% <strong>body</strong> <strong>fat</strong>) as shown in Table 2.<br />
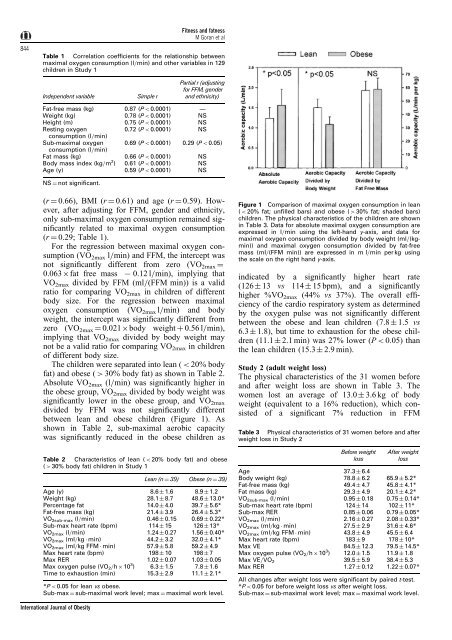
Absolute VO2max (l=min) was signi®cantly higher in<br />
the obese group, VO2max divided by <strong>body</strong> weight was<br />
signi®cantly lower in the obese group, and VO 2max<br />
divided by FFM was <strong>not</strong> signi®cantly different<br />
between lean and obese children (Figure 1). As<br />
shown in Table 2, sub-<strong>maximal</strong> <strong>aerobic</strong> <strong>capacity</strong><br />
was signi®cantly reduced in the obese children as<br />
Table 2 Characteristics of lean ( < 20% <strong>body</strong> <strong>fat</strong>) and obese<br />
( > 30% <strong>body</strong> <strong>fat</strong>) children in Study 1<br />
Lean (n ˆ 39) Obese (n ˆ 39)<br />
Age (y) 8.6 1.6 8.9 1.2<br />
Weight (kg) 28.1 8.7 48.6 13.0*<br />
Percentage <strong>fat</strong> 14.0 4.0 39.7 5.6*<br />
Fat-free mass (kg) 21.4 3.9 26.4 5.3*<br />
VO 2sub-max (l=min) 0.46 0.15 0.69 0.22*<br />
Sub-max heart rate (bpm) 114 15 126 13*<br />
VO2max (l=min) 1.24 0.27 1.56 0.40*<br />
VO2max (ml=kg min) 44.2 3.2 32.0 4.1*<br />
VO 2max (ml=kg FFM min) 57.9 5.8 59.2 4.9<br />
Max heart rate (bpm) 198 10 198 7<br />
Max RER 1.02 0.07 1.03 0.05<br />
Max oxygen pulse (VO2=h 10 3 ) 6.3 1.5 7.8 1.6<br />
Time to exhaustion (min) 15.3 2.9 11.1 2.1*<br />
*P < 0.05 for lean vs obese.<br />
Sub-max ˆ sub-<strong>maximal</strong> work level; max ˆ <strong>maximal</strong> work level.<br />
International Journal of Obesity<br />
Fitness and <strong>fat</strong>ness<br />
M Goran et al<br />
Figure 1 Comparison of <strong>maximal</strong> oxygen consumption in lean<br />
( < 20% <strong>fat</strong>; un®lled bars) and obese ( > 30% <strong>fat</strong>; shaded bars)<br />
children. The physical characteristics of the children are shown<br />
in Table 3. Data for absolute <strong>maximal</strong> oxygen consumption are<br />
expressed in l=min using the left-hand y-axis, and data for<br />
<strong>maximal</strong> oxygen consumption divided by <strong>body</strong> weight (ml=(kgmin))<br />
and <strong>maximal</strong> oxygen consumption divided by <strong>fat</strong>-free<br />
mass (ml=(FFM min)) are expressed in m l=min per kg using<br />
the scale on the right hand y-axis.<br />
indicated by a signi®cantly higher heart rate<br />
(126 13 vs 114 15 bpm), and a signi®cantly<br />
higher %VO 2max (44% vs 37%). The overall ef®ciency<br />
of the cardio respiratory system as determined<br />
by the oxygen pulse was <strong>not</strong> signi®cantly different<br />
between the obese and lean children (7.8 1.5 vs<br />
6.3 1.8), but time to exhaustion for the obese children<br />
(11.1 2.1 min) was 27% lower (P < 0.05) than<br />
the lean children (15.3 2.9 min).<br />
Study 2 (adult weight loss)<br />
The physical characteristics of the 31 women before<br />
and after weight loss are shown in Table 3. The<br />
women lost an average of 13.0 3.6 kg of <strong>body</strong><br />
weight (equivalent to a 16% reduction), which consisted<br />
of a signi®cant 7% reduction in FFM<br />
Table 3 Physical characteristics of 31 women before and after<br />
weight loss in Study 2<br />
Before weight<br />
loss<br />
After weight<br />
loss<br />
Age 37.3 6.4<br />
Body weight (kg) 78.8 6.2 65.9 5.2*<br />
Fat-free mass (kg) 49.4 4.7 45.8 4.1*<br />
Fat mass (kg) 29.3 4.9 20.1 4.2*<br />
VO2sub-max (l=min) 0.95 0.18 0.75 0.14*<br />
Sub-max heart rate (bpm) 124 14 102 11*<br />
Sub-max RER 0.85 0.06 0.79 0.05*<br />
VO 2max (l=min) 2.16 0.27 2.08 0.33*<br />
VO 2max (ml=kg min) 27.5 2.9 31.6 4.6*<br />
VO 2max (ml=kg FFM min) 43.8 4.9 45.5 6.4<br />
Max heart rate (bpm) 183 9 178 10*<br />
Max VE 84.5 12.3 79.5 14.5*<br />
Max oxygen pulse (VO2=h 10 3 ) 12.0 1.5 11.9 1.8<br />
Max VE=VO2 39.5 5.9 38.4 5.3<br />
Max RER 1.27 0.12 1.22 0.07*<br />
All changes after weight loss were signi®cant by paired t-test.<br />
*P < 0.05 for before weight loss vs after weight loss.<br />
Sub-max ˆ sub-<strong>maximal</strong> work level; max ˆ <strong>maximal</strong> work level.