Total body fat does not influence maximal aerobic capacity
Total body fat does not influence maximal aerobic capacity
Total body fat does not influence maximal aerobic capacity

You also want an ePaper? Increase the reach of your titles
YUMPU automatically turns print PDFs into web optimized ePapers that Google loves.
(3.6 3.4 kg) and a signi®cant 31% reduction in <strong>fat</strong><br />
mass (9.2 3.3 kg).<br />
Absolute VO 2max expressed as l=min, decreased<br />
signi®cantly by 3.7% after weight loss. VO 2max<br />
divided by <strong>body</strong> weight increased signi®cantly by<br />
15% after weight loss from 27.5 2.9 to<br />
31.6 4.6 ml=kg min and VO2max adjusted for FFM<br />
(ml=kg FFM min) was unchanged after weight loss<br />
(Figure 2). As shown in Figure 3, the relationship<br />
between VO2max (21 l=min) and FFM was identical<br />
before and after weight loss.<br />
For the regression between VO 2max (l=min) and<br />
FFM, the intercept was <strong>not</strong> signi®cantly different<br />
from zero either in the obese state (VO2max ˆ<br />
0.053 FFM 7 0.38 l=min) nor in the normal weight<br />
state (VO2max ˆ 0.052 FFM 7 0.29 l=min), and the<br />
slopes were <strong>not</strong> signi®cantly different before or after<br />
weight loss (Figure 3). This would imply that VO2max<br />
divided by FFM (ml=kg FFM min) is a valid ratio for<br />
comparing VO 2max in adults of different <strong>body</strong> size and<br />
<strong>body</strong> <strong>fat</strong> composition. For the regression between<br />
VO2max (l=min) and <strong>body</strong> weight, the intercepts<br />
were also <strong>not</strong> signi®cantly different from zero either<br />
in the obese state (VO2max ˆ 0.025 <strong>body</strong><br />
weight ‡ 0.24 l=min) nor in the normal weight state<br />
(VO2max ˆ 0.04 <strong>body</strong> weight 7 0.19 l=min); however,<br />
the regression slopes were signi®cantly different<br />
before and after weight loss. Due to the different<br />
regression slopes before and after weight loss, the<br />
VO2max to <strong>body</strong> weight ratio is <strong>not</strong> a good tool for data<br />
comparison.<br />
VO2max (ml=kg FFM min) was <strong>not</strong> signi®cantly<br />
different when the women were in the overweight<br />
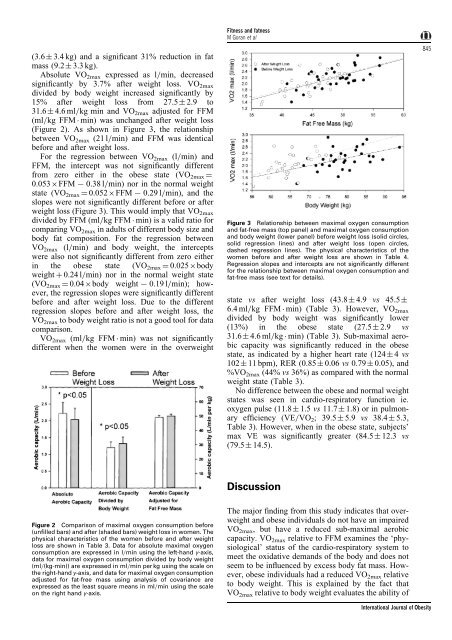
Figure 2 Comparison of <strong>maximal</strong> oxygen consumption before<br />
(un®lled bars) and after (shaded bars) weight loss in women. The<br />
physical characteristics of the women before and after weight<br />
loss are shown in Table 3. Data for absolute <strong>maximal</strong> oxygen<br />
consumption are expressed in l=min using the left-hand y-axis,<br />
data for <strong>maximal</strong> oxygen consumption divided by <strong>body</strong> weight<br />
(ml=(kg-min)) are expressed in ml=min per kg using the scale on<br />
the right-hand y-axis, and data for <strong>maximal</strong> oxygen consumption<br />
adjusted for <strong>fat</strong>-free mass using analysis of covariance are<br />
expressed as the least square means in ml=min using the scale<br />
on the right hand y-axis.<br />
Fitness and <strong>fat</strong>ness<br />
M Goran et al<br />
Figure 3 Relationship between <strong>maximal</strong> oxygen consumption<br />
and <strong>fat</strong>-free mass (top panel) and <strong>maximal</strong> oxygen consumption<br />
and <strong>body</strong> weight (lower panel) before weight loss (solid circles,<br />
solid regression lines) and after weight loss (open circles,<br />
dashed regression lines). The physical characteristics of the<br />
women before and after weight loss are shown in Table 4.<br />
Regression slopes and intercepts are <strong>not</strong> signi®cantly different<br />
for the relationship between <strong>maximal</strong> oxygen consumption and<br />
<strong>fat</strong>-free mass (see text for details).<br />
state vs after weight loss (43.8 4.9 vs 45.5<br />
6.4 ml=kg FFM min) (Table 3). However, VO2max<br />
divided by <strong>body</strong> weight was signi®cantly lower<br />
(13%) in the obese state (27.5 2.9 vs<br />
31.6 4.6 ml=kg min) (Table 3). Sub-<strong>maximal</strong> <strong>aerobic</strong><br />
<strong>capacity</strong> was signi®cantly reduced in the obese<br />
state, as indicated by a higher heart rate (124 4 vs<br />
102 11 bpm), RER (0.85 0.06 vs 0.79 0.05), and<br />
%VO2max (44% vs 36%) as compared with the normal<br />
weight state (Table 3).<br />
No difference between the obese and normal weight<br />
states was seen in cardio-respiratory function ie.<br />
oxygen pulse (11.8 1.5 vs 11.7 1.8) or in pulmonary<br />
ef®ciency (VE=VO 2; 39.5 5.9 vs 38.4 5.3,<br />
Table 3). However, when in the obese state, subjects'<br />
max VE was signi®cantly greater (84.5 12.3 vs<br />
(79.5 14.5).<br />
Discussion<br />
The major ®nding from this study indicates that overweight<br />
and obese individuals do <strong>not</strong> have an impaired<br />
VO2max, but have a reduced sub-<strong>maximal</strong> <strong>aerobic</strong><br />
<strong>capacity</strong>. VO2max relative to FFM examines the `physiological'<br />
status of the cardio-respiratory system to<br />
meet the oxidative demands of the <strong>body</strong> and <strong>does</strong> <strong>not</strong><br />
seem to be in¯uenced by excess <strong>body</strong> <strong>fat</strong> mass. However,<br />
obese individuals had a reduced VO2max relative<br />
to <strong>body</strong> weight. This is explained by the fact that<br />
VO 2max relative to <strong>body</strong> weight evaluates the ability of<br />
845<br />
International Journal of Obesity