

ING (L) RENTA FUND - ING Investment Management, Asia Pacific
ING (L) RENTA FUND - ING Investment Management, Asia Pacific
ING (L) RENTA FUND - ING Investment Management, Asia Pacific

Create successful ePaper yourself
Turn your PDF publications into a flip-book with our unique Google optimized e-Paper software.
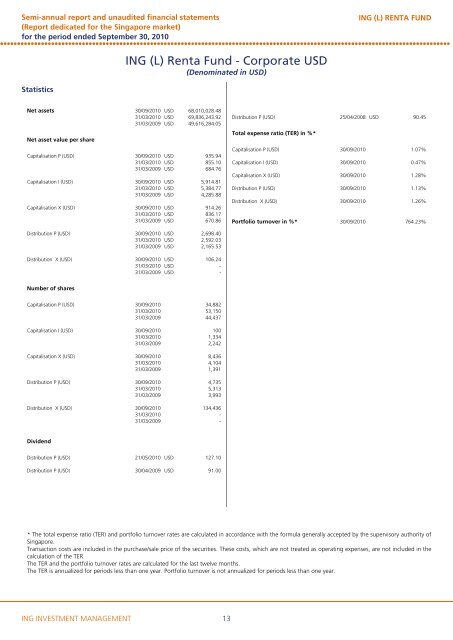
Semi-annual report and unaudited financial statements<br />
(Report dedicated for the Singapore market)<br />
for the period ended September 30, 2010<br />
<strong>ING</strong> (L) Renta Fund - Corporate USD<br />
(Denominated in USD)<br />
<strong>ING</strong> (L) <strong>RENTA</strong> <strong>FUND</strong><br />
������������������������������������������������������������������������������������������������������������������������������������<br />
Statistics<br />
Net assets 30/09/2010 USD 68,010,028.48<br />
31/03/2010 USD 69,836,243.92<br />
31/03/2009 USD 49,616,284.05<br />
Net asset value per share<br />
Capitalisation P (USD) 30/09/2010 USD<br />
935.94<br />
31/03/2010 USD<br />
855.10<br />
31/03/2009 USD<br />
684.76<br />
Capitalisation I (USD) 30/09/2010 USD<br />
5,914.81<br />
31/03/2010 USD<br />
5,384.77<br />
31/03/2009 USD<br />
4,285.88<br />
Capitalisation X (USD) 30/09/2010 USD<br />
914.26<br />
31/03/2010 USD<br />
836.17<br />
31/03/2009 USD<br />
670.86<br />
Distribution P (USD) 30/09/2010 USD<br />
2,698.40<br />
31/03/2010 USD<br />
2,592.03<br />
31/03/2009 USD<br />
2,165.53<br />
Distribution X (USD) 30/09/2010 USD<br />
106.24<br />
31/03/2010 USD<br />
-<br />
31/03/2009 USD<br />
-<br />
Number of shares<br />
Capitalisation P (USD) 30/09/2010<br />
34,882<br />
31/03/2010<br />
53,150<br />
31/03/2009<br />
44,437<br />
Capitalisation I (USD) 30/09/2010<br />
100<br />
31/03/2010<br />
1,334<br />
31/03/2009<br />
2,242<br />
Capitalisation X (USD) 30/09/2010<br />
8,436<br />
31/03/2010<br />
4,104<br />
31/03/2009<br />
1,391<br />
Distribution P (USD) 30/09/2010<br />
4,735<br />
31/03/2010<br />
5,313<br />
31/03/2009<br />
3,993<br />
Distribution X (USD) 30/09/2010<br />
134,436<br />
31/03/2010<br />
-<br />
31/03/2009<br />
-<br />
Dividend<br />
Distribution P (USD) 21/05/2010 USD<br />
127.10<br />
Distribution P (USD) 30/04/2009 USD<br />
91.00<br />
* The total expense ratio (TER) and portfolio turnover rates are calculated in accordance with the formula generally accepted by the supervisory authority of<br />
Singapore.<br />
Transaction costs are included in the purchase/sale price of the securities. These costs, which are not treated as operating expenses, are not included in the<br />
calculation of the TER.<br />
The TER and the portfolio turnover rates are calculated for the last twelve months.<br />
The TER is annualized for periods less than one year. Portfolio turnover is not annualized for periods less than one year.<br />
<strong>ING</strong> INVESTMENT MANAGEMENT<br />
13<br />
Distribution P (USD) 25/04/2008 USD<br />
90.45<br />
Total expense ratio (TER) in %*<br />
Capitalisation P (USD) 30/09/2010<br />
1.07%<br />
Capitalisation I (USD) 30/09/2010<br />
0.47%<br />
Capitalisation X (USD) 30/09/2010<br />
1.28%<br />
Distribution P (USD) 30/09/2010<br />
1.13%<br />
Distribution X (USD) 30/09/2010<br />
1.26%<br />
Portfolio turnover in %* 30/09/2010 764.23%
