Sub-Saharan Africa Stock Markets 2011 Review & 2012 ... - Imara
Sub-Saharan Africa Stock Markets 2011 Review & 2012 ... - Imara
Sub-Saharan Africa Stock Markets 2011 Review & 2012 ... - Imara
- TAGS
- africa
- stock
- markets
- imara
- www.imara.co

Create successful ePaper yourself
Turn your PDF publications into a flip-book with our unique Google optimized e-Paper software.
<strong>Sub</strong>-<strong>Saharan</strong> <strong>Africa</strong> <strong>Stock</strong> <strong>Markets</strong> <strong>2011</strong> <strong>Review</strong> & <strong>2012</strong> Outlook<br />
February <strong>2012</strong><br />
Analysts:<br />
Addmore Chakurira Aobakwe Mokgethi Batanai Matsika Belvas Otieno<br />
addmore.chakurira@imara.co aobakwe@capital.bw batanai.matsika@imara.co belvas.otieno@imara.co<br />
Brian Mugabe Farai Vengesai Jimmy Mwambazi Nontando Sibanda Zunga<br />
brian.mugabe@imara.co farai.vengesai@imara.co jmwambazi@stockbrokerszambia.com.zm nontando.zunga@imara.co<br />
www.imara.co
Table of Contents<br />
Executive Summary ...........................................................................................2<br />
Botswana ...................................................................................................... 4<br />
BRVM ........................................................................................................... 7<br />
Ghana .......................................................................................................... 9<br />
Kenya ......................................................................................................... 11<br />
Malawi ........................................................................................................ 14<br />
Mauritius ..................................................................................................... 17<br />
Namibia ....................................................................................................... 19<br />
Nigeria ........................................................................................................ 21<br />
Rwanda ....................................................................................................... 24<br />
Uganda ........................................................................................................ 25<br />
Tanzania ...................................................................................................... 27<br />
Zambia ........................................................................................................ 29<br />
Zimbabwe .................................................................................................... 32<br />
<strong>Imara</strong> Contact Details ...................................................................................... 35
Q2<br />
After a solid recovery by the bulk of <strong>Africa</strong>’s major<br />
frontier markets in 2010, led by the Uganda <strong>Stock</strong><br />
Exchange which returned 33.81% in USD terms, risk<br />
aversion were the buzzwords in <strong>2011</strong>, as concerns<br />
surrounding the Eurozone debt crisis and the advent of<br />
the “Arab Spring” all led to foreign investors taking a<br />
very cautious view of the continent. Local investors<br />
were also wary of equities, especially as monetary<br />
tightening in Nigeria and East <strong>Africa</strong> due to rising<br />
inflation and attempts by the central banks in these<br />
countries to shore up their currencies, meant that<br />
fixed income securities were relatively more attractive<br />
as the year progressed.<br />
Of the twelve main indices covered in this report,<br />
(Rwanda is yet to introduce an index), just five closed the<br />
year in the black in USD terms, two marginally so, while<br />
seven closed weaker. Comparatively, eight exchanges<br />
closed firmer in 2010.<br />
The top performer was the Lusaka <strong>Stock</strong> Exchange, LuSE-<br />
ASI, which was up 15.79% in USD returns. This<br />
performance was led by Puma Energy, Bata Shoe Company<br />
and <strong>Africa</strong>n Explosives, which all recorded USD price gains<br />
in excess of 100% over the year. Tanzania’s DSEI was the<br />
second best in USD terms, although some way behind the<br />
LuSE with a 5.14% return, followed by Namibia’s NSX-<br />
Local with a 3.62% return. Both performed far better in<br />
local currency terms, with the DSEI up 11.97% and the<br />
NSX-Local up 28.06%, but dollar strength diluted the hard<br />
currency returns.<br />
In a sharp reversal of fortunes, Kenya and Uganda were at<br />
the bottom of the pile in <strong>2011</strong>, having headed the table in<br />
2010. The NSE-20 shed 32.52% in USD terms, while the<br />
closely linked USE-ALSI showed a very similar decline of<br />
32.17%. Politics and the impact of the drought in East<br />
<strong>Africa</strong> weighed negatively on sentiment in these markets<br />
during the year. Nigeria’s NSE-ASI was the third worst<br />
performer, down 20.35% in USD terms. Politics again<br />
played a role, as Nigeria held its presidential elections<br />
during the year, while concerns around the resolution of<br />
the banking sector crisis also had a negative bearing.<br />
With SSA’s more liquid markets now driven to a large<br />
extent by foreign investors (which unfortunately has<br />
somewhat increased their correlation to developed<br />
markets), we expect the Eurozone debt crisis to play a<br />
large role in determining risk appetite for emerging and<br />
frontier markets. With low interest rates in the developed<br />
world and quantitative easing still a reality, a resolution<br />
of the Eurozone issues should see the search for yield find<br />
its way to SSA. Fundamentally, <strong>Africa</strong>’s prospects remain<br />
relatively bullish, with the World Bank anticipating real<br />
GDP growth for the region of 5.3% and 5.6% for <strong>2012</strong>/13<br />
respectively, against global forecasts of 2.5% and 3.1%.<br />
2<br />
Source: IAS/<strong>Stock</strong> Exchanges<br />
1.5<br />
1.4<br />
1.3<br />
1.2<br />
1.1<br />
1<br />
0.9<br />
0.8<br />
0.7<br />
0.6<br />
0.5<br />
3-Jan-11<br />
2-Feb-11<br />
4-Mar-11<br />
3-Apr-11<br />
EQUITY RESEARCH<br />
AFRICA<br />
FEBRUARY <strong>2012</strong><br />
<strong>2011</strong> REVIEW AND <strong>2012</strong> OUTLOOK<br />
Index Open Close % Change (LC) % Change (USD)<br />
LuSE - ASI 3 322.47 4 040.35 21.61% 15.79%<br />
DSEI 1 163.89 1 303.23 11.97% 5.14%<br />
NSX - Local 172.72 221.19 28.06% 3.62%<br />
M SE-DSI 3 922.61 4 238.39<br />
8.05% 0.35%<br />
Semdex 1 967.45 1 888.38 -4.02% 0.09%<br />
ZSE-Industrials 151.27 145.86 -3.58% -3.58%<br />
BSE-DCI 6 412.94 6 970.94<br />
8.70% -6.57%<br />
GSE-Composite 1 000.00 969.03 -3.10% -11.33%<br />
BRVM -Composite 159.10 138.88 -12.71% -14.85%<br />
NSE-ASI 24 770.52 20 730.63 -16.31% -20.35%<br />
USE-ALSI 1 188.07 864.45 -27.24% -32.17%<br />
NSE-20 4 432.60 3 205.02 -27.69% -32.52%<br />
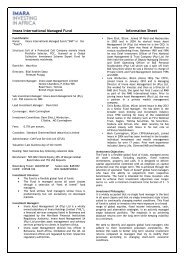
Growth in SSA closes in on pre-GFC average…<br />
Source: World Bank<br />
Various S&P indices relative to S&P <strong>Africa</strong> Frontier Index <strong>2011</strong><br />
3-May-11<br />
Source: IAS/Standard & Poors<br />
2-Jun-11<br />
S&P 500 S&P Euro 350 S&P Bric 40<br />
2-Jul-11<br />
S&P Latin America 40 S&P Asia 50 S&P <strong>Africa</strong> Frontier<br />
1-Aug-11<br />
31-Aug-11<br />
30-Sep-11<br />
30-Oct-11<br />
29-Nov-11<br />
29-Dec-11
SSA Movers and Shakers <strong>2011</strong><br />
TOP 20 GAINERS (USD Terms) BOTTOM 20 LOSERS (USD Terms)<br />
Company Country % change Company Country % change<br />
Fidelity Zimbabwe 700.00% Chemco Zimbabwe -93.33%<br />
Pelhams Zimbabwe 466.67% Zeco Zimbabwe -93.33%<br />
PBL Mauritius 443.23% Star <strong>Africa</strong> Zimbabwe -85.71%<br />
TN Holdings Zimbabwe 421.57% Paints & Coatings Nigeria -85.30%<br />
Cafca Zimbabwe 294.12% G4S Botswana -83.83%<br />
Puma Energy Zambia 239.63% PZ Cussons Ghana -81.73%<br />
Truworths Zimbabwe 179.41% Rio Zim Zimbabwe -81.58%<br />
Roads Nigeria Nigeria 174.23% Bindura Zimbabwe -80.77%<br />
Bralirwa Rwanda 140.20% Diamond Bank Nigeria -75.68%<br />
Union Bank Nigeria 139.73% Fidson Healthcare Nigeria -75.48%<br />
Bata Zambia 138.03% Gulliver Zimbabwe -75.00%<br />
ZBFH Zimbabwe 135.29% Paladin Energy Limited Namibia -73.75%<br />
Nictus Namibia 130.12% CCNN Nigeria -73.33%<br />
RTG Zimbabwe 123.08% UBA Nigeria -73.11%<br />
DCB Tanzania 114.11% Trust Bank Ghana -72.52%<br />
ABC Holdings Zimbabwe 111.11% Dangote Sugar Nigeria -72.10%<br />
AELZ Zambia 110.42% Dangote Flour Mills Nigeria -71.73%<br />
SOGB BRVM 96.09% DN Meyer Nigeria -71.04%<br />
Capital Hotel Nigeria 95.15% Afribank Nigeria -70.81%<br />
FBCH Zimbabwe 85.71% Bank PHB Nigeria -70.15%<br />
TOP 20 VOLUME TRADED TOP 20 VALUE TRADED<br />
Company Country Volume (m) Company Country Value (USD m)<br />
Transcorp Nigeria 8,317 Zenith Bank Nigeria 589.16<br />
Zenith Bank Nigeria 6,424 GT Bank Nigeria 446.69<br />
UBA Nigeria 4,942 First Bank of Nigeria Nigeria 399.39<br />
First Bank of Nigeria Nigeria 4,880 Nigerian Breweries Nigeria 231.36<br />
GT Bank Nigeria 4,460 Oando Nigeria 169.32<br />
Access Bank Nigeria 3,331 UBA Nigeria 168.23<br />
Safaricom Kenya 3,196 Access Bank Nigeria 154.56<br />
Diamond Bank Nigeria 2,711 Safaricom Kenya 133.42<br />
Fidelity Bank Nigeria 2,648 Vivo Energy Mauritius 131.73<br />
Finbank Nigeria 2,523 MCB Mauritius 131.17<br />
Oceanic Bank Nigeria 1,603 Guinness Nigeria Nigeria 130.72<br />
Skye Bank Nigeria 1,470 Equity Bank Kenya 119.28<br />
Unity Bank Nigeria 1,451 EABL Kenya 111.05<br />
TNM Malawi 1,446 Nestle Nigeria Nigeria 107.12<br />
Intercontinental Bank Nigeria 1,357 Econet Zimbabwe 104.66<br />
FCMB Nigeria 1,108 Flour Mills Nigeria 102.21<br />
Bank PHB Nigeria 1,106 KCB Kenya 100.03<br />
Japaul Oil Nigeria 1,105 Diamond Bank Nigeria 93.28<br />
Sterling Bank Nigeria 1,077 Puma Energy Zambia 92.48<br />
N.E.M Insurance Nigeria 1,065 Dangote Cement Nigeria 83.41<br />
3
On a y-o-y basis, Botswana’s economy grew by 12.4%<br />
driven mainly by both the mining and non-mining sectors.<br />
It against A subsidiary this back of drop the Imar that total credit extended by<br />
commercial banks increased to USD 3.64bn from 2.83bn<br />
in the previous year, thus reflecting this recovery in<br />
economic performance. The market was largely driven by<br />
the banking sector during the year, but despite this, the<br />
stock exchange ended the year with a negative return in<br />
USD terms. However, in BWP terms, the stock exchange<br />
recorded a positive return.<br />
GDP figures for the 1 st quarter ended June <strong>2011</strong> indicated<br />
that, q-o-q, the economy contracted by 2.2%, mainly due to<br />
lower output in the mining (-4.2%), financial and business<br />
services (-6.1%) and general government sectors (-7.6%).<br />
However, on a y-o-y basis, the economy grew by 6.4%,<br />
reflecting recovery of both the mining and non-mining<br />
sectors. Mining grew by 7.2%, while there was also strong<br />
growth in agriculture (+10.9%), construction (+25.8%) and<br />
transport and communication (+12.6%). The economy<br />
picked up pace in the 2 nd quarter, with GDP figures<br />
indicating that the economy expanded by 12.4% compared<br />
to the same period in 2010, while output was also higher<br />
than in the first quarter of the year by 9.6%. Overall growth<br />
was driven by continued recovery in the mining sector,<br />
which grew by 23.7% y-o-y. But non-mining growth was also<br />
robust at 7.4%, led by expansion in manufacturing (+11.8%),<br />
water and electricity (+12.2%), construction (+28.3%) and<br />
transport and communication (+12.5%). The World Bank<br />
Report estimates that GDP growth for <strong>2011</strong> to December<br />
will be 6.8%.<br />
As mentioned, the banking sector was the main market<br />
driver during <strong>2011</strong>, as the four banks posted impressive<br />
results amidst an uncertain trading environment<br />
characterised by increasing competition from unlisted<br />
entities. On average, the share price of the four banks<br />
increased by 34.90% during <strong>2011</strong>, making it the best<br />
performing sector on the domestic board. Net interest<br />
margins continued to grow although the main focus was on<br />
cost containment rather than purely balance sheet and<br />
margin growth. Impairments growth for most commercial<br />
banks has slowed and this will encourage banks to advance<br />
more credit especially to the business sectors of the<br />
economy going forward.<br />
BancABC continued on its retail expansion programme,<br />
opening 4 branches during <strong>2011</strong> in country, with plans to<br />
open a further 5 during <strong>2012</strong>. Barclays revamped its<br />
technological platform which has it put it on par with its<br />
major competitors on the technological front. FNBB and<br />
Stanchart focused on retail lending.<br />
4<br />
1.5<br />
1.4<br />
1.3<br />
1.2<br />
1.1<br />
1<br />
0.9<br />
0.8<br />
0.7<br />
0.6<br />
0.5<br />
01-Jan-11<br />
31-Jan-11<br />
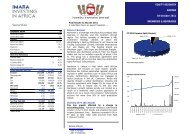
Source: IAS/S&P<br />
02-Mar-11<br />
01-Apr-11<br />
EQUITY RESEARCH<br />
BOTSWANA<br />
FEBRUARY <strong>2012</strong><br />
<strong>2011</strong> REVIEW AND <strong>2012</strong> OUTLOOK<br />
Top 5 Gainers and Losers - <strong>2011</strong> Opening Closing % change % change<br />
Company Price Price (LC) (USD)<br />
DCI 6412.94 6970.94 8.70% -6.57%<br />
G4S 3.19 6.00 88.09% 61.67%<br />
ABCH 2.42 4.55 88.02% 61.61%<br />
Barclays 5.55 6.90 24.32% 6.86%<br />
FurnMart 1.31 1.60 22.14% 4.98%<br />
FNBB 2.20 2.65 20.45% 3.54%<br />
FSG 1.80 1.48 -17.78% -29.33%<br />
Letlole 1.50 1.20 -20.00% -31.24%<br />
<strong>Imara</strong> 3.25 2.10 -35.38% -44.46%<br />
Cresta 1.50 0.79 -47.33% -54.73%<br />
Olympia 0.45 0.23 -48.89% -56.07%<br />
Source: BSE<br />
Top Ten Shares by Market Cap.<br />
Company (BW P m) (USD m) % of Total<br />
FNBB 6 742.53<br />
911.59 22.08%<br />
Barclays 5 879.91<br />
794.96 19.25%<br />
Letshego 3 017.20<br />
407.93 9.88%<br />
BIHL 2 754.49<br />
372.41 9.02%<br />
StanChart 2 723.89<br />
368.27 8.92%<br />
Sechaba 1 602.83<br />
216.70 5.25%<br />
NAP 1 329.67<br />
179.77 4.35%<br />
FurnMart 952.12<br />
128.73 3.12%<br />
Wilderness 900.90<br />
121.80 2.95%<br />
Engen 880.07<br />
Source: BSE<br />
DCI relative to S&P <strong>Africa</strong> Frontier Index<br />
01-May-11<br />
31-May-11<br />
30-Jun-11<br />
30-Jul-11<br />
29-Aug-11<br />
DCI S&P <strong>Africa</strong> Frontier<br />
118.99 2.88%<br />
28-Sep-11<br />
28-Oct-11<br />
27-Nov-11<br />
27-Dec-11
Market <strong>Review</strong> for <strong>2011</strong><br />
During the year the market had 6 new listings, 2 through an IPO<br />
and 4 as secondary listings, while only 1 company delisted.<br />
Letlole and New <strong>Africa</strong> Properties listed on the domestic board<br />
during the 2 nd and 3 rd quarter respectively through IPOs, bringing<br />
the number of listed property companies to 5. The foreign board<br />
saw Botswana Diamonds and Firestone listed during the 2 nd<br />
quarter, while Lucara and <strong>Africa</strong>n Energy listed during the 3 rd<br />
and 4 th quarters respectively. IAMGold was the only counter that<br />
delisted on the foreign board during the Q4 <strong>2011</strong>.<br />
The DCI started the year on a positive note, up 18.15% to end Q1<br />
<strong>2011</strong> at 6,938.33 points. The biggest gainers for the quarter<br />
were ABCH (+38.78%), RPC Data (+20.00%) and FNBB (+19.46%).<br />
Volumes increased significantly in Q2 <strong>2011</strong> to just above 2x<br />
those witnessed in Q1 <strong>2011</strong>. The index experienced some<br />
volatility during the quarter, edging up 0.45% to close the<br />
quarter at 6,969.89 points on the back of increases in Prime<br />
Time (+23.56%), G4S (+13.72%) and Stanchart (+11.24%). In Q3<br />
<strong>2011</strong>, volumes and turnover pulled back significantly. The DCI<br />
closed the quarter at 7,146.94 points representing a 2.54%<br />
increase from the Q2 <strong>2011</strong> close. The biggest gainers for the<br />
quarter were ABCH (+50.29%), G4S (+36.07%) and Barclays<br />
(+12.20%). Volumes and turnover picked up in Q4 <strong>2012</strong> although<br />
the index closed the quarter in the red. The DCI was down 2.46%<br />
to close at 6,970.94 points weighed down mainly by Cresta (-<br />
21.00%), Letlole (-19.46%) and Sefalana (-14.85%). The DCI was<br />
down 6.57% in USD terms for FY <strong>2011</strong> but was up 8.70% in pula<br />
terms, the biggest gainers being G4S (+61.67%), ABCH (+61.61%)<br />
and Barclays (+6.86%) in USD terms.<br />
The FCI closed Q1 <strong>2011</strong> up 7.67% at 1,802.41 points driven<br />
mainly by A-Cap (+45.61%), Aviva (+7.69%) and <strong>Africa</strong>n Copper<br />
(+6.06%). Volumes and turnover were marginally down during Q2<br />
<strong>2011</strong>. Only two counters, Blue Financial (+37.93%) and Aviva<br />
(+1.43%) closed the quarter in the black. The FCI ended Q2 at<br />
1,802.74 points, representing a 0.02% increase. Market activity<br />
picked up in Q3 <strong>2011</strong>, although A-Cap (+22.00%) was the only<br />
counter that registered positive growth. The FCI closed the<br />
quarter at 1,850.42 points representing a 2.64% increase. The<br />
foreign board took a nose dive in Q4 <strong>2011</strong> as the index lost<br />
7.92% to close at 1,703.91 points, weighed down mainly by A-<br />
Cap (-31.56%), Aviva (-26.19%) and Lucara (-17.71%). The FCI<br />
was down 12.33% in USD terms for FY <strong>2011</strong>, but was up 1.79% in<br />
local currency, the biggest gainer being Blue which gained<br />
56.67% in local currency terms and (+34.94%) in USD terms.<br />
A total of 458.7m shares changed hands during the year,<br />
generating turnover of USD 133.95m, compared to 308.66m<br />
shares at a turnover of USD 149.5m in the previous year,<br />
representing a 48.62% increase and 10.41% decline respectively.<br />
Q2 <strong>2011</strong> recorded the highest volume and turnover at 181.1m<br />
shares worth USD 47.38m. Letshego dominated the year’s<br />
volume and turnover at 68.67% and 54.72% respectively. The<br />
major reason for Letshego’s dominance was that one of its<br />
major foreign shareholder was liquidating their position during<br />
the year. The total market PER stood at 10.16x compared to<br />
10.77x in 2010, while the liquidity/turnover ratio stood at 3.42x<br />
compared to 2.06x in 2010.<br />
5<br />
10 most active stocks by volume<br />
Company Vol (m) % of Total<br />
Letshego 315.00<br />
68.67%<br />
Turnstar 33.48<br />
7.30%<br />
FNBB 26.93<br />
5.87%<br />
ABCH 15.07<br />
3.29%<br />
Sefalana 13.42<br />
2.93%<br />
Barclays 9.00<br />
1.96%<br />
BIHL 8.39<br />
1.83%<br />
RPC Data 6.84<br />
1.49%<br />
PrimeTime 6.00<br />
1.31%<br />
FSG 3.93<br />
0.86%<br />
Source: Capital Securities/BSE<br />
10 most active stocks by value<br />
Company Val (USD) % of Total<br />
Letshego 73 301 739 54.72%<br />
BIHL 12 150 190 9.07%<br />
FNBB 9 519 948 7.11%<br />
Barclays 7 941 239 5.93%<br />
ABCH 6 378 377 4.76%<br />
Turnstar 5 988 525 4.47%<br />
Sefalana 5 157 748 3.85%<br />
Sechaba 3 466 111 2.59%<br />
PrimeTime 1 574 729 1.18%<br />
StanChart 1 309 183 0.98%<br />
Source: Capital Securities/BSE<br />
5%<br />
4%<br />
19%<br />
9%<br />
Market Cap. Composition<br />
10%<br />
53%<br />
Banking<br />
Property<br />
Hotel<br />
Brewery<br />
Financials<br />
Other
Market Outlook for <strong>2012</strong><br />
According to the World Bank, Botswana’s GDP should grow by<br />
6.8% in <strong>2011</strong>, slowing to 6.2% in <strong>2012</strong> and 5.0% in 2013. The<br />
forecasts for <strong>2011</strong> and <strong>2012</strong> are both higher than the projected<br />
SSA averages of 4.9% and 5.3% for <strong>2011</strong> and <strong>2012</strong>, respectively.<br />
The economy’s projected growth in <strong>2011</strong> will be one of the<br />
highest among sub-<strong>Saharan</strong> countries. Botswana’s projected<br />
GDP growth ranks 12 th highest in <strong>Africa</strong> after Ghana, Ethiopia,<br />
Angola, Cape Verde, Eritrea, Rwanda, Serra Leone, Tanzania,<br />
Zambia, Niger, Nigeria and Mozambique and at par with<br />
Uganda.<br />
Inflation continues to be above the central bank’s target range<br />
of 3% - 6%. Inflation rose from 7.9% in January <strong>2011</strong> to 9.2% in<br />
December <strong>2011</strong> driven mainly by upward pressures from<br />
international fuel and food prices, as well as increases in<br />
domestic electricity tariffs and other levies. As a result, the<br />
bank rate and the prime lending rate were maintained at 9.5%<br />
and 11% respectively for the year <strong>2011</strong>. We are of the view that<br />
the bank rate will be maintained at the current rate during<br />
<strong>2012</strong> as the central bank endeavours to bring inflation within its<br />
target range.<br />
Looking ahead, we expect credit extension to the banking<br />
sector to pick up albeit slowly in line with continued<br />
uncertainty in the local economic conditions. In November<br />
<strong>2011</strong>, the central bank reduced the amount of BoBCs issued in<br />
the market by approximately BWP 3bn to about BWP 10bn,<br />
citing rising costs associated with issuing more BoBCs to mop-up<br />
increased levels of excess liquidity. In light of this recent<br />
development by the central bank and the subsequent reduction<br />
of the BoBC rate, we expect to see some of the excess liquidity<br />
directed in to loans and advances and subsequently into the<br />
stock exchange as institutional investors and large corporates<br />
look for alternative investments.<br />
It is for the reasons stated above, that we believe that we<br />
expect the banking sector to continue dominating and driving<br />
the market in <strong>2012</strong>. Although banking sector valuations may not<br />
be as compelling when compared to some Pan-<strong>Africa</strong>n peers,<br />
we believe they are still attractive when you consider the local<br />
market in isolation. We also expect mid-cap stocks of the likes<br />
of Choppies and some property counters to contribute positively<br />
to the market growth.<br />
6<br />
Top Picks for <strong>2012</strong><br />
Choppies - The market leading mass grocery retailer<br />
in Botswana, and retails fast moving consumer<br />
goods, household goods, fruit and vegetables, meat<br />
products, dry, fresh and baked goods through its<br />
stores in Botswana and South <strong>Africa</strong>; the Group<br />
operates 49 stores in Botswana, and 9 stores in South<br />
<strong>Africa</strong>; the investment attraction for Choppies is<br />
mainly strong revenue, margin expansion growth,<br />
significant market share and attractive dividend<br />
policy.<br />
G4S – G4S is the country’s leading security solutions<br />
group; just agreed, subject to regulatory approvals,<br />
to acquire the assets of Trojan Security Services.<br />
Trojan is the third largest security services provider<br />
in Botswana. Its primary operating areas are manned<br />
security; cash in transit and alarm and response; also<br />
set to acquire The Facilities Management Group<br />
(Pty) Ltd (“FMG”). FMG trades in three divisions:<br />
security, facilities management and cleaning<br />
services. If approved, these transactions will<br />
significantly strengthen the strategic development of<br />
G4S Botswana in terms of both footprint and<br />
capability and allow the company to deliver a wider<br />
range of outsourced solutions to both existing and<br />
new markets.<br />
ABCH – The retail expansion has boosted profitability<br />
of the group; it has the potential to gain market share<br />
from some players in the market who seem stagnant;<br />
regional presence and the continued recovery of<br />
Zimbabwe should continue to bolster profits; merchant<br />
business continues to be robust.<br />
Barclays – Botswana’s largest bank in terms of loan<br />
book and is the 2nd biggest company by market cap; has<br />
the biggest branch network and enjoys the largest<br />
market share; recently introduced new technology such<br />
internet and cell phone banking.
Just like the year 2010, the focal point for the WAEMU<br />
region was Cote d’Ivoire, as the country emerged out of its<br />
post-election chaos.<br />
Efforts to reinvigorate Ivory Coast‘s economy after the<br />
disputed November 2010 elections took off in earnest in <strong>2011</strong>,<br />
but the new President, Alassane Quattara, faced and continues<br />
to face, a formidable task in re-building the nation. He faces<br />
the twin challenge of hauling the conflict-crippled economy to<br />
its feet whilst fostering reconciliation. Quattara must heal<br />
ethnic divisions that were aggravated by the conflict. While his<br />
government is making strides on both fronts, the political<br />
environment remains strained. Inside the country, the forces<br />
of former president Gbagbo have been all but defeated while<br />
the remaining threat from Gbagbo loyalists comes principally<br />
from forces that fled to Liberia (and to a lesser extent Ghana).<br />
In July, and again in September <strong>2011</strong>, raids from Liberia killed<br />
several dozen people in the tense western region.<br />
Nonetheless, the end of the post-electoral conflict has<br />
provided an opportunity to push democratisation forward and<br />
unify the country on the terms agreed in the March 2007 peace<br />
deal. The interim unity government continues to function, and<br />
both the incumbent regime and former rebels agree on the<br />
need for economic reform in line with IMF and donor<br />
recommendations.<br />
Given the challenges experienced by Cote d’Ivoire during the<br />
year, the latest World Bank estimates are that the country’s<br />
real GDP shrank by 5.8%. However, a return to growth is<br />
expected in <strong>2012</strong> and 2013, with forecast real GDP growth of<br />
4.9% and 5.5% respectively.<br />
GDP growth rates in the other WAEMU countries for <strong>2011</strong> were<br />
as follows:<br />
o Benin – 3.4%<br />
o Burkina Faso – 5.8%<br />
o Guinea Bissau -4.8%<br />
o Mali – 5.4%<br />
o Niger – 6.0%<br />
o Senegal – 4.2%<br />
o Togo – 3.7%<br />
Reflecting the dominance of Cote d’Ivoire’s economy in the<br />
regional body, is the fact that while the other seven member<br />
states had decent to very good growth numbers, the negative<br />
out turn from Cote d’Ivoire diluted the aggregate forecast for<br />
the region in <strong>2011</strong> to just 1.9%, as per the IMF’s last regional<br />
economic outlook.<br />
While some sectors such as agriculture had a good year on the<br />
BRVM, the overall sentiment driven by Cote d’Ivoire’s travails<br />
was negative, which saw the BRVM closing <strong>2011</strong> in the red.<br />
7<br />
EQUITY RESEARCH<br />
BRVM<br />
FEBRUARY <strong>2012</strong><br />
<strong>2011</strong> REVIEW AND <strong>2012</strong> OUTLOOK<br />
Top 5 Gainers and Losers - <strong>2011</strong> Opening Closing % change % change<br />
Company Price Price (LC) (USD)<br />
BRVM-Composite 159.1 138.88 -12.71% -14.85%<br />
SOGB 28 000 56 000 100.00% 95.09%<br />
Servair 4 500 7 445 65.44% 61.38%<br />
Sode 11 500 18 000 56.52% 52.68%<br />
SAPH 27 000 40 000 48.15% 44.51%<br />
Bernabe 19 345 25 500 31.82% 28.58%<br />
Trituraf 1 600 1 000 -37.50% -39.03%<br />
Unilever 60 000 38 000 -36.67% -38.22%<br />
Safca 24 800 17 000 -31.45% -33.13%<br />
Crown Siem 31 995 22 850 -28.58% -30.34%<br />
Shell<br />
Source: BRVM<br />
18 000 12 960 -28.00% -29.77%<br />
Top 10 shares by market cap.<br />
Company XOF (m) USD (m) % of Total<br />
Sonatel 1 250 000<br />
2 470.5 38.78%<br />
Ecobank (ETI) 489 233<br />
966.9 15.18%<br />
SAPH 199 352<br />
394.0 6.18%<br />
Onatel 147 560<br />
291.6 4.58%<br />
Solibra 134 983<br />
266.8 4.19%<br />
SGBCI 121 333<br />
239.8 3.76%<br />
SOGB 120 970<br />
239.1 3.75%<br />
PALM-CI 115 945<br />
229.2 3.60%<br />
Unilever-CI 61 267<br />
121.1 1.90%<br />
SITAB 56 648<br />
112.0 1.76%<br />
Source: BRVM<br />
1.5<br />
1.4<br />
1.3<br />
1.2<br />
1.1<br />
1<br />
0.9<br />
0.8<br />
0.7<br />
0.6<br />
0.5<br />
01-Jan-11<br />
31-Jan-11<br />
Source: IAS/S&P<br />
BRVM Composite relative to S&P <strong>Africa</strong> Frontier Index<br />
02-Mar-11<br />
01-Apr-11<br />
01-May-11<br />
31-May-11<br />
30-Jun-11<br />
30-Jul-11<br />
29-Aug-11<br />
28-Sep-11<br />
BRVM Composite S&P <strong>Africa</strong> Frontier<br />
28-Oct-11<br />
27-Nov-11<br />
27-Dec-11
Market <strong>Review</strong> for <strong>2011</strong><br />
Along with Cote d’Ivoire’s political and economic<br />
challenges, a major setback for the BRVM remained the<br />
relative lack of liquidity, with ETI and Sonatel dominating<br />
stock activity by volume and value traded, respectively.<br />
Looking at returns, the BRVM Composite declined 12.71%<br />
in XOF terms and 14.85% in USD terms to close at 138.88<br />
points. 14 counters closed the year in the black, against<br />
25 in the red. The best performing sector was agriculture,<br />
led by SOGB (+100%). Other major gainers were Servair<br />
(+65.44%), Sode (+ 56.52%), SAPH (+48.15%) and Bernabe<br />
(+31.82%), which saw significant appreciation.<br />
Notable on the losers were Shell (-28.00%), Crown Siem<br />
(-28.58%), Safca (-31.45%), Unilever (-36.67%) and<br />
Trituraf (-37.50%). Sonatel remained the most capitalised<br />
counter with 38.8% of the total, followed by ETI with<br />
15.2% and SAPH with 6.2%. However, Sonatel weighed<br />
negatively on the BRVM, as its stock fell 22.0% y-o-y. The<br />
counter was the most traded by value, constituting<br />
58.48%, well ahead of SAPH with 11.39%. Total value<br />
traded for the year was USD 126.1m. Total volumes for<br />
the year amounted to 18.1m shares, with ETI by far the<br />
most active, contributing 90.09% of total volumes.<br />
Market Outlook for <strong>2012</strong><br />
The World Bank predicts that Cote d’Ivoire’s economic<br />
growth will rebound to 4.9% in <strong>2012</strong>. This recovery in the<br />
Cote d’Ivoire combined with solid growth in the rest of<br />
the region (Togo with the lowest estimate of 4.0% and<br />
Niger the highest at 8.5%) will see the WAEMU registering<br />
growth of an estimated 6.6% in <strong>2012</strong>.<br />
Despite the launch of a reconciliation commission,<br />
tensions may linger in Cote d’Ivoire. Some sections of<br />
society strongly opposed Quattara (Gbagbo won 48.6% of<br />
the vote in the election) as they view him as a stooge of<br />
the French. There are also presidential elections set for<br />
Guinea Bissau, Mali and Senegal in <strong>2012</strong>. The latter has<br />
already seen rising tensions, as the incumbent Abdoulaye<br />
Wade seeks to run for a third term on a technicality. His<br />
rivals say his participation breaches rules setting a twoterm<br />
limit, but Wade argues that his first term should<br />
not be counted as limits were added after he had already<br />
begun his time in power.<br />
The Eurozone crisis also presents potential risks to the<br />
WAEMU region, with the AfDB estimating that over 36%<br />
of the region’s exports are destined for Europe. Falling<br />
demand could thus have a negative impact, although<br />
given the CFA’s Euro peg, a weakening Euro would to<br />
some offset the fall in demand as WAEMU exports<br />
became more competitive. Other major risks would be<br />
around liquidity, given the dominance of foreign banks in<br />
Benin, Burkina Faso, Cote d’Ivoire and Niger in<br />
particular, and higher cost of borrowings on repriced<br />
sovereign borrowing risk.<br />
On the whole, given the lower base effects of GDP<br />
growth in <strong>2011</strong>, we expect company results and by<br />
extension the BRVM to reflect the improved economic<br />
conditions in the region and record a positive outturn in<br />
<strong>2012</strong>.<br />
10 Most active stocks by volume<br />
Company Vol % of total<br />
ETI 16,286,748 90.09%<br />
Sonatel 272,293 1.51%<br />
Palm 234,071 1.29%<br />
SAPH 188,360 1.04%<br />
SOGB 71,372 0.39%<br />
SGB 37,282 0.21%<br />
Filtisac 30,272 0.17%<br />
CIE 15,909 0.09%<br />
BOA CI 15,274 0.08%<br />
BOA BN<br />
Source: BRVM<br />
14,638 0.08%<br />
10 Most active stocks by value<br />
Company Val (USDm) % of total<br />
Sonatel 73.77 58.48%<br />
SAPH 14.37 11.39%<br />
Palm 7.13 5.65%<br />
SOGB 6.69 5.30%<br />
SGB 2.90 2.30%<br />
Sitab 1.57 1.25%<br />
ETI 1.53 1.21%<br />
BOA BN 1.51 1.20%<br />
Onatel 1.10 0.87%<br />
BOA CI<br />
Source: BRVM<br />
0.96 0.76%<br />
15.20%<br />
Source: BRVM<br />
7.94% 8.02%<br />
24.78%<br />
Top picks for <strong>2012</strong><br />
Market Cap. Composition<br />
44.06%<br />
Our top stocks for <strong>2012</strong> are as follows;<br />
Telecoms<br />
Financial Services<br />
Agro Processing<br />
Food and Beverages<br />
Others<br />
SAPH- The largest rubber company in Cote d’Ivoire, with total<br />
production capacity of rubber of c98,000 tonnes; international<br />
rubber prices have recovered; the risk of low rubber/tyre<br />
demand has also lessened given that the rebuilding exercise in<br />
Japan is expected to sustain rubber demand.<br />
PALM CI- The bullish outlook on palm oil prices is likely to be<br />
the main earnings driver.<br />
SOGB- Engaged in the production of both rubber and palm oil,<br />
SOGB’s key strength is that it has more attractive margins<br />
compared with its peers given that its earnings come mainly<br />
from its own plantations.<br />
SONATEL- Our BUY recommendation is endorsed by the<br />
relative resilience of the sector in general, the healthy<br />
dividend yield of 11.5%, and the operator’s diversified<br />
revenue streams (across various geographies) underpinned<br />
further by VAS as a new revenue stream.<br />
8
The rise of a Black Star. Ghana is not only making progress<br />
in the game of soccer with its so called “Black Stars”<br />
national team, but is also scoring goals on various other<br />
fronts. Forecast by the World Bank to have had by far the<br />
fastest growing economy in SSA and indeed, the world in<br />
<strong>2011</strong> at 13.6%, the country continues to exhibit a solid<br />
macroeconomic performance.<br />
Oil, of course, was the key driver of this GDP growth, and<br />
thus as in 2010, was a key theme in the country’s economic<br />
make up in <strong>2011</strong>, as the country benefitted from the<br />
commencement of oil exports. Given the discovery of new<br />
oil at the Jubilee Oil fields, it is estimated the country will<br />
account for approximately 1.6% of regional oil supply by<br />
2015. State-controlled Ghana National Petroleum<br />
Corporation (GNPC) currently operates in partnership with<br />
various international oil companies (IOCs), including Tullow<br />
Oil, Anadarko Petroleum and Kosmos Energy, in the<br />
development of the Jubilee oil field, which should reach<br />
plateau production of 120,000 bpd. The start-up of the<br />
Jubilee oil field in December 2010 will transform the<br />
country into a net exporter.<br />
In line with the positive reviews that its democracy has<br />
received, Ghana has taken early measures to manage its<br />
fledgling oil industry and the receipts thereof. The<br />
government and opposition parties in Parliament have<br />
passed into law the Petroleum Revenue Management Act<br />
(Act 815), which makes it possible for the government to<br />
access the annual budget funding amount from oil proceeds<br />
and, also makes room for setting up Stabilization and<br />
Heritage Funds. Parliament has also passed the Petroleum<br />
Commission Act to regulate activities of the use of<br />
petroleum resources, with a goal of achieving optimal<br />
resource exploitation while ensuring high health and<br />
environmental standards.<br />
Other positive economic news during the year included the<br />
country achieving its lowest inflation rate since June 1992’s<br />
8.37%, when it recorded 8.39% in July.<br />
Politically, the country was stable during the year, with the<br />
fight to see who would lead the various parties in the <strong>2012</strong><br />
presidential election done in the ‘voting booth’ as it were.<br />
Following successful August primaries by the ruling NDC,<br />
incumbent President Mills successfully faced down a<br />
leadership challenge by Nana Konadu Agyemang Rawlings,<br />
the wife of Jerry Rawlings, former president and the<br />
founder of the NDC.<br />
Despite the general good news, Ghana’s stock exchange had<br />
a negative return for the year, with much of the oil<br />
euphoria possibly having already been priced in (too<br />
aggressively perhaps?) into the exchange’s very strong<br />
performance in 2010.<br />
9<br />
EQUITY RESEARCH<br />
GHANA<br />
FEBRUARY <strong>2012</strong><br />
<strong>2011</strong> REVIEW AND <strong>2012</strong> OUTLOOK<br />
Top 5 Gainers and Losers - <strong>2011</strong> Opening Closing % change % change<br />
Company Price Price (LC) (USD)<br />
GSE-Composite 1000 969.03 -3.10% -11.33%<br />
Total 10 19.83 98.30% 81.46%<br />
PBC 0.13 0.25 92.31% 75.97%<br />
BOPP 0.75 1.1 46.67% 34.21%<br />
Unilever 5.69 6.64 16.70% 6.78%<br />
UT Bank 0.28 0.32 14.29% 4.58%<br />
PZ Cussons 1.2 0.24 -80.00% -81.70%<br />
TBL 1.33 0.4 -69.92% -72.48%<br />
GSR 5.2 2.75 -47.12% -51.61%<br />
Clydestone 0.07 0.04 -42.86% -47.71%<br />
SPL<br />
Source:GSE<br />
0.05 0.03 -40.00% -45.10%<br />
Top 10 shares by market cap.<br />
Company GHS (m) USD (m) % of Total<br />
Tullow Oil Plc 28 019 16 421.6 59.19%<br />
AngloGold Ashanti 12 963 7 597.4 27.38%<br />
ETI 1 240 726.9 2.62%<br />
Standard Chartered Ghana 886 519.0 1.87%<br />
Ecobank Ghana Limited 727 426.2 1.54%<br />
Golden Star Resources 702 411.7 1.48%<br />
Ghana Commercial Bank 504 295.1 1.06%<br />
Unilever (Ghana) 425 249.1 0.90%<br />
Guinness Ghana Breweries 323 189.5 0.68%<br />
Fanmilk Ghana<br />
Source: GSE<br />
279 163.5 0.59%<br />
1.5<br />
1.4<br />
1.3<br />
1.2<br />
1.1<br />
1<br />
0.9<br />
0.8<br />
0.7<br />
0.6<br />
0.5<br />
01-Jan-11<br />
31-Jan-11<br />
Source: IAS/S&P<br />
GSE-CI relative to S&P <strong>Africa</strong> Frontier Index<br />
02-Mar-11<br />
01-Apr-11<br />
01-May-11<br />
31-May-11<br />
30-Jun-11<br />
30-Jul-11<br />
29-Aug-11<br />
28-Sep-11<br />
GSE-CI S&P <strong>Africa</strong> Frontier<br />
28-Oct-11<br />
27-Nov-11<br />
27-Dec-11
Market <strong>Review</strong> for <strong>2011</strong><br />
The saying that “trees do not always grow to the sky”<br />
may be true for the GSE in the year <strong>2011</strong>. While the main<br />
index gained 27.55% (USD terms) in 2010, it nose-dived<br />
11.33% (USD terms) in <strong>2011</strong>. The extent of the decline<br />
can to some extent be attributed to a weaker currency,<br />
given that the index lost 3.10% in local currency terms.<br />
Overall, we attribute the lacklustre performance to<br />
developments in the Eurozone that led to frontier market<br />
redemption and less appetite for frontier market<br />
equities, while the markets lack of liquidity also remains<br />
a deterrent.<br />
The main highlight on GSE, however, was the successful<br />
listing of Tullow Oil, which had initially been slated for<br />
late 2010. As a result, Tullow Oil now constitutes 59% of<br />
the entire market capitalisation of USD 27.7bn, followed<br />
by Anglo Gold Ashanti, which constitutes 27.7%. Given<br />
that these are listed across various exchanges and foreign<br />
owned, liquidity still remains a key constraint. The most<br />
active stock by value-traded was Fan Milk Ghana, which<br />
constituted 25.0%, followed by Ghana Commercial Bank<br />
(19.12%) and Standard Chartered Bank (10.36%). In terms<br />
of volume traded, the most active was CAL Bank, which<br />
constituted 22%, followed by PBC (20%) and UT Bank<br />
(8.85%).<br />
Market Outlook for <strong>2012</strong><br />
The World Bank estimates real GDP growth of 9.0% in<br />
<strong>2012</strong> for Ghana. The 2010 Oil & Gas Journal (OGJ)<br />
annual reserves and production survey attributes<br />
660.0m bbl of proven oil reserves to the country.<br />
Headline figures of revenue from the oil and gas sector<br />
– USD 1.97bn in <strong>2011</strong>- look promising, as the offshore<br />
Jubilee Field is yet to reach planned peak production,<br />
which will make Ghana the sixth largest crude-oil<br />
exporter in <strong>Africa</strong>. We therefore expect the oil-led<br />
growth spurt to have positive spill-over effects to nonoil<br />
sectors of the economy. Furthermore, as a leading<br />
gold-producer, we expect the firm prices (cUSD<br />
1,600/oz) to also fuel growth in the West <strong>Africa</strong>n<br />
nation. The net effect of these positive economic<br />
drivers should ultimately be an increase in disposable<br />
incomes, which will in turn drive the growth in<br />
consumer demand.<br />
Liquidity on the GSE is also set to improve on the back<br />
of new listings on the bourse. The GSE has recently<br />
signed an MoU with Fidelity Capital Partners Limited<br />
(FCPL) in which the two organisations intend to work to<br />
promote the growth and future listing of companies,<br />
especially SMEs on the exchange. Under the MOU, the<br />
exchange will be promoted to investee companies of<br />
FCPL, thus enhancing the success of SME listings on the<br />
GSE.<br />
Ghana’s mandatory government pension scheme which<br />
entails an injection of cUSD 400.0m/annum on local<br />
capital markets through privately managed funds is also<br />
expected to boost efficiency and liquidity on the GSE<br />
given that 25.0% of the funds will be invested in equities.<br />
The new reform is part of a 2008 law that created a<br />
pension plan aimed at boosting savings in the country.<br />
10<br />
10 most active stocks by volume<br />
Company Vol (m) % of total<br />
CAL Bank 52.08 22.29%<br />
PBC 47.27 20.23%<br />
UT Bank 20.67 8.85%<br />
Fan Milk 14.59 6.24%<br />
SIC Insurance 14.42 6.17%<br />
ETI 14.34 6.14%<br />
GCB 12.99 5.56%<br />
Ayrton Drugs 11.10 4.75%<br />
Enterprise Group 10.42 4.46%<br />
Ghana Oil 9.28 3.97%<br />
Source: GSE<br />
10 most active stocks by value<br />
Company Val (USD m) % of total<br />
Fan Milk 24.72 25.02%<br />
GCB 18.89 19.12%<br />
SCB 10.23 10.36%<br />
CAL Bank 9.18 9.29%<br />
PBC 7.74 7.84%<br />
Ecobank Ghana 5.01 5.07%<br />
SIC Insurance 3.84 3.89%<br />
UT Bank 3.61 3.65%<br />
GGBL 2.92 2.96%<br />
Unilever 2.70 2.73%<br />
Source: GSE<br />
Source: GSE<br />
28.89%<br />
8.26%<br />
Top Picks <strong>2012</strong><br />
Market Cap. Composition<br />
2.25% 0.67%<br />
59.92%<br />
The following are our top picks for the year <strong>2012</strong>;<br />
Petroleum<br />
Resources/Gold<br />
Financial Services<br />
Consumer Goods<br />
Others<br />
Guinness Ghana Breweries Limited (GGBL) - The brewer<br />
recently raised GHS 70.0m through a rights offer; optimal<br />
capital structure (with manageable debt levels) will afford<br />
GGBL the flexibility to continue to grow its business in an<br />
expanding economy; company plans to grow its market share<br />
of the beer-market in Ghana by 9.0% over the next five years.<br />
Fan Milk – a producer of Fanyogo which is arguably Ghana’s<br />
most popular dairy product and also the producer of Fanice,<br />
is likely to continue benefiting from consumer-driven<br />
demand. Definitely one for the long term.<br />
ETI – We like the group’s pan-<strong>Africa</strong>n expansion drive which is<br />
still ongoing, strong technology platform and strong alliances<br />
with international banking groups. Its local subsidiary<br />
Ecobank Ghana is also one to watch, with the holding<br />
company having just purchased Trust Bank of Ghana, which<br />
will be merged with Ecobank Ghana. Scale benefits should be<br />
value accretive.
A year in which deteriorating economic conditions led<br />
to the NSE being the worst performer in SSA…<br />
In <strong>2011</strong>, inflation soared from 4.50% in December 2010 to<br />
a high of 19.72% in November <strong>2011</strong> before easing slightly<br />
to 18.93% in December. This was mainly as a result of a<br />
drought which led to food shortages and a rise in the<br />
price of oil due to the ‘Arab Spring’ earlier in the year.<br />
The situation was further exacerbated by the Central<br />
Bank’s reluctance to tighten monetary policy which led<br />
to a plunge in the value of the Kenya shilling.<br />
The shilling lost about a third of its value over the year<br />
to October <strong>2011</strong>, hitting a record low of 107:1 against<br />
the USD. This plunge was originally as a result of the<br />
Eurozone debt crisis which led to a flight from emerging<br />
and frontier market currencies into the USD. It was<br />
worsened by the Central Bank’s reluctance to raise<br />
interest rates in light of rising inflation, arguing that the<br />
causes were purely external.<br />
As macroeconomic conditions looked set to deteriorate<br />
further, the Central Bank belatedly embarked on an<br />
aggressive series of interest rate hikes. This saw the<br />
Central Bank Rate almost treble from 6.25% in<br />
September <strong>2011</strong> to 18.00% at the end of November <strong>2011</strong>.<br />
This helped the shilling to recover to c83 against the<br />
dollar by the end of the year with inflation seeming to<br />
have peaked, as it eased for the first time in the year to<br />
18.93% in December.<br />
The deterioration of economic conditions as the year<br />
went by was reflected in the downward trend of<br />
quarterly GDP growth rates. In Q1 the economy grew at<br />
4.9% (4.3% in Q1 2010). This rate slowed to 4.1% in Q2<br />
<strong>2011</strong> (4.6% in Q2 2010) and 3.6% in Q3 <strong>2011</strong> (5.7% in Q3<br />
2010). We expect GDP growth rate to have remained<br />
subdued in Q4 <strong>2011</strong> or even trended lower. In December,<br />
the World Bank downgraded its <strong>2011</strong> annual GDP growth<br />
forecast to 4.3% from 4.8%.<br />
The Nairobi <strong>Stock</strong> Exchange went from hero in 2010 to<br />
zero in <strong>2011</strong>, as the slowing economy as well high fixed<br />
income rates led to poor returns for the local bourse,<br />
this despite a relatively stable political environment with<br />
the fireworks expected come election time in 2013.<br />
EQUITY RESEARCH<br />
KENYA<br />
FEBRUARY <strong>2012</strong><br />
<strong>2011</strong> REVIEW AND <strong>2012</strong> OUTLOOK<br />
Top 5 Gainers and Losers - <strong>2011</strong> Opening Closing % change % change<br />
Company Price Price (LC) (USD)<br />
NSE - 20 4 432.60 3 205.02 -27.69% -32.52%<br />
City Trust 160.00 280.00 75.00% 63.32%<br />
Williamson Tea Kenya 185.00 282.00 52.43% 42.26%<br />
Kapchorua Tea 100.00 125.00 25.00% 16.66%<br />
Limuru Tea 300.00 335.00 11.67% 4.21%<br />
CMC Holdings 12.25 13.50 10.20% 2.85%<br />
Access Kenya 13.50 5.15 -61.85% -64.40%<br />
Kenya Airways 46.00 20.75 -54.89% -57.90%<br />
Housing Finance Co. 26.50 12.40 -53.21% -56.33%<br />
Car & General (K) 47.00 22.75 -51.60% -54.83%<br />
KenGen Co. Ltd 17.00 8.45 -50.29% -53.61%<br />
Source: NSE<br />
11<br />
Top 10 stocks by market cap.<br />
Company KES (m) USD (m) % of total<br />
East <strong>Africa</strong>n Breweries 139 967 1 601 16.01%<br />
Safaricom 120 000 1 373 13.73%<br />
Barclays Bank of Kenya 71 153 814 8.14%<br />
Equity Bank 58 504 669 6.69%<br />
Kenya Commercial Bank 49 280 564 5.64%<br />
Standard Chartered Bank 46 219 529 5.29%<br />
Bamburi Cement 45 370 519 5.19%<br />
Co-operative Bank of Kenya 44 528 509 5.09%<br />
KPLC 29 836 341 3.41%<br />
BAT Kenya 26 300 301 3.01%<br />
Source: NSE<br />
1.5<br />
1.4<br />
1.3<br />
1.2<br />
1.1<br />
1<br />
0.9<br />
0.8<br />
0.7<br />
0.6<br />
0.5<br />
01-Jan-11<br />
31-Jan-11<br />
Source: NSE/S&P<br />
NSE-20 relative to S&P <strong>Africa</strong> Frontier Index<br />
02-Mar-11<br />
01-Apr-11<br />
01-May-11<br />
31-May-11<br />
30-Jun-11<br />
30-Jul-11<br />
29-Aug-11<br />
28-Sep-11<br />
NSE-20 S&P <strong>Africa</strong> Frontier<br />
28-Oct-11<br />
27-Nov-11<br />
27-Dec-11
Market <strong>Review</strong> for <strong>2011</strong><br />
With the NSE-20 having been up 36.50% (local<br />
currency) and 27.70% (USD) in 2010, it was expected<br />
to at best register a modest gain in <strong>2011</strong> if not a pull<br />
back. The deterioration in economic conditions<br />
caused the equity market to come under pressure and<br />
the surge in interest rates made investors shift away<br />
from equities to the more lucrative fixed income<br />
market. The benchmark NSE-20 index finally ended<br />
the year <strong>2011</strong> as the worst performer in SSA, down<br />
27.69% (local currency) and 32.52% (USD). Likewise,<br />
the all-share index (NASI) shed 30.45% (local<br />
currency) and 35.10% (USD).<br />
Annual market activity contracted to 5.72bn shares<br />
worth USD 892.46m in comparison to 5.9bn shares<br />
valued at USD 1.15bn that changed hands in 2010.<br />
The telecommunication & technology sector<br />
accounted for 56.74% of total volumes mainly as a<br />
result of Safaricom’s dominance. The banking sector<br />
was the most active in terms of turnover, contributing<br />
40.83% to the total. The turnover ratio slightly<br />
improved to 8.87% from 7.63% in 2010.<br />
Foreign investor participation improved to KES<br />
39.86bn (USD 0.48bn) from KES 26.93bn (USD 0.35bn)<br />
in 2010. This represented 51.10% of <strong>2011</strong> turnover in<br />
comparison to 30.0% of turnover in 2010.<br />
Market capitalisation shrank to KES 868.24bn (cUSD<br />
10.89bn) as at the end of <strong>2011</strong> from KES 1,166.99bn<br />
(cUSD 13.96bn) as at the end of 2010. Market PER also<br />
contracted to 8.35x at the close of <strong>2011</strong> from 14.71x<br />
at the end of 2010.<br />
There were three new listings in <strong>2011</strong>. CFC Insurance<br />
and Trans-Century listed by introduction in April and<br />
July, respectively. Tough market conditions were<br />
evident in British American’s IPO which only realised<br />
subscription levels of rate of 60%. We think the<br />
valuations may also have been a bit rich on this IPO.<br />
The NSE achieved a major milestone in November<br />
with the introduction of two FTSE backed tradable<br />
indices: the FTSE NSE Kenya 25 Index and the FTSE NSE<br />
Kenya 15 Index. We believe this development will lead<br />
to increased visibility of the exchange amongst<br />
foreign investors, hence boosting liquidity. It also<br />
creates an opportunity for the development of index<br />
based products, e.g. exchange traded funds.<br />
The exchange changed its name from the Nairobi<br />
<strong>Stock</strong> Exchange to the Nairobi Securities Exchange to<br />
reflect its position as a trading platform of other<br />
securities other than equities. It also reclassified<br />
listed securities into twelve sectors to bring them in<br />
line with the various sectors of the economy.<br />
12<br />
10 most active stocks by volume<br />
Company Vol (m) % of total<br />
Safaricom 3 195.65 55.87%<br />
Equity Bank 456.46 7.98%<br />
Kenya Commercial Bank 399.73 6.99%<br />
KPLC 240.44 4.20%<br />
Co-operative Bank of Kenya 222.66 3.89%<br />
KenolKobil 185.86 3.25%<br />
Mumias Sugar 161.02 2.82%<br />
Barclays Bank of Kenya 146.32 2.56%<br />
CMC Holdings 70.70 1.24%<br />
KenGen 68.89 1.20%<br />
Source: NSE<br />
10 most active stocks by value<br />
Company Val (USD m) % of total<br />
Safaricom 133.64 14.97%<br />
Equity Bank 119.47 13.39%<br />
East <strong>Africa</strong>n Breweries 111.23 12.46%<br />
Kenya Commercial Bank 100.20 11.23%<br />
KPLC 57.92 6.49%<br />
Co-operative Bank of Kenya 43.57 4.88%<br />
Barclays Bank of Kenya 40.92 4.58%<br />
KenolKobil 22.10 2.48%<br />
Kenya Airways 20.47 2.29%<br />
Scangroup 19.63 2.20%<br />
Source: NSE<br />
20.15%<br />
2.09%<br />
3.31%<br />
Source: NSE<br />
13.71%<br />
7.63%<br />
1.05% 1.16%<br />
7.97%<br />
Market Cap. Composition<br />
36.52%<br />
6.40%<br />
Agriculture<br />
Automobiles & Accessories<br />
Banking<br />
Commercial & Services<br />
Construction & Allied<br />
Energy & Petroleum<br />
Insurance<br />
Investment<br />
Manufacturing & Allied<br />
Telcommunication & Technology
Market Outlook for <strong>2012</strong> Top Picks for <strong>2012</strong><br />
We expect to see the effects of the difficult economic<br />
environment in <strong>2011</strong> reflected in upcoming company<br />
results. For example, banks’ results are expected to<br />
take a hit from the marking to market of their bond<br />
portfolios and a rise in NPLs. However, we believe this<br />
information is already priced in most banking counters.<br />
Inflation is likely to ease gradually as food prices drop<br />
and on the back of a stronger shilling. The Central Bank<br />
is therefore likely to hold the CBR at elevated levels<br />
with slow easing. Developments in the Eurozone are<br />
also likely to play a role in the country’s economic<br />
outlook. This is mainly due to the fact that more than<br />
25% of Kenya’s exports go to Europe.<br />
Kenya is set to hold presidential elections later this<br />
year or in early 2013. The contest is likely to be as<br />
tight as the 2007 elections which plunged the country<br />
into ethnic related chaos. Furthermore, two of the<br />
frontrunners have cases pending at the International<br />
Criminal Court, for their role in the 2007 post-election<br />
violence. Some glimmer of hope to avoid a repeat of<br />
the bedlam witnessed in the last election lies in the<br />
adoption of a new constitution in 2010. This new set of<br />
laws is meant to devolve some resources away from<br />
central executive control to the grassroots. It may help<br />
to ease any desire by the different ethnic groupings to<br />
want ‘one of their own’ to be in power.<br />
On a more positive note, the NSE CEO, Peter Mwangi<br />
has said that eight new listings are expected in <strong>2012</strong>,<br />
with three companies having already confirmed. The<br />
demutualisation of the exchange is also in the offing<br />
and is expected to improve transparency and corporate<br />
governance. An alternative exchange for SMEs; Growth<br />
Enterprise Market Segment (GEMS); is also expected to<br />
be launched soon.<br />
There is no doubt that the NSE currently provides<br />
numerous buying opportunities having closed the year<br />
<strong>2011</strong> at a PER of 8.35x. However, we expect the<br />
market to trade sideways mainly because the economy<br />
is expected to remain under pressure for a significant<br />
part of the year. Additionally, political risk will be<br />
heightened by the upcoming elections with most<br />
investors sitting on the side-lines. We believe that it<br />
may be a good time for investors to start looking for<br />
good entry points at the NSE, especially the closer we<br />
get to elections, in readiness for a possible bull run in<br />
2013.<br />
13<br />
Kenya Commercial Bank - It is East <strong>Africa</strong>’s biggest bank<br />
by assets with the most extensive branch network,<br />
therefore best positioned to benefit from the region’s<br />
integration and economic growth prospects. It is also the<br />
biggest mortgage provider in East <strong>Africa</strong>, a region with<br />
relatively low mortgage uptake and a housing shortage.<br />
Furthermore, it’s one of the cheapest in the sector on a<br />
PER of 5.62x relative to a sector average of 7.22x. Its main<br />
weakness has been its high cost to income ratio relative to<br />
peers but having started a restructuring process following<br />
the appointment of McKinsey to review its processes, we<br />
expect the group to realise greater efficiencies.<br />
Equity Bank – The bank’s focus on the lower end of the<br />
market has been a huge success leading it to be East<br />
<strong>Africa</strong>’s most profitable bank as at 9M 11. It now seeks to<br />
replicate its Kenyan model across East <strong>Africa</strong>. We believe<br />
that microfinance still has huge potential in the region due<br />
to the high number of unbanked people. Currently, trading<br />
at a PER of 8.96x, we’re of the view that it offers an<br />
attractive entry point into this fast growing sector.<br />
KenolKobil – A fast growing oil marketer present in Kenya,<br />
Uganda, Tanzania, Rwanda, Zambia, Ethiopia, Burundi,<br />
Zimbabwe and Mozambique. It exhibits further regional<br />
ambitions and has been touted as a possible takeover<br />
target by global oil marketers. Its main drawback remains<br />
fuel price controls in its key Kenyan market although from<br />
its latest results, it seems to be weathering this well. It<br />
currently trades at a PER of 8.58x.
The market retreated on negative sentiment and share<br />
overhang<br />
The MSE traded in negative territory, impacted indirectly by<br />
the global financial crisis through foreign funds’ attempts to<br />
exit the market as risk appetite declined leading to an<br />
increase in redemption calls. Coinciding with Malawi’s foreign<br />
exchange shortage and combined with the MSE’s relatively<br />
low liquidity, this meant sell orders remained outstanding,<br />
creating a share overhang in most counters.<br />
The total market cap declined 20.1% in US dollar terms.<br />
The total market cap for the Malawi registered stocks<br />
declined 20.1% to US$ 1.0bn using the OMIR* rate. Although<br />
the market gained 8.05% in kwacha terms, real returns were<br />
negatively impacted by the depreciation of the local<br />
currency. Only eight domestic counters (from a total of 13)<br />
registered positive returns in local currency terms.<br />
Market activity was constrained during the year<br />
Although both volume and value traded improved on 2010<br />
figures, they remained generally depressed with average daily<br />
value traded of USD 0.2m or a market turnover of<br />
approximately 0.02%. The counters which were active<br />
included TNM, NMB, Illovo, NITL and FMB.<br />
Acute foreign exchange negatively impacted economic<br />
growth<br />
The Malawi economy slowed down on acute foreign exchange,<br />
electricity and fuel shortages. This can be attributed to policy<br />
profligacy and the fallout with donors who contribute<br />
approximately 40% of the country’s national budget. Although<br />
the RBM devalued the USD/MWK by 10% to 165 from 150 in<br />
early August <strong>2011</strong>, this failed to eliminate the forex shortages<br />
as the devaluation remains insufficient and well below the<br />
parallel market rate of approximately MWK 260 : USD 1. The<br />
fuel shortage impacted negatively on most industries with the<br />
agriculture, manufacturing and transport sectors the hardest<br />
hit. Although the Minister of Finance expects growth of 6.9%<br />
in <strong>2011</strong> and 6.6% in <strong>2012</strong>, the IMF doubt these will be<br />
achieved due to a number of structural constraints e.g. fuel<br />
and electricity shortages. Manufacturing capacity utilisation<br />
has slowed to approximately 60% from highs of above 70%<br />
with the viability of most operations threatened. The World<br />
Bank forecasts growth rates of 5.6% in <strong>2011</strong> and 5.0% for<br />
<strong>2012</strong>.<br />
*OMIR: Average exchange rate calculated during the<br />
hyperinflationary era using the Old Mutual share price.<br />
14<br />
Top 5 Gainers and Losers Opening Closing % Change % Change<br />
Company Price Price (LC) (USD)<br />
DSI INDEX 3 923 4 238 8.05% 0.35%<br />
OML 28 000 42 600 52.14% 41.30%<br />
REAL 100 120 20.00% 11.45%<br />
NICO 920 1 100 19.57% 11.04%<br />
ILLOVO 11 000 13 000 18.18% 9.76%<br />
BHL 640 700 9.38% 1.58%<br />
NITL 1 600 1 600 0.00% -7.13%<br />
MPICO 310 300 -3.23% -10.12%<br />
NBS 1 100 1 000 -9.09% -15.57%<br />
NMB 5 865 5 250 -10.49% -16.87%<br />
SUNBIRD 890 700 -21.35% -26.96%<br />
Source: M SE<br />
Top 10 shares by market cap.<br />
Company MWK (m) USD (m)* % of Total**<br />
Old Mutual 1 632 457.3 7 982.4 -<br />
Illovo 92 747.8 453.5 41.77%<br />
NBM 24 513.6 119.9 11.04%<br />
Standard Bank 22 400.1 109.5 10.09%<br />
PCL 21 646.0 105.8 9.75%<br />
TNM 19 076.9 93.3 8.59%<br />
FMB 16 353.8 80.0 7.36%<br />
NICO 11 473.5 56.1 5.17%<br />
NBS 5 207.4 25.5 2.35%<br />
MPICO 3 447.1 16.9 1.55%<br />
Source: M SE<br />
*OM IR<br />
** Local Index<br />
1.5<br />
1.4<br />
1.3<br />
1.2<br />
1.1<br />
1<br />
0.9<br />
0.8<br />
0.7<br />
0.6<br />
0.5<br />
01-Jan-11<br />
31-Jan-11<br />
Source: IAS/S&P<br />
02-Mar-11<br />
DSI relative to S&P <strong>Africa</strong> Frontier Index<br />
01-Apr-11<br />
01-May-11<br />
31-May-11<br />
30-Jun-11<br />
30-Jul-11<br />
29-Aug-11<br />
DSI S&P <strong>Africa</strong> Frontier<br />
EQUITY RESEARCH<br />
28-Sep-11<br />
MALAWI<br />
FEBRUARY <strong>2012</strong><br />
<strong>2011</strong> REVIEW & <strong>2012</strong> OUTLOOK<br />
28-Oct-11<br />
27-Nov-11<br />
27-Dec-11
Market Outlook for <strong>2012</strong><br />
Currency shortages to persist<br />
With the authorities arguing that a devaluation would<br />
trigger inflation and hurt the poor, a substantial<br />
devaluation is unlikely in the short-term or at least before<br />
the harvest. However, we believe the benefits of a<br />
devaluation far outweigh the negative repercussions<br />
especially given that the devaluation could pave the way<br />
for constructive dialogue between Malawi and the IMF as<br />
well as other international lenders. Furthermore, the<br />
liberalisation of the FX market is also part of the IMF<br />
requirements. Foreign reserves are at low levels of<br />
approximately USD 200.0m, equal to 1.5 months import<br />
cover from 3.4. Given the looming BOP deficit combined<br />
with escalating inflation, the MWK will remain under<br />
duress.<br />
Inflation likely to soar<br />
With food prices accounting for 58% of the consumer price<br />
index, weather conditions tend to influence the inflation<br />
outcome. The current agricultural season has been<br />
impacted by the reduced government inputs (especially<br />
fertiliser which was cut to about a quarter) support due to<br />
forex shortages. Inflationary pressures are still<br />
predominantly driven by supply side factors, with food and<br />
fuel price increases accounting for most of the upward<br />
pressure. With no IMF funds to shore up the currency in the<br />
short to medium term and start restoring both international<br />
and local confidence, the pending BOP crisis will further<br />
shake the currency and fuel inflation. On the ground<br />
anecdotal evidence suggests the inflation figure is running<br />
at closer to 20%. Although the currency is pegged at USD<br />
165: MWK, imported goods are priced at the parallel rate.<br />
In our view, the first quarter of <strong>2012</strong> is likely to be<br />
characterised by skyrocketing consumer prices exacerbated<br />
by the lower agriculture output. We expect the average<br />
inflation rate for <strong>2012</strong> to be at least 15%.<br />
Real assets well poised for upside<br />
In light of the spiralling inflation and the continued<br />
currency weakness we believe it is a matter of time before<br />
investors move into real assets away from the negative<br />
returns on the money market where yields for 91-day TBs<br />
are around 7.0% versus official inflation of 8.1%. This might<br />
eventually push the demand for equities whose valuations<br />
remain surprisingly low in light of the continued currency<br />
weakness. The case for equities is further strengthened by<br />
the generally good dividend yields with a market average<br />
dividend yield of about 5.0%. The MSE (excluding Old<br />
Mutual) is only capitalised at MWK 1.2bn (approximately<br />
USD 1.0bn using the OMIR). Ratings remain attractive in<br />
relation to <strong>Sub</strong>-<strong>Saharan</strong> <strong>Africa</strong> peers, in our view.<br />
Furthermore, the foreign exchange shortage is unlikely to<br />
last into perpetuity, and once the share overhang has<br />
cleared, stock prices are likely to rebound fairly quickly.<br />
15<br />
10 most active stocks by volume<br />
Company Vol (m) % of Total<br />
TNM 1 446.27 90.96%<br />
NBM 43.15 2.71%<br />
FMB 29.73 1.87%<br />
NITL 16.78 1.06%<br />
MPICO 15.43 0.97%<br />
NBS 11.83 0.74%<br />
NICO 10.44 0.66%<br />
Illovo 8.56 0.54%<br />
REAL 4.44 0.28%<br />
Standard Bank 1.39 0.09%<br />
Source: MSE<br />
10 most active stocks by value<br />
Company Val (USD m) % of Total<br />
TNM 16.56 36.27%<br />
NBM 16.04 35.13%<br />
Illovo 6.11 13.38%<br />
NITL 1.67 3.65%<br />
FMB 1.29 2.81%<br />
PCL 0.98 2.15%<br />
Standard Bank 0.91 1.99%<br />
NBS 0.78 1.71%<br />
NICO 0.78 1.70%<br />
MPICO 0.30 0.66%<br />
Source: MSE<br />
Source: MSE<br />
51.54%<br />
Market Cap. Composition<br />
1.55%<br />
31.78%<br />
5.30%<br />
1.23%<br />
8.59%<br />
BANKING<br />
INSURANCE<br />
TOURISM<br />
TELECOMS<br />
PROPERTY<br />
MANUFACTURING
Top Picks for <strong>2012</strong><br />
PER PBV<br />
Company Price<br />
Hist. T+1 T+2 Hist. T+1 T+2<br />
Recom.<br />
FMB 650.0 8.6 6.7 5.3 2.0 1.7 1.4 BUY<br />
MPICO 300.0 0.0 0.0 0.0 0.0 0.0 0.0 BUY<br />
NBM 5,250.0 7.1 5.5 4.5 1.8 1.5 1.2 BUY<br />
NBS 976.0 3.6 2.5 2.1 1.4 1.1 0.8 BUY<br />
NICO 1,050.0 3.7 3.1 2.6 1.2 0.9 0.7 BUY<br />
Press Corp. 18,000.0 4.1 2.9 1.9 0.8 0.6 0.5 BUY<br />
Std. Bank 10,600 15 14 12 0.8 0.6 0.5 BUY<br />
NBS 976 3.6 2.5 2.1 1.4 1.1 0.8 BUY<br />
Source: MSE<br />
We think the current market pull offers some buying<br />
opportunities for long-term investors. Nonetheless,<br />
investing on the MSE is a long-term play given issues<br />
with repatriation of currency for now, while there is the<br />
devaluation risk to consider which can erode any gains<br />
overnight.<br />
However, earnings growth for most listed companies is<br />
generally expected to be weaker given the economic<br />
woes. Deposit growth for banks has generally been<br />
slower and most account holders are multi-banked as<br />
they chase facilities. Provisions for banks are set to<br />
increase given the economic slowdown, with those with<br />
significant exposures to tobacco, transport and<br />
construction likely to be the hardest hit. For banks,<br />
forex income has slowed and focus is on efficiency.<br />
However, we believe listed banks will weather the<br />
storm given the generally solid balance sheets and<br />
stringent credit control.<br />
16<br />
In our view, companies that rely on local inputs<br />
commanding a dominant market share do well going<br />
forward, especially Press Corp and NICO.<br />
The tourism sector has been negatively impacted by the<br />
fuel shortages and the reduced donor activities which<br />
affected the conferencing business. Furthermore, the<br />
overvalued local currency means that Malawi is, relatively,<br />
an expensive destination for international visitors.<br />
Property companies should perform reasonably well and<br />
MPICO can potentially surprise on the upside.<br />
We expect companies with significant export earnings and<br />
external links to perform strongly in light of the weak<br />
currency especially Illovo and Old Mutual and to a lesser<br />
extent Press Corp. Old Mutual with a large part of its<br />
business external to Malawi will probably continue to<br />
reflect the street value of its external holding. The<br />
current Old Mutual price indicate an exchange rate of<br />
about MWK 230 : USD1, implying investors can bring in Old<br />
Mutual shares and invest in other counters that offer<br />
significant upside.
Given its traditionally strong economic ties with the<br />
Eurozone, the debt crisis on that continent continued<br />
to weigh negatively on the economy, and by extension,<br />
on the <strong>Stock</strong> Exchange of Mauritius.<br />
In August last year, the finance ministry cut its growth<br />
targets for the period from <strong>2012</strong>-2014 to 4% from 5%, due<br />
to declining tourism revenues from the crisis-hit<br />
Eurozone. At the same time it announced a raft of<br />
reforms that would look to favour growth, improve<br />
welfare and reinforce crisis-prevention systems. The<br />
important Mauritian tourism economy generates about<br />
10% of the country’s GDP, and visitors from debt-mired<br />
Europe traditionally account for around two thirds of<br />
arrivals.<br />
Thus the broader economy remained the major mover of<br />
the exchange in <strong>2011</strong>, with economic commentators,<br />
including the <strong>Africa</strong>n Development Bank, AfDB, noting the<br />
need for the country to restructure its economy, saying<br />
that future overall growth will rely in some part on<br />
Mauritius tackling its fiscal and current account deficits,<br />
high dependency on traditional export partners, high<br />
import-dependence, and relatively poor infrastructure.<br />
According to statistics published by the statistical office,<br />
the economy ended up growing by 4.1% in <strong>2011</strong>, with the<br />
performance of the main industry groups as follows:<br />
Sugarcane +0.6% compared to decline of 6.4% in 2010;<br />
manufacturing +3.5% (+2.1% in 2010); construction -1.8%<br />
(+4.3% in 2010), hotels and restaurants +4.0% (+6.0% in<br />
2010); transport, storage and communications +5.5%<br />
(+5.3% in 2010) and financial intermediation which grew<br />
by 5.5%, compared to 4.3% growth in 2010.<br />
Positively, Mauritius continued to score highly in the in<br />
terms of ease of doing business indices, with the World<br />
Economic Forum’s ‘Global Competitiveness Report <strong>2011</strong>-<br />
<strong>2012</strong>’ ranking Mauritius second in <strong>Africa</strong>, (just 4 places<br />
behind South <strong>Africa</strong>), at number 54 in the world in terms<br />
of its competitiveness.<br />
Politically, the country was relatively stable, although<br />
there was a slight wobble in July when the then finance<br />
minister and five other members of his alliance partner<br />
Militant Socialist Movement (MSM) party quit the<br />
government in protest against the arrest of the health<br />
minister by an anti-graft watchdog after she was accused<br />
of inflating a government tender to acquire a private<br />
hospital. The finance minister was subsequently replaced<br />
and the cabinet reshuffled, with no real change in policy,<br />
thus restoring any lost investor confidence.<br />
17<br />
Source: SEM/CIM<br />
1.5<br />
1.4<br />
1.3<br />
1.2<br />
1.1<br />
1<br />
0.9<br />
0.8<br />
0.7<br />
0.6<br />
0.5<br />
01-Jan-11<br />
31-Jan-11<br />
Source: IAS/S&P<br />
02-Mar-11<br />
01-Apr-11<br />
EQUITY RESEARCH<br />
MAURITIUS<br />
FEBRUARY <strong>2012</strong><br />
<strong>2011</strong> REVIEW AND <strong>2012</strong> OUTLOOK<br />
Top 5 Gainers and Losers - <strong>2011</strong> Opening Closing % change % change<br />
Company Price Price (LC) (USD)<br />
Semdex 1 967.45 1 888.38 -4.02% 0.09%<br />
Gamma Civic Ltd 297 398 34.01% 39.74%<br />
Innodis Ltd 31.8 39.8 25.16% 30.52%<br />
Vivo Energy M auritius Ltd 137 161 17.52% 22.55%<br />
M CFIndustry Ltd 38 43.3 13.95% 18.83%<br />
Rogers & Co. Ltd 293 325 10.92% 15.67%<br />
M SM 17.1 13.5 -21.05% -17.67%<br />
United Docks 124 96 -22.58% -19.27%<br />
Dale 20.5 15.8 -22.93% -19.63%<br />
NM H 110 81.5 -25.91% -22.74%<br />
Caudan 2.05 1.5 -26.83% -23.70%<br />
Top 10 shares by market cap.<br />
Company MUR (m) USD (m) % of Total<br />
M CB 41 812.70 1 486.47 24.38%<br />
SBM 25 514.20 907.05 14.88%<br />
NM H 13 156.00 467.71 7.67%<br />
ENL Land 8 884.10 315.84 5.18%<br />
Rogers 8 191.50 291.21 4.78%<br />
IBL 5 572.20 198.10 3.25%<br />
Sun Resorts 5 397.70 191.89 3.15%<br />
Gamma Civic 5 303.40 188.54 3.09%<br />
Omnicane 4 925.40 175.10 2.87%<br />
Vivo Energy 4 720.90 167.83 2.75%<br />
Source: SEM/CIM<br />
Semdex relative to S&P <strong>Africa</strong> Frontier Index<br />
01-May-11<br />
31-May-11<br />
30-Jun-11<br />
30-Jul-11<br />
29-Aug-11<br />
28-Sep-11<br />
Semdex S&P <strong>Africa</strong> Frontier<br />
28-Oct-11<br />
27-Nov-11<br />
27-Dec-11
Market <strong>Review</strong> for <strong>2011</strong><br />
The <strong>Stock</strong> Exchange of Mauritius’ main board, the<br />
Semdex, shed 4.02% in local currency terms to close at<br />
1,888.38 points, while reflecting a flat return in USD<br />
terms, as it put on a marginal 0.09%, thanks to the<br />
currency strengthening against the dollar as at FY <strong>2011</strong>.<br />
The net result for the year was a disappointment after a<br />
strong start to the year had seen the index hit a record<br />
high of 2,113.61 points in May. Foreign investors were net<br />
sellers to the tune of MUR 480m, inclusive of a 5.2%<br />
disposal of shares in Rogers. Without that exceptional<br />
sale, net outflows were MUR 117.0m.<br />
Market capitalisation closed at USD 5.7bn, up 0.74% y-o-y,<br />
while turnover increased by 32.99% to USD 499.1m.<br />
Turnover by volume was 244.0m shares vs. 339.4m in<br />
2010, a 28.11% decline. The market PER ended the year<br />
at 11.29x, lower than 2010’s 14.05x, while the dividend<br />
yield was at 3.04% compared with 2.50% as at FY 2010.<br />
There was one new listing on the exchange in <strong>2011</strong>, with<br />
Go Life International PCC being the first company to be<br />
listed on the official market whose securities are traded<br />
and settled in USD. The company is structured as a<br />
protected cell company and is regulated by the Financial<br />
Services Commission. It was established to effect the<br />
acquisition of 45% of the equity shareholding of Go Life<br />
Health Products Ltd (SA). Go Life (SA) is involved in the<br />
“nutraceutical” market. The term “nutraceuticals” refers<br />
to extracts of foods having a medicinal effect on human<br />
health. Having listed at US10c per share, the company<br />
reached a high of US16c before eventually closing at US9c<br />
per share.<br />
Market Outlook for <strong>2012</strong><br />
In sympathy with the concerns around the Eurozone, the<br />
market has opened the year on a weak note, shedding<br />
3.19% to the end of January <strong>2012</strong>, with the Sem-7 down<br />
2.66% as SBM and NMH in particular have started poorly.<br />
Looking at the economy as a whole, the Central Statistics<br />
Office expects GDP to grow by around 4.0% in <strong>2012</strong>,<br />
slightly lower than the 4.1% registered in <strong>2011</strong>. Exclusive<br />
of sugar, the growth rate would be 3.9% compared to<br />
4.2% in <strong>2011</strong>. The key tourism sector is expected to grow<br />
by 3%, with tourist numbers which grew to 964,642<br />
against a forecast 980,000 in <strong>2011</strong>, expected to increase<br />
to 1.01m in <strong>2012</strong> as the country continues to increase its<br />
marketing efforts towards Asia.<br />
The World Bank has the same estimate growth rate for<br />
<strong>2011</strong> of 4.1%, but is rather more negative on the outlook,<br />
forecasting real GDP growth of 3.3% in USD terms for<br />
<strong>2012</strong>, before recovering to 4.3% in 2013. The sooner the<br />
Eurozone crisis is resolved, the better for Mauritius, but<br />
given the relatively cautious GDP outlook, we think the<br />
market will reflect the same chariness in <strong>2012</strong>.<br />
18<br />
10 most active stocks by volume<br />
Company Vol % of total<br />
MDIT 42 248 066 17.31%<br />
ENL Land 25 987 774 10.65%<br />
VIVO Energy 22 614 974 9.27%<br />
MCB 21 222 117 8.70%<br />
ENL Land (P) 18 342 422 7.52%<br />
Caudan 15 839 346 6.49%<br />
NMH 10 763 420 4.41%<br />
SBM 9 021 668 3.70%<br />
Lux Island Resorts 8 711 415 3.57%<br />
Air Mauritius 8 629 606 3.54%<br />
Source: SEM/CIM<br />
10 most active stocks by value<br />
Company Val (USD) % of total<br />
VIVO Energy 131 727 318 24.77%<br />
MCB 131 169 237 24.66%<br />
ENL Land 41 166 074 7.74%<br />
NMH 38 740 928 7.28%<br />
ENL Land (P) 30 055 299 5.65%<br />
SBM 29 539 100 5.55%<br />
Lux Island Resorts 9 166 238 1.72%<br />
MDIT 8 610 886 1.62%<br />
Air Mauritius 5 341 924 1.00%<br />
Caudan 996 434 0.19%<br />
Source: SEM/CIM<br />
13.08%<br />
12.77%<br />
8.25%<br />
Source: SEM/CIM<br />
8.05%<br />
12.91%<br />
Top picks for <strong>2012</strong><br />
Market Cap. Composition<br />
0.95%<br />
0.24%<br />
43.75%<br />
Banks & Insurance<br />
Commerce<br />
Industry<br />
Investments<br />
Leisure & Hotels<br />
Sugar<br />
Transport<br />
Foreign<br />
MCB - Our preferred banking stock on the Mauritian<br />
bourse; earnings growth expected to be fairly mundane<br />
in <strong>2012</strong>, but longer term fundamentals are sound;<br />
Growth to be driven more by product diversification and<br />
regional expansion.<br />
LUX Island Resorts (formerly Naiade Resorts) – The<br />
tourism sector has lagged in terms of performance over<br />
the past couple of years, saddled by poor demand from<br />
its key European market as well as high indebtedness as<br />
expansion capex was pursued just as the GFC hit in<br />
2008; in our last sector report we had Lux as a hold, at<br />
its then price of MUR 29 per share. It has since dropped<br />
to MUR 23.20. While <strong>2012</strong> is likely to prove challenging<br />
once more, we think long term investors should look to<br />
accumulate shares at current levels.
The next hot spot for oil exploration? In a positive<br />
development for Namibia, the Ministry of Mines and Energy<br />
announced last year that an estimated 11.0bn barrels in oil<br />
reserves were found off Namibia's coast, with first<br />
production planned within four years. The find could put<br />
Namibia on par with neighbouring Angola, whose reserves<br />
are estimated at around 13.0bn barrels and whose<br />
production rivals <strong>Africa</strong>'s top producer, Nigeria. These<br />
potential crude oil resources will have a considerable<br />
impact on the country.<br />
Having a strongly mining biased economy, Namibia has<br />
largely benefited from the boom in commodity prices and<br />
GDP growth has been strong in the past five years (4.4% on<br />
average). However, the reliance on mining (41% of goods’<br />
export earnings in 2010 and 9.0% of GDP) renders the<br />
economy vulnerable to external shocks.<br />
Like other countries in the region, Namibia has sought to<br />
cash in on historically high commodity prices. In August<br />
<strong>2011</strong>, the Namibian government decided not to implement<br />
its plan to raise the corporate income tax rate for the nondiamond<br />
mining sector from 37.5% to 44%, following<br />
concern from the industry. The finance ministry has<br />
instead proposed a formula-based surcharge to “capture<br />
additional mining revenue during better economic<br />
periods”. The government is also pushing through<br />
parliament plans for the state-owned Epangelo Mining<br />
Company to be assigned all mining and exploration rights<br />
for strategic minerals, which include zinc, copper, coal,<br />
uranium and gold, but not diamonds.<br />
Amidst positive news was the potentially investor<br />
unnerving situation involving Walmart’s takeover Massmart<br />
Holdings and its <strong>Africa</strong>n operations, including Namibia. The<br />
Namibian Supreme Court ruled on appeal that the decision<br />
by competition authorities to impose conditions on<br />
Walmart's purchase of Massmart, which has three local<br />
subsidiaries, should stand, setting aside a High Court ruling<br />
from earlier in the year that had scrapped the conditions<br />
imposed by the Competition Commission. The ruling also<br />
gives Trade and Industry Minister Hage Geingob a final say<br />
over whether conditions attached to the deal by the<br />
Competition Commission are adequate. As was the case<br />
with South <strong>Africa</strong>, there are concerns that too many<br />
conditions applied to such transactions interfere with the<br />
free market and could dissuade FDI.<br />
Politically, the country remained stable, no surprise really<br />
given the massive dominance of President Hifikepunye<br />
Pohamba and the ruling South West <strong>Africa</strong> People’s<br />
Organisation (SWAPO) party.<br />
The local index seemed to take a cue from the positive<br />
economic developments and was the third best performing<br />
in SSA in <strong>2011</strong>.<br />
19<br />
EQUITY RESEARCH<br />
NAMIBIA<br />
FEBRUARY <strong>2012</strong><br />
<strong>2011</strong> REVIEW AND <strong>2012</strong> OUTLOOK<br />
Top 5 Gainers and Losers - <strong>2011</strong> Opening Closing % change % change<br />
Company Price Price (LC) (USD)<br />
NSX - Local 172.72 221.19 28.06% 3.62%<br />
Nictus 1.05 3.00 185.71% 131.18%<br />
Nambrew 7.86 12.00 52.67% 23.53%<br />
Shoprite 99.85 136.20 36.40% 10.37%<br />
Old Mutual 12.98 17.06 31.43% 6.35%<br />
Oceana Group 38.5 48.00 24.68% 0.88%<br />
Paladin Energy 33.57 10.94 -67.41% -73.63%<br />
Afrox 20.65 16.20 -21.55% -36.52%<br />
Investec 55.98 44.07 -21.28% -36.30%<br />
Anglo-American 345.43 296.40 -14.19% -30.57%<br />
Standard Bank 107.55 99.25 -7.72% -25.33%<br />
Source: NSX<br />
Top 10 shares by market cap.<br />
Company NAD (m) USD (m) % of Total<br />
Anglo-American plc 399 910 50 239 35.63%<br />
Standard Bank Group 157 683 19 809 14.05%<br />
Firstrand 117 720 14 789 10.49%<br />
Old Mutual Plc 98 953 12 431 8.82%<br />
Shoprite Holdings 74 022 9 299 6.59%<br />
Nedbank Group Limited 73 577 9 243 6.56%<br />
Sanlam Limited 60 585 7 611 5.40%<br />
Truworths 33 888 4 257 3.02%<br />
MMI Holdings Limited 25 673 3 225 2.29%<br />
Barloworld Limited 17 385 2 184 1.55%<br />
Source: NSX<br />
1.5<br />
1.4<br />
1.3<br />
1.2<br />
1.1<br />
1<br />
0.9<br />
0.8<br />
0.7<br />
0.6<br />
0.5<br />
01-Jan-11<br />
31-Jan-11<br />
Source: IAS/S&P<br />
NSX Local relative to S&P <strong>Africa</strong> Frontier Index<br />
02-Mar-11<br />
01-Apr-11<br />
01-May-11<br />
31-May-11<br />
30-Jun-11<br />
30-Jul-11<br />
29-Aug-11<br />
28-Sep-11<br />
NSX Local S&P <strong>Africa</strong> Frontier<br />
28-Oct-11<br />
27-Nov-11<br />
27-Dec-11
Market <strong>Review</strong> for <strong>2011</strong><br />
The NSX local index was one of the few indices that<br />
ended the year on a positive footing. The index gained<br />
28.06% in local currency terms and 3.62% in USD terms to<br />
close the year at 221.19 points. On the other hand, the<br />
NSX overall index lost 3.34% in local currency terms to<br />
close at 838.42 points.<br />
The key point, however, is the fact that the Namibian<br />
<strong>Stock</strong> Exchange (NSX) comprises mostly JSE dual-listed<br />
shares, with Anglo-American representing 36% of the<br />
total market capitalisation. Other big constituents<br />
include Standard Bank (14%), First Rand (10.5%), Old<br />
Mutual plc (8.8%) and Shoprite Holdings (6.6%). The seven<br />
listed local Namibian companies constitute less than 1.0%<br />
of total market capitalisation. The NSX local index is<br />
therefore less exposed to global market influences.<br />
Furthermore, local stocks have largely benefited from<br />
regulation forcing local asset managers to hold 35% of<br />
their portfolios in domestic companies. Thus, the NSX<br />
overall index tends to move in line with the JSE.<br />
Looking at performances, the top gainers in <strong>2011</strong> were<br />
Nictus (+185.71%), Nambrew (+52.67%), Shoprite<br />
(+36.40%), Old Mutual (+31.43%) and Oceana (+24.68%).<br />
Anchoring the losers were Standard Bank (-7.72%), Anglo<br />
American (-14.19%), Investec (-21.28%), Afrox (-21.55%)<br />
and Paladin Energy (-67.41%). Anglo American was the<br />
most active in terms of value traded as it constituted<br />
20.29% of the total, whilst Old Mutual was the most<br />
active by volume, contributing 25.07% to the total.<br />
Market Outlook for <strong>2012</strong><br />
GDP growth which has largely been propelled by<br />
investment in mining is expected to average between<br />
4.0% and 5.0% through to 2015. Growth in the mining<br />
sector should continue in <strong>2012</strong> owing to significant<br />
investments. Namibia was the world’s fourth largest<br />
producer of uranium in 2010 after Kazakhstan, Canada<br />
and Australia. Several new large-scale projects should<br />
significantly increase production in the medium term.<br />
We opine that Pohamba is likely to maintain SWAPO’s<br />
broadly pro-business policies to ensure Namibia<br />
continues to attract sizeable FDI inflows, particularly<br />
into the mining sector. FDI expanded 147% between<br />
2005 and 2010 to USD 858.0m and inflows are set to<br />
continue growing in <strong>2012</strong>, with investments in uranium,<br />
gold, manganese and marine phosphates projects and<br />
associated industrial projects associated industrial<br />
developments. We also expect external debt liabilities<br />
to remain relatively modest with little risk of external<br />
debt servicing problems.<br />
Namibia’s outlook is closely tied to that of South <strong>Africa</strong>,<br />
which may suffer from its relatively close connection to<br />
the sputtering developed markets in Europe. Given the<br />
fact that the NSX comprises mostly dual-listed shares<br />
(FTSE or JSE/FTSE) and that the NAD is pegged, one-toone<br />
against the ZAR (under the CMA agreement),<br />
prospects on the NSX overall are also hinged mainly on<br />
global factors. With the JSE expected to have a strong<br />
year given its performance thus far, we expect the NSX<br />
to follow suit.<br />
20<br />
10 most active stocks by volume<br />
Company Vol (m) % of total<br />
Old Mutual Plc 24.80 25.70%<br />
Firstrand 16.16 16.74%<br />
MMI Holdings Limited 15.14 15.69%<br />
Bidvest Namibia Limited 5.66 5.87%<br />
Afrox 4.99 5.17%<br />
Investec Limited 4.97 5.15%<br />
Sanlam Limited 4.44 4.60%<br />
Standard Bank Group 3.79 3.92%<br />
Barloworld Limited 2.81 2.91%<br />
Anglo-American plc 2.08 2.15%<br />
Source: NSX<br />
10 most active stocks by value<br />
Company Val (USD m) % of total<br />
Anglo-American plc 92.53 20.29%<br />
Standard Bank Group 52.16 11.44%<br />
Old Mutual Plc 49.04 10.75%<br />
Firstrand 44.68 9.80%<br />
MMI Holdings Limited 35.50 7.78%<br />
Investec Limited 34.34 7.53%<br />
Nedbank Group Limited 28.80 6.31%<br />
Barloworld Limited 26.86 5.89%<br />
Sanlam Limited 17.37 3.81%<br />
Truworths 16.67 3.65%<br />
Source: NSX<br />
Source: NSX<br />
9.63%<br />
35.63%<br />
1.55%<br />
Top Picks <strong>2012</strong><br />
Market Cap. Composition<br />
2.63%<br />
50.57%<br />
Financials<br />
Industrial Metals<br />
Retailers<br />
Industrials<br />
Others<br />
Our recommended strategy for investors on the NSX would<br />
be to focus on local equities;<br />
We like FNB Namibia given its consistency in earnings<br />
growth (CAGR of c13% over the past decade), a lucrative<br />
dividend payout ratio of 40% that is often augmented by<br />
special dividends (NAD 1.70 per share in FY 11), as well as<br />
stable and consistent growth in valuation.<br />
Nambrew is also unique in that is has penetrated regional<br />
premium markets in countries such as South <strong>Africa</strong> and<br />
Angola. Furthermore, it has managed to launch products in<br />
the UK, Cameroon, Kenya and Uganda through a global<br />
distribution, brewing and licensing agreement with Diageo<br />
Plc for some of its brands. At a forward PER of 12.0x,<br />
Nambrew definitely looks undemanding compared with its<br />
peers in SSA. While the share price has galloped to historic<br />
highs, we still see value in the stock.
With the banking sector expected to have stabilised in<br />
<strong>2011</strong> following the passing of the AMCON Bill and<br />
subsequent mopping up of NPLs from the sector to the<br />
tune of an estimated NGN 2.8tn or (cUSD 17.4bn), the<br />
NSE seemed set for a recovery, with the only caveat<br />
seemingly likely to arise from what was set to be a<br />
highly charged political environment with presidential<br />
elections set for <strong>2011</strong>.<br />
The election, finally held on 16 April after<br />
“administrative” delays, was conducted relatively<br />
peacefully and saw the incumbent, Goodluck Jonathan,<br />
garner 59% of the 38.2m votes cast, against 32% for his<br />
main rival, Muhammadu Buhari, a former military ruler<br />
from the country’s arid north. The conduct of the<br />
election was generally hailed as a big improvement on the<br />
polls held in previous years, and with the result meaning<br />
a continuation of the ruling PDP/Goodluck<br />
administration’s policy reform agenda, the plebiscite<br />
should have proved market positive, but it did not provide<br />
the spark required.<br />
All hope for the market then turned once again to the<br />
banking sector, as AMCON went about the business of<br />
cleaning up NPLs from the banking sector. With the mop<br />
up operation targeted for 31 October <strong>2011</strong>, AMCON’s CEO<br />
Mustafa Chike-Obi estimated that all in all the company<br />
would have purchased NGN 2.8tn (cUSD 17.4bn) in NPLs<br />
from 21 banks at a cost of about NGN 1.2tn. Aside from<br />
the NPL purchases, Bloomberg quoted Chike-Obi as saying<br />
AMCON had also bought loans that while performing were<br />
considered a risk to the sector, with 3 companies (Zenon<br />
Petroleum, Seawolf and Geometric) in particular owing<br />
various banks a combined NGN 275bn alone.<br />
Along with the AMCON clean-up, the Central Bank of<br />
Nigeria, CBN, also required that the rescued banks be<br />
recapitalised by 30 September <strong>2011</strong>. Wema Bank and<br />
Unity Bank were successfully recapitalised, while five<br />
banks entered into different M&A deals. Union Bank<br />
shareholders approved a USD 750m injection by a group of<br />
private equity investors led by <strong>Africa</strong>n Capital Alliance<br />
who now own 60% of its equity; Intercontinental Bank Plc<br />
merged with Access Bank; Oceanic Bank was recapitalised<br />
by Ecobank Transnational Inc and was to be merged with<br />
its Nigerian subsidiary Ecobank Plc; FinBank was taken<br />
over by FCMB and Equitorial Trust Bank was to be merged<br />
with Sterling Bank. In August, the CBN revoked the<br />
licenses of three banks for failing to show ability to<br />
recapitalise ahead of the deadline, for all intents and<br />
purposes nationalising Bank PHB, Afribank and Spring<br />
Bank. The assets of these banks were transferred to three<br />
newly created entities: Keystone Bank, Enterprise Bank<br />
and Mainstreet Bank, respectively.<br />
21<br />
1.5<br />
1.4<br />
1.3<br />
1.2<br />
1.1<br />
1<br />
0.9<br />
0.8<br />
0.7<br />
0.6<br />
0.5<br />
01-Jan-11<br />
31-Jan-11<br />
Source: IAS/S&P<br />
02-Mar-11<br />
01-Apr-11<br />
EQUITY RESEARCH<br />
NIGERIA<br />
FEBRUARY <strong>2012</strong><br />
<strong>2011</strong> REVIEW AND <strong>2012</strong> OUTLOOK<br />
Top 5 Gainers and Losers - <strong>2011</strong> Opening Closing % change % change<br />
Company Price Price (LC) (USD)<br />
NSE ASI 24 770.52 20 730.63 -16.31% -20.35%<br />
Roads Nigeria 3.01 8.69 188.70% 174.76%<br />
Union Bank 4.20 10.60 152.38% 140.20%<br />
Capital Hotel 3.30 6.78 105.45% 95.53%<br />
Champion Breweries 2.23 4.03 80.72% 71.99%<br />
Okomu Oil 15.20 23.10 51.97% 44.64%<br />
Paints & Coatings 3.36 0.52 -84.52% -85.27%<br />
Diamond Bank 7.50 1.92 -74.40% -75.64%<br />
Fidson Healthcare 3.06 0.79 -74.18% -75.43%<br />
CCNN 15.49 4.35 -71.92% -73.27%<br />
Dangote Sugar 16.00 4.70 -70.63% -72.04%<br />
Source: NSE<br />
Top 10 stocks by market cap.<br />
Company NGN (m) USD (m) % of total<br />
Dangote Cement 1 716.27 10 762.08 26.24%<br />
Nigerian Breweries 714.06 4 477.58 10.92%<br />
GT Bank 419.39 2 629.86 6.41%<br />
Zenith Bank 382.41 2 397.94 5.85%<br />
Guinness Nigeria 368.73 2 312.17 5.64%<br />
Nestle Nigeria 353.26 2 215.13 5.40%<br />
First Bank of Nigeria 290.43 1 821.15 4.44%<br />
Stanbic IBTC 155.63 975.86 2.38%<br />
Lafarge Wapco 129.82 814.05 1.99%<br />
ETI 129.80 813.95 1.98%<br />
Source: NSE<br />
NSE-ASI relative to S&P <strong>Africa</strong> Frontier Index<br />
01-May-11<br />
31-May-11<br />
30-Jun-11<br />
30-Jul-11<br />
29-Aug-11<br />
NSE ASI S&P <strong>Africa</strong> Frontier<br />
28-Sep-11<br />
28-Oct-11<br />
27-Nov-11<br />
27-Dec-11
Other positive developments that should have boosted<br />
market sentiment during the year included ongoing<br />
exchange reforms such as directing all stockbroking firms<br />
to segregate their accounts from those of clients, a new<br />
code of corporate governance for operators, the<br />
enforcement of minimum capital requirement for<br />
stockbroking firms, a commitment to push for the<br />
adoption of IFRS by all listed firms and active discussions<br />
around the demutualisation of the exchange.<br />
Despite the progress made towards resolving the banking<br />
sector crisis, as well as the aforementioned market<br />
reforms, the banking sector and the broader NSE index<br />
still closed the year in the red. We believe the main<br />
reasons for the market reticence in <strong>2011</strong> were reduced<br />
risk tolerance from foreign investors to frontier and<br />
emerging market equities because of Eurozone debt<br />
concerns as well as tight liquidity in Nigeria for much of<br />
the year as banks remained cautious with regards lending<br />
while the increase in the Monetary Policy Rate by the CBN<br />
from 6.25% in January to 12% in December made fixed<br />
income securities relatively more attractive versus<br />
equities, adding further downward pressure on the NSE.<br />
Market <strong>Review</strong> for <strong>2011</strong><br />
Given the above, the NSE All Share Index shed 16.31% to<br />
close at 20,730.63 in <strong>2011</strong>, (2010: +18.93%). The decline<br />
in USD terms was approximately 20.35%. All four quarters<br />
recorded negative returns during the year, with Q3 in<br />
particular taking the biggest hit, the market shedding<br />
17.51%. The Q3 performance was precipitated by the<br />
three bank nationalisations, the 30 September<br />
recapitalisation deadline, further monetary tightening by<br />
the CBN with new prudential guidelines being issued and<br />
political instability due to an escalation in Boko Haram<br />
bomb attacks, including an attack on the UN compound in<br />
Abuja in August. All four main NSE sector indices closed<br />
the year in the red, namely the Food & Beverage<br />
(-24.26%), Banking (-31.28%) and Oil & Gas (-35.04%),<br />
while the Insurance sector lost 14.73%.<br />
Total equity market capitalisation closed at NGN 6.54tn<br />
(cUSD 40.87bn) compared with NGN 7.92tn (cUSD 51.6bn)<br />
in 2010. There were no new listings in <strong>2011</strong>, where 2010<br />
had seen market behemoth Dangote Cement coming to<br />
market. The banking sector sub index, following its poor<br />
performance, lost its status as the most capitalised,<br />
contributing 28.16% (2010 – 34.20%) to the total equity<br />
market capitalisation and was overtaken by the<br />
admittedly Dangote Cement skewed building materials<br />
sector with 28.97%, (2010 - 26.00%). The breweries sector<br />
remained in third place, although with an increased<br />
contribution from 11.10% to 16.85%. Financials remained<br />
the most traded, with 61% of volumes and 58% of value.<br />
Looking at market activity, aggregate stock market<br />
turnover by volume between January and December <strong>2011</strong><br />
was 89.6bn shares (2010 - 93.3bn shares), a 3.97%<br />
decline, while value traded at NGN 634.9bn (2010 - NGN<br />
797.6bn) fell by 20.40%. In USD terms, value traded in<br />
<strong>2011</strong> equated to approximately USD 4.1bn compared with<br />
USD 5.4bn in 2010. Q1 was the most active quarter by<br />
volume and Q4 the most active by value.<br />
22<br />
The turnover ratio deteriorated to 8.36% from 12.51%.<br />
Foreign portfolio investment amounted to a net inflow of<br />
NGN 177.1bn, (2010 - NGN 171.0bn), or circa USD 1.2bn,<br />
with inflows amounting to NGN 511.7bn and outflows to<br />
NGN 334.6bn (2010 - NGN 350bn and NGN 178.8bn,<br />
respectively). Average volumes per day were 364.15m,<br />
while average value traded was approximately USD<br />
16.99m (2010 - 377.9m shares and USD 21.1m<br />
respectively).<br />
10 most active stocks by volume<br />
Company Vol (bn) % of total<br />
Transcorp 8.24 9.20%<br />
Zenith Bank 7.76 8.66%<br />
Guaranty Trust Assurance 7.60 8.48%<br />
First Bank of Nigeria 5.98 6.68%<br />
UBA 5.22 5.82%<br />
GTB 4.45 4.96%<br />
Access Bank 3.33 3.72%<br />
Diamond Bank 2.72 3.03%<br />
Fidelity Bank 2.66 2.97%<br />
Skye Bank<br />
Source: NSE<br />
1.49 1.66%<br />
Nigeria<br />
10 m ost active stocks by value<br />
Company Val (USD m) % of total<br />
Zenith Bank 721.69 17.53%<br />
First Bank 477.74 11.61%<br />
Guaranty Trust Bank 446.48 10.85%<br />
Nigerian Breweries 239.70 5.82%<br />
UBA 186.43 4.53%<br />
Oando 169.31 4.11%<br />
Access Bank 155.04 3.77%<br />
Guinness Nigeria 130.79 3.18%<br />
Nestle Nigeria 107.18 2.60%<br />
Flour M ills Nigeria<br />
Source: NSE<br />
102.65 2.49%<br />
0.95%<br />
0.52%<br />
Source: NSE<br />
0.13% 3.33%<br />
29.27%<br />
1.05%<br />
Market Cap. Composition<br />
30.82%<br />
0.34%<br />
0.98% 1.98%<br />
30.64%<br />
Agriculture<br />
Conglomerates<br />
Const./Real Estate<br />
Consumer Goods<br />
Financial Services<br />
Healthcare<br />
ICT<br />
Industrial Goods<br />
Natural Resources<br />
Oil & Gas<br />
Services
Market Outlook for <strong>2012</strong><br />
While we had thought politics would potentially be the<br />
only caveat in our relatively bullish expectations for the<br />
market in <strong>2011</strong> with the banks driving a recovery, the<br />
reverse turned out to be the case, as the elections were a<br />
success while the banking sector remained in the<br />
doldrums.<br />
In <strong>2012</strong>, politics have already shown that it will be a<br />
major factor, with Goodluck Jonathan having already had<br />
to deal with a civil service strike related to his attempts<br />
to remove the fuel levy (estimated cost USD 8bn a year)<br />
as part of his reform agenda, while the militant group<br />
Boko Haram, has escalated its attacks in the country’s<br />
second city of Kano in the North, adding fire to the<br />
tenuous political environment and by extension, investor<br />
concerns.<br />
The fuel levy issue seems to have been resolved, for now,<br />
with a compromise that saw a 50% reduction in the fuel<br />
levy, taking the price of petrol to NGN 97/l from NGN<br />
65/l (full subsidy removal would have seen the price<br />
shoot up to NGN 141/l).<br />
With regards Boko Haram, Goodluck has vowed to hunt<br />
down and crush the grouping, and will need to show a<br />
strong hand to maintain a semblance of control and<br />
order. This however, is likely to lead to increased attacks<br />
by Boko Haram in response. While we don't expect this to<br />
escalate to widespread civil strife/Muslim vs. Christian<br />
violence, we think the situation will remain volatile in the<br />
short to medium term.<br />
Implications for the market of the above are that while<br />
we see value on the NSE, particularly in the banks which<br />
are now on a much more solid footing, investors are likely<br />
to remain circumspect about the environment and this<br />
will see the NSE oscillating around current levels. Any<br />
continued delays in resolving the Eurozone issues will also<br />
add to the risk aversion Nigeria’s internal problems may<br />
create, which will further limit foreign investor<br />
participation which is crucial to liquidity in a market in<br />
which foreign investors contribute more than 70% to<br />
market activity. Relatively high rates on the fixed income<br />
side may also continue to see local investors reticent<br />
about the equities market, as the effects of the fuel<br />
increase on inflation are likely to see the CBN maintaining<br />
a tight monetary policy.<br />
Despite the immediate challenges facing Nigeria, the<br />
longer term prospects for the economy and by extension<br />
the market, remain positive. The World Bank in its<br />
‘Global Economic Prospects January <strong>2012</strong>’ notes that<br />
growth prospects for Nigeria remain “robust, forecast at<br />
7.1% and 7.4% for <strong>2011</strong> and <strong>2012</strong> respectively, driven<br />
again, by the non-oil sector, primarily on the consumer<br />
front. We expect consumer driven stocks to reflect this<br />
growth in the future and would encourage investors to<br />
look for value while the market is seemingly out of<br />
favour.<br />
23<br />
Top Picks for <strong>2012</strong><br />
We continue to see plenty of value in the Nigerian<br />
banking sector in particular, with ironically, its liquidity<br />
counting against it as the primary exit for the “risk off”<br />
trade. The wider consumer and infrastructure related<br />
sectors should also remain on the radar screen. Our top<br />
picks are the following:<br />
Banking<br />
Access Bank – In our view likely to be the biggest<br />
beneficiary of the sector’s M & A activity. Well run bank,<br />
middle market focus a differentiator.<br />
ETI – Oceanic acquisition to give it critical mass in<br />
Nigeria, which is a huge positive; has also scaled up in<br />
Ghana with Trust Bank acquisition; Nedbank alliance<br />
could become more tangible if Nedbank exercises<br />
convertible option and takes up equity.<br />
First Bank – Top tier bank, remains Nigeria’s largest by<br />
most metrics, in a market where size is viewed as a sign<br />
of safety and stability, while enabling it to consistently<br />
write large ticket business.<br />
GTB – Impressive management team; technologically<br />
driven growth strategy; strong presence in the corporate<br />
market. Remains our favourite pick in the sector.<br />
Zenith Bank – Another of the tier 1 banks, well placed to<br />
benefit from Nigeria’s growth. Very liquid, so room to<br />
grow risk assets and profitability. Ex-Nigeria operations<br />
profitable, should add further to profits going forward.<br />
Consumer<br />
Nigerian Breweries – High current PER, but Nigeria’s per<br />
capita beer consumption remains low at c7.0l pp<br />
suggesting massive potential upside. Has consolidated its<br />
position in the sector via acquisition.<br />
Flour Mills Nigeria - Attractive valuation, arguably the<br />
best value proposition among Nigerian consumer<br />
companies; 50% of the Nigerian flour market share;<br />
cement business set to contribute positively to the group.<br />
PZ Cussons – Benefiting from improved efficiency<br />
following plant rehabilitation, diversified product mix<br />
with white goods expected to underpin performance.<br />
UACN – Ideally placed to benefit from growing middle<br />
class consumers; JV with Tiger Brands making solid<br />
progress; actively pursuing franchise model.<br />
Infrastructure<br />
CCNN – Speculative buy. The program to raise funds and<br />
implement the expansion and energy source substitution<br />
is now in motion; share price expected to recoup some of<br />
its losses, while a gain in installed capacity share<br />
indicates brighter business prospects post the expansion.
Rwanda fared better than its EAC peers in <strong>2011</strong> with the<br />
RWF largely retaining its purchasing power and inflation<br />
remaining in single digit territory. The <strong>2011</strong> GDP growth<br />
outturn is expected at 8.8%, an improvement from<br />
2010’s 7.5%, although it is expected to slide to 7.6% in<br />
<strong>2012</strong>. Better than expected growth from the<br />
agricultural sector, underpinned by the government<br />
sponsored Crop Intensification Program (CIP) was the<br />
key driver in <strong>2011</strong> and we expected agriculture to play a<br />
similar pivotal role in <strong>2012</strong>.<br />
While inflation rose and the RWF depreciated in <strong>2011</strong>,<br />
Rwanda was not impacted to the extent observed<br />
amongst some of its EAC peers. The National Bank of<br />
Rwanda (RNB), hiked its key repo rate in October from<br />
6.0% to 6.5% in response to spiking y-o-y inflation which<br />
rose from 0.2% in December 2010 to reach 8.3% in<br />
December <strong>2011</strong>. A region wide improvement in food<br />
supply is however expected to ease inflationary<br />
pressures in <strong>2012</strong>, but for Rwanda, expectations are<br />
that further monetary tightening will be required to<br />
tame inflation.<br />
The RWF, likewise, depreciated by a smaller margin<br />
compared to EAC peers, opening the year at USD/RWF<br />
584.40 and ending <strong>2011</strong> 1.8% weaker at USD/RWF<br />
594.95. Indications are that the RWF will remain<br />
resilient in <strong>2012</strong>, especially given improvements in local<br />
food supply and the fact that it retained its lustre in the<br />
face of significant headwinds in <strong>2011</strong>.<br />
Market <strong>Review</strong> for <strong>2011</strong><br />
The Rwanda <strong>Stock</strong> Exchange (RSE) officially commenced<br />
operations in Q1 11 as Brasseries eLimonaderies du<br />
Rwanda (Bralirwa), a government exit, debuted. Four<br />
counters have since been listed with the second<br />
domestic stock; Bank of Kigali (BoK) – another<br />
government exit, coming on board in H2 11 via an IPO.<br />
Other listed counters are National Media Group and<br />
KCB, both with primary listings in Kenya. The RSE is yet<br />
to have an index, but, with the number of listed<br />
companies increasing, we expect one to be created<br />
soon.<br />
Activity started slowly, but peaked progressively during<br />
the year. A total of 118m shares worth USD 207m<br />
changed hands with BoK accounting for half of the<br />
volumes and BRALIRWA weighing in with 60.8% of<br />
turnover. Domestic listings were the most liquid and we<br />
expect the trend to be carried forward into <strong>2012</strong> with<br />
activity improving as and when more local companies<br />
list.<br />
24<br />
EQUITY RESEARCH<br />
RWANDA<br />
FEBRUARY <strong>2012</strong><br />
<strong>2011</strong> REVIEW AND <strong>2012</strong> OUTLOOK<br />
Gainers and losers - <strong>2011</strong> Opening Closing % Change % Change<br />
Company Price Price (LC) (USD)<br />
BRALIRWA 136 333 144.85% 140.20%<br />
NMG 1 200 1 200 0.00% -1.90%<br />
KCB 174 175 0.57% -1.33%<br />
BOK 125 127 1.60% -0.33%<br />
Rank by market c ap. RWF (m) USD (m) % of Total<br />
KCB 1 391 608 2 338.42 61.63%<br />
National Media Group 501 522 842.75 22.21%<br />
BRALIRWA 287 624 483.32 12.74%<br />
Bank of Kigali 77 431 130.11 3.43%<br />
Activity by volume Vol (m ) % of Total<br />
Bank of Kigali 60.45 51.17%<br />
BRALIRWA 57.67 48.82%<br />
KCB 0.01 0.01%<br />
NMG 0.00 0.00%<br />
Activity by value Val (USD '000) % of Total<br />
BRALIRWA 126 538 60.85%<br />
Bank of Kigali 81 407 39.14%<br />
KCB<br />
Source:IAS/RSE<br />
22 0.01%<br />
Market <strong>Review</strong> for <strong>2011</strong><br />
Rwanda has been among the top global performers on<br />
the IFC’s ‘Doing Business’ report which should augur<br />
well for FDI going forward. The country wants to<br />
establish itself as a regional technology hub with the<br />
completion of a 3,200km national fibre-optic backbone<br />
testifying to that conviction. However, <strong>2012</strong> GDP growth<br />
is expected to show a slowdown, with the World Bank<br />
forecasting 7.6% for <strong>2012</strong> on the back of anticipated<br />
anti-inflation monetary tightening. Further government<br />
exits from companies such as MTN, CEMERWA and<br />
Sonarwa are, nonetheless, expected to spur activity at<br />
the RSE in <strong>2012</strong>, should they occur. We do not expect<br />
any significant changes in the trading trend; domestic<br />
listings are expected to dominate with activity<br />
progressively improving as the RSE’s visibility increases.<br />
Top Pick for <strong>2012</strong><br />
BRALIRWA is the leading beer and sparkling beverages<br />
producer in Rwanda and is 75% owned by the Heineken<br />
Group. It has two subsidiaries, Bramin, a maize growing<br />
company and Cogelgas, a company involved in methane<br />
gas production. Rwanda’s per capita beer consumption<br />
of 7.0l pp is way below the East <strong>Africa</strong>n peers average<br />
(Kenya 11l and Burundi 18l pp) and we believe that this<br />
gap represents upside potential for Bralirwa.
Developments in the oil and gas sector dominated the<br />
Ugandan landscape, notwithstanding the fact that<br />
production was only expected to commence properly in<br />
<strong>2012</strong>. The glaring regulatory deficiencies in the sector<br />
and corruption allegations were topical in <strong>2011</strong> and look<br />
set to remain so ahead of the commencement of full<br />
production. Additionally Uganda held elections early in<br />
the year in which the incumbent, Yoweri Museveni,<br />
won. The results were disputed and sowed more seeds<br />
of political tension that subsequently erupted into food<br />
riots in Q2 11. Uganda has seen further organised<br />
protests at the onset of <strong>2012</strong> as business operators<br />
closed their shops to register their displeasure with the<br />
rising cost of borrowing, while the main challenger in<br />
the election, Dr Kizza Besigye, was barred from carrying<br />
out demonstrations.<br />
The <strong>2011</strong> GDP outturn is expected to be 6.3%, having<br />
declined from 2010’s 6.4%, with <strong>2012</strong> forecast to post<br />
6.2% growth. <strong>2011</strong> had its fair share of challenges, with<br />
significant headwinds emanating from spiralling<br />
inflation and the depreciation of the UGX. Y-o-y<br />
inflation closed 2010 at 3.10%, peaked at 30.4% in<br />
October <strong>2011</strong> and ended the year showing signs of<br />
relenting at 27.0%. The UGX on the other hand opened<br />
the year at USD/UGX 2,288, sank to an all-time low of<br />
USD/UGX 2,887 in October and recouped a huge chunk<br />
of its losses to end the year at USD/UGX 2,359.<br />
Food price shocks on the back of a crippling drought in<br />
East <strong>Africa</strong> and rising energy prices occasioned by<br />
political disturbances in the major oil supplying MENA<br />
region, coupled with low hydro-electricity generation<br />
capacity, were the key drivers. With agriculture<br />
stuttering, exports for the largely agricultural economy<br />
suffered. As a result, the BOP position worsened with<br />
consensus forecasts pointing to a deficit of c12.1% in<br />
<strong>2011</strong>. However, with oil inflows expected in <strong>2012</strong>, we<br />
expect the situation to turn quickly.<br />
The Bank of Uganda (BoU) responded by adopting a<br />
tightening monetary stance, progressively hiking the<br />
bank rate from 13% in July to 23% in November <strong>2011</strong>.<br />
This, together with improved agricultural output on the<br />
back of good rainfalls has been pivotal in propping up<br />
the UGX and easing inflationary pressures. The BoU’s<br />
remedial strategies, however, brought about additional<br />
hardships to ordinary citizens and further stoked the<br />
flames of social unrest.<br />
25<br />
EQUITY RESEARCH<br />
UGANDA<br />
FEBRUARY <strong>2012</strong><br />
<strong>2011</strong> REVIEW AND <strong>2012</strong> OUTLOOK<br />
Top 5 gainers and losers - <strong>2011</strong> Opening Closing % Change % Change<br />
Company Price Price (LC) (USD)<br />
USE ALSI 1 188.07 864.45 -27.24% -32.17%<br />
DFCU 822 1 000 21.65% 13.40%<br />
New Vision 580 700 20.69% 12.51%<br />
BAT Uganda 1 740 1 960 12.64% 5.00%<br />
National Insurance Corporation 70 75 7.14% -0.12%<br />
KCB Group 619 488 -21.16% -26.51%<br />
Equity Bank Limited 762 488 -35.96% -40.30%<br />
Bank of Baroda Uganda 504 230 -54.37% -57.46%<br />
Kenya Airways 1 323 602 -54.50% -57.58%<br />
Stanbic Bank Uganda<br />
Source: USE<br />
268 120 -55.22% -58.26%<br />
Top 10 shares by market cap.<br />
Company UGX (m) USD (m) % of Total<br />
East <strong>Africa</strong> Breweries Ltd. 3 994 990 1 631.22 37.91%<br />
Equity Bank Ltd 1 806 960 737.81 17.14%<br />
KCB Group 1 439 680 587.85 13.66%<br />
Stanbic Bank Uganda 1 228 530 501.63 11.66%<br />
National Media Group 646 070 263.80 6.13%<br />
Kenya Airways 277 890 113.47 2.64%<br />
DFCU Ltd 248 600 101.51 2.36%<br />
Centum Investment Co. 241 370 98.56 2.29%<br />
Bank of Baroda Uganda 230 000 93.91 2.18%<br />
Jubulee Holdings<br />
Source: USE<br />
204 840 83.64 1.94%<br />
1.5<br />
1.4<br />
1.3<br />
1.2<br />
1.1<br />
1<br />
0.9<br />
0.8<br />
0.7<br />
0.6<br />
0.5<br />
01-Jan-11<br />
31-Jan-11<br />
Source: IAS/S&P<br />
USE ALSI relative to S&P <strong>Africa</strong> Frontier Index<br />
02-Mar-11<br />
01-Apr-11<br />
01-May-11<br />
31-May-11<br />
30-Jun-11<br />
30-Jul-11<br />
29-Aug-11<br />
28-Sep-11<br />
USE ALSI S&P <strong>Africa</strong> Frontier<br />
28-Oct-11<br />
27-Nov-11
Market <strong>Review</strong> for <strong>2011</strong><br />
The stock market performed largely in line with<br />
developments in the broader economy with the USE ALSI<br />
shedding 27.24% to close the year at 862.45 points and<br />
the USE LCI, likewise, giving up 39.01% from its<br />
inception in February <strong>2011</strong> to end the year at 225.14<br />
points. Capital shunned equities in favour of high<br />
yielding government securities and the weak demand<br />
sent share prices lower. Carry trades dominated fixed<br />
income investments and were pivotal for the aggressive<br />
appreciation of the UGX in Q4 11.<br />
Total market capitalisation slipped from USD 5.6bn in<br />
2010 to USD 4.5bn. This was, however, on the back of<br />
improved activity as 268m shares worth USD 21.46m<br />
changed hands, compared to 225m shares valued at USD<br />
16.84m for 2010. The domestic listings’ market<br />
capitalisation, on the other hand, slipped 2.68% to USD<br />
0.82bn and moved 158m shares worth USD 14.38m.<br />
Stanbic Bank Uganda (SBU) was the most active<br />
counter, accounting for 72% of total volumes and more<br />
than half of <strong>2011</strong>’s total turnover. Domestic listings<br />
were the most liquid and we expect the same trend to<br />
be carried forward into <strong>2012</strong>. Corporate activity was<br />
however low in <strong>2011</strong> with Centum Investments Company<br />
being the sole addition via a cross listing and only two<br />
companies undertaking capital calls.<br />
Market Outlook for <strong>2012</strong><br />
On the domestic scene, headwinds that dragged<br />
performance have shown clear signs of easing. The UGX<br />
has largely recovered and we expect it to be broadly<br />
stable in <strong>2012</strong>, although the risk of instability remains<br />
tied mainly to the price of oil. In the future, however,<br />
we expect this risk to reduce as Uganda transforms from<br />
an oil importer to an exporter. We expect inflation to<br />
decline with the pace quickening in H2 <strong>2012</strong> as high<br />
base effects kick in. Electricity tariff hikes in January<br />
<strong>2012</strong>, however, pose the greatest risk to our model. The<br />
government expects to pass on a 45% hike to consumers<br />
which we expect to have significant implications for<br />
inflation, regardless of the fact that the country was<br />
already facing acute power shortages with expensive<br />
diesel powered generators used as backup power<br />
sources.<br />
Eurozone sovereign debt challenges on the other hand<br />
occasioned lower foreign participation across SSA<br />
markets, Uganda included. Consensus among analysts is<br />
that a recession in the Eurozone is inevitable and that<br />
the US Economy is going to post slower growth in <strong>2012</strong>.<br />
<strong>Africa</strong>, alongside other emerging economies is,<br />
however, expected to more or less maintain its growth<br />
tempo, all things being equal. Despite this, the picture<br />
is thus not convincing regarding investors taking on risk<br />
and hence we do not expect activity among foreign<br />
investors to scale pre-Lehman levels.<br />
26<br />
10 most ac tive stoc ks by volume<br />
Company Vol ('000' ) % of T otal<br />
Stanbic Bank Uganda 193 358.5 72.24<br />
Uganda Clays Ltd. 28 057.5 10.48<br />
Bank of Baroda Uganda 21 863.2 8.17<br />
National Insurance Corporation 11 270.2 4.21<br />
Centum Investment 5 408.2 2.02<br />
DFCU Ltd. 4 583.3 1.71<br />
New Vision 2 937.4 1.10<br />
BAT Uganda 166.5 0.06<br />
Equity Bank Ltd. 2.1 0.00<br />
KCB Group<br />
Source: USE/IAS<br />
1.9 0.00<br />
10 most ac tive stoc ks by value<br />
Company Val (USD) % of T otal<br />
Stanbic Bank Uganda 11 915 510 58.71<br />
Bank of Baroda Uganda 3 300 653 16.26<br />
DFCU Ltd. 1 785 283 8.80<br />
Centum Investment 1 451 868 7.15<br />
New Vision 959 521 4.73<br />
Uganda Clays Ltd. 507 182 2.50<br />
National Insurance Corporation 299 122 1.47<br />
BAT Uganda 74 261 0.37<br />
Equity Bank Limited 647 0.00<br />
KCB Group<br />
Source: USE/IAS<br />
533 0.00<br />
37.91%<br />
0.38%<br />
0.91%<br />
6.64%<br />
Top Pick for <strong>2012</strong><br />
Source: USE/IAS<br />
Market Cap. Composition<br />
2.64%<br />
51.52%<br />
Banking and Finance<br />
Media<br />
Tobacco<br />
Industrial<br />
Beverages<br />
Commercial Services<br />
Stanbic Bank Uganda: SBU is Uganda’s biggest bank by<br />
market capitalisation, branch network and balance<br />
sheet. The bank is better poised than its listed peers to<br />
benefit most from the anticipated oil boom. Uganda’s<br />
biggest bank operates 98 branches which are<br />
complimented by more than 200 points of<br />
representation (ATMS and POS terminals) and focuses on<br />
personal, business, corporate and investment banking<br />
services. SBU stands out because it shed more than half<br />
of its value in <strong>2011</strong>, driven we believe, largely by<br />
expected mark to market losses on its bond portfolio.<br />
With interest rates now expected to trend lower in line<br />
with inflation, we expect this position to reverse and<br />
the share price to recoup some of its losses.
Efforts by the Bank of Tanzania (BoT) to prop up the<br />
depreciating TZS and bring down spiralling inflation<br />
were the major highlights for Tanzania. Like some of its<br />
EAC peers, Tanzania saw inflation soar to double digit<br />
figures and the TZS hit all-time lows. Strategies<br />
implemented have shown signs of success as inflationary<br />
pressures have generally eased and the TZS recouped<br />
some of its losses. The country is undertaking<br />
unprecedented infrastructure investments especially in<br />
housing and roads with more planned for the energy<br />
sector. On the political front, Tanzania has commenced<br />
on a constitution making process that has since proved<br />
to be divisive and looks set to shake the country’s<br />
hitherto stable political climate.<br />
The <strong>2011</strong> GDP growth outturn is expected at 6.4% and<br />
the World Bank forecasts 6.7% for <strong>2012</strong>. The country<br />
faces significant structural issues that have retarded<br />
economic growth, the major one being a massive<br />
infrastructure deficit, particularly in housing, roads,<br />
railways and power generation. We expect that<br />
investments in an effort to plug this gap will underpin<br />
growth in <strong>2012</strong> and beyond.<br />
Inflation (y-o-y) opened the year at 4.2% and reached<br />
19.2% in December <strong>2011</strong>, and while we believe the rate<br />
is yet to peak, a strengthening currency and improving<br />
food supply suggest that the top is near. The TZS on the<br />
other hand opened the year at USD/TZS 1,450, slipped<br />
to a low of USD/TZS 1,749 in November <strong>2011</strong> and closed<br />
the year at USD/TZS 1,572 having appreciated<br />
remarkably from the November lows. The drivers<br />
remain the same; the food price shocks that wreaked<br />
havoc in East <strong>Africa</strong> and a burgeoning energy bill<br />
emanating from higher oil prices and exacerbated by<br />
low electricity generation capacity in the region.<br />
The BoT adopted a tighter monetary policy, hiking the<br />
minimum reserve ratio from 20% to 30% in a bid to mopup<br />
liquidity. Additionally, the BoT lowered the foreign<br />
exchange net open position limit for banks from 20% to<br />
10% in a bid to discourageholding speculative positions.<br />
Positive results have subsequently been achieved on the<br />
currency front, but y-o-y inflation remains stubborn. We<br />
expect further monetary tightening as Tanzania fights<br />
inflation which should maintain the drag on economic<br />
activity.<br />
27<br />
S<br />
EQUITY RESEARCH<br />
TANZANIA<br />
FEBRUARY <strong>2012</strong><br />
<strong>2011</strong> REVIEW AND <strong>2012</strong> OUTLOOK<br />
Top 5 gainers and losers - <strong>2011</strong> Opening Closing % Change % Change<br />
Company Pric e Pric e (LC) (USD)<br />
DSEI 1 163.89 1 303.23 11.97% 5.14%<br />
Dar Es Salaam Community Bank 280 640 128.57% 143.43%<br />
CRDB Bank 115 172.5 50.00% 59.75%<br />
Tanzania Cigarette Company 2 220 3 140 41.44% 50.64%<br />
Swissport Tanzania 600 820 36.67% 45.55%<br />
Nation Microfinance Bank 660 850 28.79% 37.16%<br />
Kenya Airways 1 300 1 020 -21.54% -16.44%<br />
TATEPA<br />
Source: DSE/IAS<br />
490 265 -45.92% -42.40%<br />
Top Ten Shares by Market Cap.<br />
Company TZS (m) USD (m) % of Total<br />
<strong>Africa</strong>n Barrick Gold 5 396 725 3 692 46.62%<br />
East <strong>Africa</strong>n Breweries 1 317 957 902 11.38%<br />
Kenys Commercial Bank 1 298 074 888 11.21%<br />
Tanzania Breweries 595 755 408 5.15%<br />
National Media Group 487 068 333 4.21%<br />
Kenya Airways 470 848 322 4.07%<br />
Nation Microfinance Bank 425 000 291 3.67%<br />
CRDB Bank 375 452 257 3.24%<br />
TWIGA 374 240 256 3.23%<br />
Tanzania Cigarette<br />
Source: DSE/IAS<br />
314 000 215 2.71%<br />
1.5<br />
1.4<br />
1.3<br />
1.2<br />
1.1<br />
1<br />
0.9<br />
0.8<br />
0.7<br />
0.6<br />
0.5<br />
01-Jan-11<br />
31-Jan-11<br />
Source: IAS/S&P<br />
02-Mar-11<br />
DSEI vs S&P <strong>Africa</strong> Frontier Index<br />
01-Apr-11<br />
01-May-11<br />
31-May-11<br />
30-Jun-11<br />
30-Jul-11<br />
29-Aug-11<br />
DSEI S&P <strong>Africa</strong> Frontier<br />
28-Sep-11<br />
28-Oct-11<br />
27-Nov-11<br />
27-Dec-11
Market <strong>Review</strong> for <strong>2011</strong> 10 Most active stocks by volume<br />
The DSEI closed 11.97% firmer at 1,303.23 points with a<br />
total of 131.64m shares worth USD 31.98m changing<br />
hands in <strong>2011</strong>. NMB dominated, accounting for 35.80%<br />
of volumes, while CRDB Bank weighed in with 65.61% of<br />
turnover. Banks had a good year with three making it to<br />
the top five and Dar-es-Salaam Community Bank topping<br />
the charts for <strong>2011</strong>.<br />
<strong>2011</strong> saw Nation Media Group of Kenya and <strong>Africa</strong>n<br />
Barrick Gold, a United Kingdom domiciled gold miner<br />
with assets in various <strong>Africa</strong>n countries, cross listing on<br />
the DSE. Additionally Precision Air Services, Tanzania’s<br />
foremost carrier which is partly owned by Kenyan<br />
Airways,undertook an IPO. On the other Hand, National<br />
Investment Company was delisted and the DSE closed<br />
the year with seventeen listed counters.<br />
Market Outlook for <strong>2012</strong><br />
The year began with the government introducing<br />
reforms in the energy sector and we believe this,<br />
together with the drafting of the new constitution, will<br />
be <strong>2012</strong>’s topical issues. Infrastructure projects, in<br />
particular road construction, (funded by a USD 250m<br />
syndicated bank loan), will also stand out and help<br />
underpin growth which otherwise should be dragged<br />
down by the tight monetary regime. Additionally,<br />
Tanzania has plans to issue a sovereign USD 500m Euro<br />
bond to fund infrastructure development and we expect<br />
the process that generally stalled in <strong>2011</strong> to reach a<br />
conclusion in <strong>2012</strong>.<br />
Public investment in power generation is receiving a lot<br />
of air play especially from legislators who have become<br />
more vocal. Tanzania has been relying on more<br />
expensive emergency power plans, a reality that will<br />
sadly remain with the country for the rest of <strong>2012</strong>. Two<br />
long term projects however stand out; a USD 684m<br />
Chinese sponsored gas fired plant at Mnazi Bay and a<br />
USD 3bn coal fired plant at Mchuchuma, with a<br />
combined capacity of 1,000MW. Both projects can only<br />
bring relief in the long term, but for now, Tanzania will<br />
continue to rely on expensive options which have the<br />
potential of sustaining inflationary pressures.<br />
We do not expect a significant shift in historic trading<br />
patterns in <strong>2012</strong>. Domestic listings are expected to<br />
continue dominating and the market is expected to<br />
register yet another positive year.The regulatory limit<br />
to foreign ownership of DSE listed shares has kept<br />
foreign participation low and hence the market rarely<br />
reflects international trends. Tanzania allows only 60%<br />
foreign ownership in DSE listed stocks. The country is<br />
however looking at undertaking reforms that will see<br />
the restrictions fall away. This is being promoted at the<br />
EAC level and there is a strong possibility that the<br />
mooted regional stock exchange will emerge with time.<br />
28<br />
Company Vol (m) % of total<br />
CRDB Bank 86.36 65.61%<br />
NMB 22.79 17.31%<br />
TATEPA 9.75 7.41%<br />
DCB 6.66 5.06%<br />
Tanzania Cigarette 2.13 1.62%<br />
Twiga 1.73 1.31%<br />
TBL 1.10 0.84%<br />
Swissport 0.48 0.36%<br />
Tanga Cement 0.46 0.35%<br />
Tol Gases 0.14 0.11%<br />
Source: DSE<br />
10 Most active stocks by value<br />
Company Val (USD m) % of total<br />
NMB 11.45 35.80%<br />
CRDB Bank 9.33 29.16%<br />
Tanzania Cigarette 3.42 10.69%<br />
Twiga 2.17 6.77%<br />
DCB 2.00 6.24%<br />
TATEPA 1.44 4.50%<br />
TBL 1.33 4.16%<br />
Tanga Cement 0.62 1.94%<br />
Swissport 0.22 0.68%<br />
Tol Gases 0.02 0.06%<br />
Source: DSE<br />
46.62%<br />
Source: IAS<br />
4.21%<br />
<strong>Stock</strong> Picks for <strong>2012</strong><br />
Market Cap. Composition<br />
5.15%<br />
Commercial Services<br />
16.53%<br />
20.13%<br />
2.83%<br />
4.54%<br />
Beverages<br />
Manufacturing<br />
Construction and allied<br />
Banking and Fi nancial Services<br />
Mining<br />
Media<br />
Tanga Cement – 62.30% owned by Holcim; 1.25mtpa<br />
installed capacity and 34% of Tanzania cement market;<br />
relatively among the cheapest cement stocks in SSA.<br />
Twiga Cement - 69% owned by Heidelberg Cement. The<br />
company has 1.4mtpa installed capacity and 42% of Dares-Salaam<br />
market. Like Tanga, foreign ownership limit<br />
is the biggest value trap and we expect the price to<br />
firm once shareholder restrictions are lifted.<br />
Tanzania Breweries Limited - Tanzania’s foremost<br />
brewer; we expect changing consumer dynamics due to<br />
rapid urbanisation, a growing population and increasing<br />
disposable incomes to underpin performance.
For Zambia, the year <strong>2012</strong> proved to be a highly<br />
“eventful” one both on and off the capital markets; and<br />
both domestically and internationally. With global<br />
instability arising from uncertainty in the Eurozone owing<br />
to the extent of its debt crisis, global commodities<br />
markets were volatile to the detriment of the copper<br />
price. Despite less than stellar copper prices globally, the<br />
commensurately flat y-o-y copper production for Zambia,<br />
and GDP expectations falling 1.1% short of the revised<br />
7.6% GDP growth earlier projected for <strong>2011</strong>, corporate<br />
actions on the LuSE increased relative to the prior year.<br />
Meanwhile, the September <strong>2011</strong> presidential elections<br />
spelt the end of 20 years of rule by the Movement for<br />
Multi-Party Democracy (MMD). The result was the ushering<br />
in of current president Michael Chilufya Sata and his propoor<br />
Patriotic Front (PF) Party. Unafraid to ruffle<br />
feathers, Sata, while toning down on the rhetoric towards<br />
Chinese investment into the country, moved against other<br />
transactions involving foreign investors that he felt<br />
needed to be reviewed. One example was the cancellation<br />
of the sale of Finance Bank, Zambia’s fifth largest, to<br />
South <strong>Africa</strong>’s FirstRand Group, citing “political<br />
motivation” in the sale of the bank which had been put<br />
under administration. This occurred following Sata’s<br />
appointment of a new central bank governor as well as<br />
finance and mines’ ministers.<br />
Talk of mine nationalisation did the rounds around<br />
election time, adding to investor uncertainty (the<br />
currency temporarily hit a 12 month low against the USD<br />
the morning Sata’s election victory was). However, the<br />
new government subsequently reiterated that this was not<br />
the intention, although royalties and taxes for the<br />
industry would be looked at. A ban on metal exports to<br />
“sort out irregularities and increase transparency” on<br />
copper exports lasted just two days, while the <strong>2012</strong><br />
budget saw minerals royalties double from 3% to 6% for<br />
base metals and to 6% from 5% for precious metals.<br />
The World Bank estimates that GDP growth for Zambia in<br />
<strong>2011</strong> was 6.8%, while initial forecasts by the Central<br />
Statistical Office point to real GDP growth of circa 6.5%<br />
for the year, which is 0.3% and 0.1% higher than the <strong>2011</strong><br />
projection made in our last report respectively. Similar to<br />
2010, we expect the key contributors to GDP in <strong>2011</strong> to<br />
be: mining – and specifically copper mining on the back of<br />
similar aggregate production in <strong>2011</strong> relative to 2010;<br />
agriculture – which is expected to contribute marginally<br />
higher to GDP owing to a third successive maize bumper<br />
harvest, and attract investment, notably in the biofuels<br />
sector; energy – with various new power projects planned<br />
or commenced in <strong>2011</strong>, the sector attracted significant<br />
investment; and construction, which remains a key<br />
industry, and continues to grow, particularly in terms of<br />
commercial developments.<br />
29<br />
EQUITY RESEARCH<br />
ZAMBIA<br />
FEBRUARY <strong>2012</strong><br />
<strong>2011</strong> REVIEW AND <strong>2012</strong> OUTLOOK<br />
Top 5 Gainers and Losers - <strong>2011</strong> Opening Closing % Change % Change<br />
Company Price Price (LC) (USD)<br />
LuSE ALSI 3 322.47 4 040.35 21.61% 15.79%<br />
Puma Energy Zambia 321.00 1 145.00 256.70% 239.63%<br />
Zambia Bata Shoe Company 80.00 200.00 150.00% 138.03%<br />
<strong>Africa</strong>n Explosives 1 810.00 4 000.00 120.99% 110.42%<br />
Standard Chartered Bank 46.33 90.10 94.46% 85.15%<br />
Shoprite Holdings Ltd 32 000.00 60 000.00 87.50% 78.53%<br />
ZCCM 10 000.00 10 000.00 0.00% -4.79%<br />
Zambia Sugar 310.00 309.00 -0.32% -5.09%<br />
BAT (Zambia) 1 650.00 1 590.00 -3.64% -8.25%<br />
First Quantum Minerals (DRs) 4 700.00 4 400.00 -6.38% -10.86%<br />
Zambeef Products<br />
Source: LuSE<br />
3 700.00 2 901.00 -21.59% -25.35%<br />
Top 10 shares by market cap.<br />
Company ZMK (m) USD (m) % of Total<br />
Shoprite Holdings Ltd 32 608 767.60 6 363.95 65.9%<br />
Zain Zambia Plc 3 692 000.00 720.53 7.5%<br />
Standard Chartered Bank 2 213 757.00 432.04 4.5%<br />
Zambia Sugar Plc 1 956 411.16 381.81 4.0%<br />
ZANACO 1 559 250.01 304.30 3.2%<br />
Lafarge Cement Zambia 1 520 303.27 296.70 3.1%<br />
Zambian Breweries 1 365 000.00 266.39 2.8%<br />
ZCCM 892 964.28 174.27 1.8%<br />
Zambeef Products 719 384.74 140.40 1.5%<br />
Copperbelt Energy Corporation<br />
Source: LuSE<br />
700 000.00 136.61 1.4%<br />
1.5<br />
1.4<br />
1.3<br />
1.2<br />
1.1<br />
1<br />
0.9<br />
0.8<br />
0.7<br />
0.6<br />
0.5<br />
01-Jan-11<br />
31-Jan-11<br />
Source: IAS/S&P<br />
LuSE ALSI relative to S&P <strong>Africa</strong> Frontier Index<br />
02-Mar-11<br />
01-Apr-11<br />
01-May-11<br />
31-May-11<br />
30-Jun-11<br />
30-Jul-11<br />
29-Aug-11<br />
28-Sep-11<br />
LuSE ALSI S&P <strong>Africa</strong> Frontier<br />
28-Oct-11<br />
27-Nov-11<br />
27-Dec-11
Market <strong>Review</strong> for <strong>2011</strong> Despite volatility during the year, the LuSE ended as<br />
Following global uncertainty and reduced demand, copper<br />
prices declined from circa USD 9,147/tonne in December<br />
2010 to circa USD 7,568/tonne, representing a 17%<br />
decline. Copper production for the 11 months to<br />
November <strong>2011</strong> was 789m MT versus 779m MT over the 11<br />
months to November 2010 representing a minor increase<br />
of 1.3%. The Zambian Kwacha depreciated against the US<br />
Dollar by 10% from ZMK 4,640.56/USD to ZMK<br />
5,117.04/USD in <strong>2011</strong>. CPI inflation increased slower in<br />
<strong>2011</strong> with year-end CPI of 7.4% versus 7.7% y-o-y in 2010.<br />
Food inflation accounted for 1.9% of the 7.4% growth in<br />
CPI inflation, and had a weight of approximately 50%.<br />
Interest rate yields on 91-day treasury bills closed <strong>2011</strong> at<br />
7.1% versus 7.7% in 2010. Save for the 0.6% drop in 91-day<br />
t-bill rates, yields across the maturity spectrum over the<br />
year increased from the 182-day t-bill (by 1.2% to 9.53%)<br />
to the 15-year bond (by 0.7% to 16.2%). Weighted average<br />
base-lending rates by commercial banks reduced further<br />
in the year from 19.2% in January <strong>2011</strong> to 17% in<br />
December <strong>2011</strong>.<br />
The LuSE All-Share Index closed <strong>2011</strong> at 4,040.35 points<br />
versus 3,322.47 points in <strong>2011</strong>, representing a 21.61%<br />
increase y-o-y in Kwacha terms and 15.79% y-o-y in USD<br />
terms. Turnover declined by 20% to ZMK 775bn in <strong>2011</strong><br />
versus ZMK 962bn in 2010. Similar to the case with Zain in<br />
2010, a significant portion of the turnover was due to the<br />
transfer of ownership of BP Zambia shares to Puma<br />
Energy Zambia, following the acquisition of BP <strong>Africa</strong> by<br />
Puma Energy Holdings Limited. Trades in Puma accounted<br />
for 57% of turnover on the LuSE, whilst trades in Zambeef<br />
accounted for 20%, which included capital raised from its<br />
rights offer during the year. Domestic activity accounted<br />
for 81% and 74% of total turnover and volumes traded<br />
respectively, with the balance accounted for by foreign<br />
investment. The LuSE recorded a net inflow of USD 13.5m<br />
in Foreign Portfolio Investment (FPI), an improvement<br />
from the USD 10m outflow in 2010 (excluding the Celtel<br />
transaction).<br />
The LuSE saw its fair share of corporate actions with<br />
Investrust Bank, Zambeef and Zambian Breweries looking<br />
to the capital markets to raise ZMK 31.6bn (USD 6m), USD<br />
55m, and ZMK 351bn (USD 60m) respectively via rights<br />
offers, all for the purposes of expansion. During the year,<br />
First Quantum Minerals, listed on the Toronto <strong>Stock</strong><br />
Exchange, sought to place USD 50m in “Zambian”<br />
Depository Receipts (ZDRs), the first ZDRs on the<br />
exchange, at least indicating some headway towards<br />
getting domestic mining companies listed given the<br />
industry’s core positioning in the Zambian economy.<br />
The market was driven by healthy price appreciation in<br />
market heavyweights, notably Standard Chartered<br />
(increased demand following bonus-issue); Zanaco,<br />
Lafarge, Bata and CEC on strong H1 <strong>2011</strong> numbers and<br />
Puma, the best performing company, on strong H1 results<br />
and mandatory offer prospects. <strong>Africa</strong>n Explosive’s rally<br />
was triggered by its second dividend payment, negating<br />
the fact that it posted weaker y-o-y H1 <strong>2011</strong> results.<br />
30<br />
the best performing SSA exchange in <strong>2011</strong>. The closing<br />
average PER and PBV on the LuSE in <strong>2011</strong> were 19.9x<br />
and 6.5x respectively, versus 11.8x and 3.9x in 2010.<br />
10 most active stocks by volume<br />
Company Vol (m) % of Total<br />
Puma Energy Zambia 380.57 33.1%<br />
Investrust Bank 284.45 24.8%<br />
Standard Chartered Bank 246.31 21.5%<br />
Zambeef 52.15 4.5%<br />
Zambia Sugar 47.98 4.2%<br />
Cavmont Capital Holdings 44.64 3.9%<br />
ZANACO 34.55 3.0%<br />
Copperbelt Energy Corporation 33.19 2.9%<br />
Bata Shoe 5.05 0.4%<br />
Investrust Bank Rights<br />
Source: LuSE<br />
3.82 0.3%<br />
10 most active stocks by value<br />
Company Val (USD) % of Total<br />
Puma Energy Zambia 92 480 013 57.1%<br />
Zambeef 33 141 244 20.5%<br />
ZANACO 8 235 353 5.1%<br />
Standard Chartered Bank 5 830 393 3.6%<br />
Shoprite 4 776 834 3.0%<br />
Copperbelt Energy Corporation 4 685 503 2.9%<br />
Zambia Sugar 2 648 037 1.6%<br />
Farmers House 1 749 984 1.1%<br />
Lafarge Cement 1 537 405 1.0%<br />
Zambian Breweries<br />
Source: LuSE<br />
1 500 782 0.9%<br />
7.48%<br />
66.71%<br />
Market Cap. Composition<br />
5.42%<br />
7.76%<br />
1.42%<br />
0.13%<br />
2.22%<br />
7.44%<br />
1.16%<br />
0.27%<br />
Agri-business<br />
Banking<br />
Energy<br />
Hospitality<br />
Investments<br />
Manufacturing<br />
Oil Marketing<br />
Property<br />
Retail Trading<br />
Telecommunications
Market Outlook for <strong>2012</strong><br />
The outlook for Zambia in <strong>2012</strong> is arguably more sensitive<br />
to government policy than it has been over the last few<br />
years. The primary reason for this, particularly with<br />
respect to FPI on the LuSE, is that how external investors<br />
perceive government policy, which tends to rank high up<br />
in the list of significant country-risk factors for <strong>Africa</strong>n<br />
countries in particular, will impact on FPI.<br />
With the campaign promise of making significant and<br />
progressive changes to the benefit of Zambians within 90days,<br />
the Patriotic Front has since made quite a few<br />
changes, notably including:<br />
� Commissions of enquiry into recent government<br />
transactions including the aforementioned<br />
Finance Bank, as well as Zamtel<br />
� Doubling the mineral royalties tax<br />
� An increase in tax exempt income from ZMK 1m<br />
per month to ZMK 2m per mth<br />
� Increasing in maximum PAYE threshold from ZMK<br />
4.2m/mth to ZMK 5.7m/mth<br />
� And more recently<br />
� Introduction of a tiered minimum capital<br />
requirement structure<br />
� Increase in the minimum capital requirement<br />
from ZMK 12bn to ZMK 104bn for “local” banks<br />
and ZMK 520bn for “foreign” banks<br />
On the back of these developments, and the expected<br />
volatility on the world market, we expect volatility on<br />
the LuSE to continue through Q1 of <strong>2012</strong> and into Q2.<br />
Nonetheless, we expect the following to be key growth<br />
factors:<br />
� Mining – barring a further decline in commodity<br />
prices through <strong>2012</strong>, we expect increased mining<br />
activity overall, and higher royalties revenues to<br />
contribute more to GDP<br />
� Agriculture – remains government priority,<br />
continues to attract local/foreign investment<br />
� Construction –commercial property development,<br />
and the construction of power stations<br />
� Export companies – further dollar strength will<br />
aid export oriented companies, particularly<br />
those exporting primarily to SSA and Asia<br />
The primary risk factors in <strong>2012</strong> will be any significant<br />
changes in government policy; downward pressure on<br />
copper prices and the resultant lower or flat copper<br />
production on a per-mine basis; exchange rate volatility;<br />
and weak external demand for Zambian exports despite a<br />
weak Kwacha. All in all though we expect the<br />
expansionary budget to be market positive, with the<br />
retail sector in particular set to benefit.<br />
In terms of corporate actions, Farmers House received<br />
shareholder approval on 27 January <strong>2012</strong> to complete its<br />
acquisition of Arcades for circa USD 25m, whilst Puma<br />
Energy Zambia will be looking to make a mandatory offer<br />
to minorities. It remains to be seen whether the much<br />
awaited and often delayed listing of Vedanta’s Zambian<br />
operation KCM on the LSE and LuSE will occur in <strong>2012</strong>.<br />
31<br />
Top Picks for <strong>2012</strong><br />
Despite the uncertainty shrouding <strong>2012</strong>, we still think<br />
there is value on the LuSE, especially on a medium-term<br />
basis, despite the higher relative valuations at the end of<br />
<strong>2011</strong> compared with 2010. For <strong>2012</strong>, we like:<br />
� Zambia Sugar – bet on better net profit margins<br />
following debt restructuring and reversion to<br />
historical payout levels of circa 70% in the<br />
medium-term.<br />
� Lafarge Cement Zambia – remains dominant<br />
industry player, with Dangote construction still<br />
awaiting. Bet on higher cash payout coupled with<br />
modest volume growth owing to regional growth.<br />
� Zambian Breweries – new expansion project on<br />
the Copperbelt is a worthwhile long-term bet –<br />
no dividends foreseen in the near future though.<br />
� National Breweries – on higher demand from<br />
higher disposable income from the poorest owing<br />
to budget relaxation on lowest income tax<br />
bracket.<br />
� British American Tobacco – higher domestic<br />
demand + higher divi-payouts.<br />
Also, look out for the following companies:<br />
� AEL Zambia – more demand versus erratic<br />
margins.<br />
� Copperbelt Energy Corporation – Zambia or<br />
Nigeria?<br />
� Zambeef – ramifications of colossal tax<br />
assessment.<br />
� Certainly all the banks! – who will survive?
The unstable geopolitical environment in the Middle East and<br />
North <strong>Africa</strong> led to increased risk aversion and together with the<br />
Eurozone debt crisis led to a reduction in the total funds being<br />
availed for investments in perceived “riskier” emerging markets.<br />
Interestingly however, foreigners were net buyers on the ZSE in<br />
<strong>2011</strong> and accounted for 71% of average daily turnover. Constraints<br />
within the country including the scarce liquidity and unclear<br />
policies around economic empowerment and indigenisation,<br />
however, limited the growth of the indices as the Industrial index<br />
eased 3.58% while the Mining Index slumped 49.8%. Consequently,<br />
the market retreated although on thin volumes in normal trade as<br />
daily average value traded amounted to approximately USD 1.9m,<br />
representing an average market turnover of a mere 0.04%.<br />
Although the prices of most heavyweight counters remained fairly<br />
steady, AICO, which went up a marginal 5.6%, Econet down 16.1%,<br />
Barclays down 53% and Meikles down 64%, disappointed. Most of<br />
the smaller cap counters, however, recorded stronger returns and<br />
topped the movers. The bottom laggards for <strong>2011</strong> were generally<br />
characterised by massive undercapitalisation, unsustainable<br />
gearing levels and poor management and boards of directors.<br />
Generally, investor sentiment remains low as uncertainty about<br />
the macroeconomic aspects remains. The downward spiral on the<br />
Zimbabwean <strong>Stock</strong> Exchange has been mirroring international<br />
markets, as the lack of progress in dealing with sovereign debt<br />
issues especially in Europe has reduced investor confidence in<br />
emerging and frontier market equities.<br />
Bank asset quality a major concern<br />
The use of multiple currencies in the economy is still in play with<br />
the United States dollar, South <strong>Africa</strong>n Rand, and Botswana Pula<br />
being the dominant currencies. Although there has been talk of<br />
bringing back the ZWD, relevant authorities have confirmed that<br />
the multi-currency system will remain in use for the foreseeable<br />
future. As at 30 November <strong>2011</strong>, consolidated deposits (net of<br />
interbank deposits) were estimated at USD 3.2bn up 41.7% from<br />
30 November 2010. Lending to the private sector grew by 84.3% to<br />
USD 2.9bn in November <strong>2011</strong>. As a result of the growth in the<br />
deposit base and expanded credit, the loan to deposit ratio<br />
(excluding offshore lines of credit) increased from 61.9% in<br />
December 2010 to over 71.7% by end of December <strong>2011</strong>. We<br />
premise that the overall under-capitalisation of most banks<br />
remains a challenge especially when non-performing loans are<br />
taken into account. In our view, most of the lending decisions have<br />
been based on the size of the collateral being offered and<br />
relationships rather than cashflow. Good information is also scarce<br />
in the absence of a national credit bureau. Furthermore, the value<br />
of the collateral, which is real estate in most cases, tends to be<br />
overstated and inevitably harder to realise if the need arise. This<br />
has allowed the official NPLs numbers to be low. In our view, most<br />
banks are sitting on a significant unknown quantity of NPLs and<br />
these continue to grow.<br />
32<br />
Top 10 Gainers and Losers - <strong>2011</strong> Opening Closing % Change<br />
Company Price Price USD<br />
ZSE Industrial Index 151.27 145.86 -3.58%<br />
Fidelity 2.00 16.00 700.00%<br />
Pelhams 0.15 0.85 466.67%<br />
TN Holdings 0.77 3.99 418.18%<br />
CAFCA 17.00 67.00 294.12%<br />
Truworths 3.40 9.50 179.41%<br />
Bindura 13.00 2.50 -80.77%<br />
Rio Zim 190.00 35.00 -81.58%<br />
Star <strong>Africa</strong> 7.00 1.00 -85.71%<br />
Chemco 45.00 3.00 -93.33%<br />
ZECO<br />
Source: ZSE/IES<br />
Top 10 shares by market cap.<br />
0.15 0.01 -93.33%<br />
Company LC (m) USD (m) % of total<br />
Delta 829.4 829.4 20.82%<br />
Econet 677.7 677.7 17.01%<br />
Innscor 295.2 295.2 7.41%<br />
Hippo 222.0 222.0 5.57%<br />
SeedCo 212.3 212.3 5.33%<br />
OK Zimbabwe 102.1 102.1 2.56%<br />
AICO 101.0 101.0 2.54%<br />
CBZH 95.8 95.8 2.40%<br />
Barclays 90.4 90.4 2.27%<br />
Old Mutual 87.9 87.9 2.21%<br />
Source: ZSE/IES<br />
1.20<br />
1.10<br />
1.00<br />
0.90<br />
0.80<br />
0.70<br />
0.60<br />
03-Jan-11<br />
02-Feb-11<br />
04-Mar-11<br />
03-Apr-11<br />
03-May-11<br />
02-Jun-11<br />
02-Jul-11<br />
EQUITY RESEARCH<br />
ZSE Ind. relative to S&P <strong>Africa</strong> Frontier Index<br />
Source: IES/S&P ZSE Industrial S&P <strong>Africa</strong>n Frontier Index<br />
01-Aug-11<br />
31-Aug-11<br />
30-Sep-11<br />
ZIMBABWE<br />
FEBRUARY <strong>2012</strong><br />
<strong>2011</strong> REVIEW & <strong>2012</strong> OUTLOOK<br />
30-Oct-11<br />
29-Nov-11<br />
29-Dec-11
Market Outlook for <strong>2012</strong><br />
Cash budgeting has been maintained<br />
According to the <strong>2012</strong> MoF budget, revenue is estimated at<br />
USD 4.0bn with tax and non-tax revenue of USD 3.4bn and<br />
diamond revenue estimated at USD 600.0m. The Minister<br />
maintained the cash budgeting framework with recurrent<br />
expenditure projected at USD 3.2bn (80% of budget). Vote<br />
of credit is estimated at USD 500.0m. The diamond receipts<br />
are budgeted to go towards selected infrastructure and<br />
other expenditures.<br />
Economy is expected to remain on a growth path<br />
GDP has been on the rise, growing by 5.7% in 2009, 8.1% in<br />
2010 to an estimated 9.3% in <strong>2011</strong> and is projected to grow<br />
by 9.4% in <strong>2012</strong>. Major propellers of economic growth have<br />
been the mining and agricultural sectors. The Ministry of<br />
Finance (MoF) estimates that the mining sector (projected<br />
to grow by 15.9%) will remain the major driving force of the<br />
economy. The sector is expected to benefit from firm<br />
international commodity prices, strategies to lower<br />
electricity supply interruptions and additional private<br />
capital injections.<br />
Nonetheless, the IMF has highlighted the following as<br />
possible downside risks:<br />
� Political disturbances<br />
� Export price declines<br />
� Higher-than-anticipated increases in imported food<br />
and fuel prices<br />
� Unfavourable weather<br />
� Reversals of capital inflows<br />
� Banking system instability.<br />
“Early” election unlikely in <strong>2012</strong><br />
Although there are divergent statements relating to the<br />
possibility of elections in <strong>2012</strong> from the main political<br />
parties, we believe it is unlikely that elections will<br />
materialise in <strong>2012</strong> although the electioneering will be<br />
heightened. However holding early elections might be<br />
impossible due to certain prerequisites that first have to be<br />
fulfilled including political, media and electoral reforms.<br />
Furthermore, the term of the current legislature expires in<br />
2013 after its five year term runs out and cutting short its<br />
term might see increased financial liabilities for the<br />
government and increased intra-party in-fighting.<br />
While the crystal ball is difficult to read at this juncture<br />
given the uncertainties, we believe that ZSE valuations are<br />
generally attractive. In our view, the ZSE still carries good<br />
long-term growth potential given the economy’s strong<br />
growth prospects, albeit off a low base. Nonetheless, the<br />
economy remains hugely undercapitalised with most<br />
companies still saddled with heavy and expensive<br />
borrowings. Volatility is likely to stay high until the local<br />
uncertainties clear and the Eurozone and US financial crisis<br />
stabilise.<br />
33<br />
10 most active stocks by volume<br />
Company Vol (m) % of Total<br />
Pelhams 587.55 12.71%<br />
RTG 333.07 7.20%<br />
Dawn Properties 252.23 5.45%<br />
Pearl Properties 239.73 5.18%<br />
Steelnet 226.67 4.90%<br />
<strong>Africa</strong>n Sun 187.87 4.06%<br />
NMB 169.82 3.67%<br />
Celsys 144.03 3.11%<br />
ART ZDR 139.88 3.03%<br />
MASH 139.19 3.01%<br />
Source: ZSE/ IES<br />
10 most active stocks by value<br />
Company Val (USD m) % of Total<br />
Econet 104.66 22.38%<br />
Delta 77.62 16.60%<br />
Innscor 25.21 5.39%<br />
ABC 23.11 4.94%<br />
AICO 22.45 4.80%<br />
Meikles 19.35 4.14%<br />
SeedCo 18.68 3.99%<br />
Dairibord 15.55 3.32%<br />
CBZH 12.43 2.66%<br />
Hippo 11.59 2.48%<br />
Source: ZSE/ IES<br />
3.35% 2.90%<br />
3.47%<br />
4.37%<br />
4.80%<br />
4.98%<br />
9.34%<br />
Source: ZSE/ IES<br />
2.19%<br />
14.81%<br />
Market Cap.Composition<br />
0.93% 1.39%<br />
30.23%<br />
17.24%<br />
Beverages, Hotels and<br />
Leisure<br />
Technology<br />
Agricultural<br />
Financial<br />
Food<br />
Building and Allied<br />
Retail stores
Top Picks for <strong>2012</strong><br />
The ZSE is well-poised for upside, longer-term<br />
Market capitalisation to GDP is 39% against a regional<br />
average of 51%. We believe that the ZSE offers<br />
significant upside potential, off a low base for those who<br />
do not leave their entry too late. The prospects of<br />
continued good earnings growth will provide further<br />
upside potential from current levels.<br />
Given the demand for infrastructure reconstruction we<br />
believe that construction companies are well poised to<br />
take advantage of the opportunities and counters likely to<br />
benefit include Lafarge, M&R and Turnall.<br />
Although disposable incomes will remain low, we expect a<br />
gradual improvement enhanced by the recovery in<br />
agriculture and mining sectors. However, it should be<br />
noted that the country’s agricultural production remains<br />
susceptible to the vagaries of the weather as no<br />
meaningful investment has been made in irrigation post<br />
the land reform exercise. Consumer stocks and agro<br />
processors should thus continue to perform well<br />
especially the likes of Colcom, Delta, Econet, Innscor,<br />
National Foods and OK Zimbabwe.<br />
34<br />
In our view, the financial sector provides speculative<br />
opportunities as we are wary about the growth of NPLs, the<br />
general under provisioning by most banks and weak<br />
capitalisation levels. Our picks in the financials would be<br />
Barclays for long-term while CBZH and NMBZ Holdings offer<br />
speculative opportunities.<br />
For our top picks, we are not sector specific and recommend<br />
investors adopt a bottom up strategy. There are attractive<br />
opportunities to buy rapidly growing, monopolistic, well<br />
managed companies and strong cash generating companies<br />
such as AICO, BATZ, Dairibord, Delta, Econet, Innscor,<br />
M&R, OK Zimbabwe, Padenga and Seed Co.
<strong>Imara</strong> <strong>Africa</strong><br />
Securities<br />
Ground Floor<br />
Plot 64511<br />
Showgrounds<br />
Gaborone<br />
Botswana<br />
Tel: +267<br />
3188660<br />
Fax: +267<br />
3188113<br />
<strong>Imara</strong><br />
Securities<br />
Angola SCVM<br />
Limitada<br />
Rua Rainha<br />
Ginga 74, 13 th<br />
Floor,<br />
Luanda<br />
Angola<br />
Tel: +244 222<br />
372 029/36<br />
Fax: +244 222<br />
332 340<br />
Capital Securities<br />
Ground Floor<br />
Plot 64511<br />
Showgrounds<br />
Gaborone<br />
Botswana<br />
Tel: +267 3188886<br />
Fax +267 3188887<br />
Members of the<br />
Botswana <strong>Stock</strong><br />
Exchange<br />
<strong>Imara</strong> Edwards<br />
Securities (Pvt.) Ltd.<br />
Tendeseka Office Park<br />
1 st Floor Block 2<br />
Samora Machel Avenue<br />
Harare<br />
Zimbabwe<br />
Tel: +263 4 790590<br />
Fax: +263 4 791435<br />
4 Fanum House<br />
Cnr. Leopold<br />
Takawira/Josiah<br />
Tongogara Street<br />
Bulawayo<br />
Zimbabwe<br />
Tel: +263 9 74554<br />
Fax: +263 9 66024<br />
Members of the<br />
Zimbabwe <strong>Stock</strong><br />
Exchange<br />
<strong>Imara</strong> S.P. Reid<br />
(Pty) Ltd<br />
<strong>Imara</strong> House<br />
257 Oxford Road<br />
Illovo 2146<br />
P.O. Box 969<br />
Johannesburg 2000<br />
South <strong>Africa</strong><br />
Tel: +27 11 550<br />
6200<br />
Fax: +27 11 550<br />
6295<br />
Members of the<br />
JSE Limited<br />
<strong>Stock</strong>brokers<br />
Malawi Ltd<br />
Able House<br />
Cnr. Hanover<br />
Avenue/<br />
Chilembwe Road<br />
Blantyre<br />
Malawi<br />
Tel: +265<br />
1822803<br />
Members of the<br />
Malawi <strong>Stock</strong><br />
Exchange<br />
Namibia Equity<br />
Brokers (Pty)<br />
Ltd<br />
1st Floor City<br />
Centre<br />
Building, West<br />
Wing<br />
Levinson Arcade<br />
Windhoek<br />
Namibia<br />
Tel: +264 61<br />
246666<br />
Fax: +264<br />
61256789<br />
Members of the<br />
Namibia <strong>Stock</strong><br />
Exchange<br />
<strong>Stock</strong>brokers<br />
Zambia Ltd<br />
2nd Floor,<br />
Design<br />
House<br />
P O Box 38956<br />
Lusaka<br />
Zambia<br />
Tel: +260<br />
1227303<br />
Fax:<br />
+2601221055<br />
Members of<br />
the Lusaka<br />
<strong>Stock</strong><br />
Exchange<br />
This research report is not an offer to sell or the solicitation of an offer to buy or subscribe for any securities. The securities referred to in this report may not be eligible for sale in some jurisdictions. The<br />
information contained in this report has been compiled by <strong>Imara</strong> S.P. Reid (Pty) Ltd, (“<strong>Imara</strong>”) from sources that it believes to be reliable, but no representation or warranty is made or guarantee given by<br />
<strong>Imara</strong> or any other person as to its accuracy or completeness. All opinions and estimates expressed in this report are (unless otherwise indicated) entirely those of <strong>Imara</strong> as of the date of this report only<br />
and are subject to change without notice. Neither <strong>Imara</strong> nor any other member of the <strong>Imara</strong> group of companies including their respective associated companies (together “Group Companies”), nor any<br />
other person, accepts any liability whatsoever for any loss howsoever arising from any use of this report or its contents or otherwise arising in connection therewith. Each recipient of this report shall be<br />
solely responsible for making its own independent investigation of the business, financial condition and prospects of companies referred to in this report. Group Companies and their respective affiliates,<br />
officers, directors and employees, including persons involved in the preparation or issuance of this report may, from time to time (i) have positions in, and buy or sell, the securities of companies referred<br />
to in this report (or in related investments); (ii) have a consulting, investment banking or broking relationship with a company referred to in this report; and (iii) to the extent permitted under applicable<br />
law, have acted upon or used the information contained or referred to in this report including effecting transactions for their own account in an investment (or related investment) in respect of any<br />
company referred to in this report, prior to or immediately following its publication. This report may not have been distributed to all recipients at the same time. This report is issued only for the<br />
information of and may only be distributed to professional investors (or, in the case of the United States, major US institutional investors as defined in Rule 15a-6 of the US Securities Exchange Act of 1934)<br />
and dealers in securities and must not be copied, published or reproduced or redistributed (in whole or in part) by any recipient for any purpose. © <strong>Imara</strong> S.P. Reid (Pty) Ltd.<br />
35