Facts and Figures 2011 - Sarawak State Planning Unit
Facts and Figures 2011 - Sarawak State Planning Unit
Facts and Figures 2011 - Sarawak State Planning Unit
You also want an ePaper? Increase the reach of your titles
YUMPU automatically turns print PDFs into web optimized ePapers that Google loves.
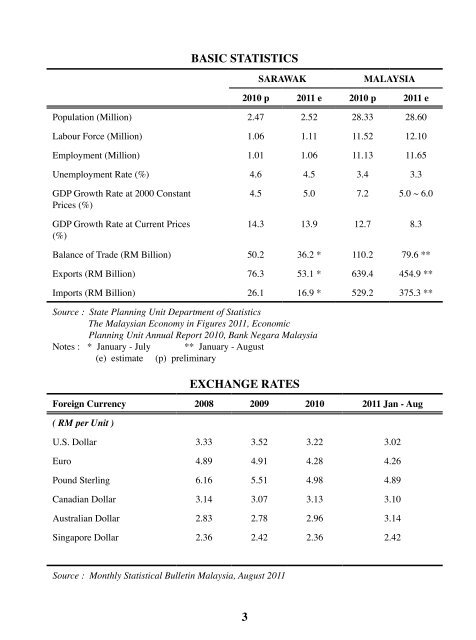
BASIC STATISTICS<br />
3<br />
SARAWAK MALAYSIA<br />
2010 p <strong>2011</strong> e 2010 p <strong>2011</strong> e<br />
Population (Million) 2.47 2.52 28.33 28.60<br />
Labour Force (Million) 1.06 1.11 11.52 12.10<br />
Employment (Million) 1.01 1.06 11.13 11.65<br />
Unemployment Rate (%) 4.6 4.5 3.4 3.3<br />
GDP Growth Rate at 2000 Constant<br />
Prices (%)<br />
GDP Growth Rate at Current Prices<br />
(%)<br />
4.5 5.0 7.2 5.0 ~ 6.0<br />
14.3 13.9 12.7 8.3<br />
Balance of Trade (RM Billion) 50.2 36.2 * 110.2 79.6 **<br />
Exports (RM Billion) 76.3 53.1 * 639.4 454.9 **<br />
Imports (RM Billion) 26.1 16.9 * 529.2 375.3 **<br />
Source : <strong>State</strong> <strong>Planning</strong> <strong>Unit</strong> Department of Statistics<br />
The Malaysian Economy in <strong>Figures</strong> <strong>2011</strong>, Economic<br />
<strong>Planning</strong> <strong>Unit</strong> Annual Report 2010, Bank Negara Malaysia<br />
Notes : * January - July ** January - August<br />
(e) estimate (p) preliminary<br />
EXCHANGE RATES<br />
Foreign Currency 2008 2009 2010 <strong>2011</strong> Jan - Aug<br />
( RM per <strong>Unit</strong> )<br />
U.S. Dollar 3.33 3.52 3.22 3.02<br />
Euro 4.89 4.91 4.28 4.26<br />
Pound Sterling 6.16 5.51 4.98 4.89<br />
Canadian Dollar 3.14 3.07 3.13 3.10<br />
Australian Dollar 2.83 2.78 2.96 3.14<br />
Singapore Dollar 2.36 2.42 2.36 2.42<br />
Source : Monthly Statistical Bulletin Malaysia, August <strong>2011</strong>


