

Facts and Figures 2011 - Sarawak State Planning Unit
Facts and Figures 2011 - Sarawak State Planning Unit
Facts and Figures 2011 - Sarawak State Planning Unit

You also want an ePaper? Increase the reach of your titles
YUMPU automatically turns print PDFs into web optimized ePapers that Google loves.
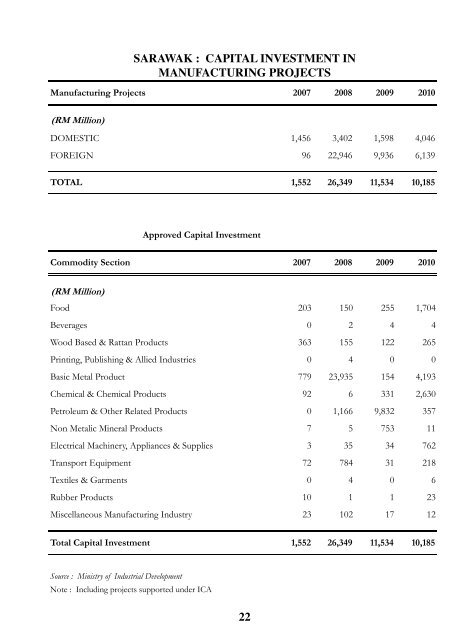
SARAWAK : CAPITAL INVESTMENT IN<br />
MANUFACTURING PROJECTS<br />
Manufacturing Projects 2007 2008 2009 2010<br />
(RM Million)<br />
DOMESTIC 1,456 3,402 1,598 4,046<br />
FOREIGN 96 22,946 9,936 6,139<br />
TOTAL 1,552 26,349 11,534 10,185<br />
Commodity Section 2007 2008 2009 2010<br />
(RM Million)<br />
Food 203 150 255 1,704<br />
Beverages 0 2 4 4<br />
Wood Based & Rattan Products 363 155 122 265<br />
Printing, Publishing & Allied Industries 0 4 0 0<br />
Basic Metal Product 779 23,935 154 4,193<br />
Chemical & Chemical Products 92 6 331 2,630<br />
Petroleum & Other Related Products 0 1,166 9,832 357<br />
Non Metalic Mineral Products 7 5 753 11<br />
Electrical Machinery, Appliances & Supplies 3 35 34 762<br />
Transport Equipment 72 784 31 218<br />
Textiles & Garments 0 4 0 6<br />
Rubber Products 10 1 1 23<br />
Miscellaneous Manufacturing Industry 23 102 17 12<br />
Total Capital Investment 1,552 26,349 11,534 10,185<br />
Source : Ministry of Industrial Development<br />
Approved Capital Investment<br />
Note : Including projects supported under ICA<br />
22