THE MARKET FOR ALLSPICE - Fintrac Inc.
THE MARKET FOR ALLSPICE - Fintrac Inc.
THE MARKET FOR ALLSPICE - Fintrac Inc.

You also want an ePaper? Increase the reach of your titles
YUMPU automatically turns print PDFs into web optimized ePapers that Google loves.
<strong>THE</strong> <strong>MARKET</strong> <strong>FOR</strong> <strong>ALLSPICE</strong><br />
Produced by the USAID ACCESO Project<br />
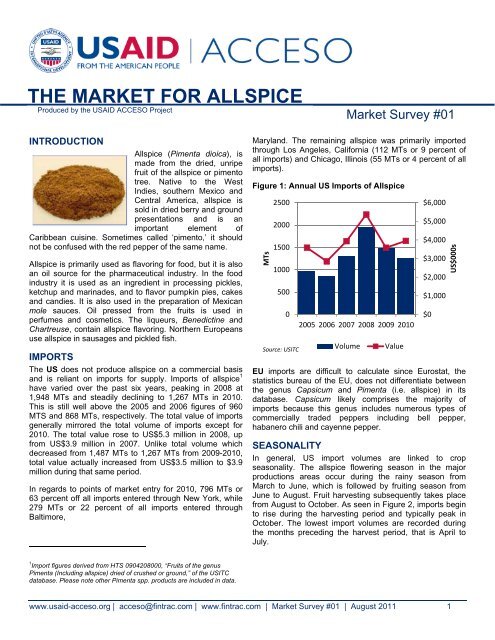
INTRODUCTION<br />
Allspice (Pimenta dioica), is<br />
made from the dried, unripe<br />
fruit of the allspice or pimento<br />
tree. Native to the West<br />
Indies, southern Mexico and<br />
Central America, allspice is<br />
sold in dried berry and ground<br />
presentations and is an<br />
important element of<br />
Caribbean cuisine. Sometimes called ‘pimento,’ it should<br />
not be confused with the red pepper of the same name.<br />
Allspice is primarily used as flavoring for food, but it is also<br />
an oil source for the pharmaceutical industry. In the food<br />
industry it is used as an ingredient in processing pickles,<br />
ketchup and marinades, and to flavor pumpkin pies, cakes<br />
and candies. It is also used in the preparation of Mexican<br />
mole sauces. Oil pressed from the fruits is used in<br />
perfumes and cosmetics. The liqueurs, Benedictine and<br />
Chartreuse, contain allspice flavoring. Northern Europeans<br />
use allspice in sausages and pickled fish.<br />
IMPORTS<br />
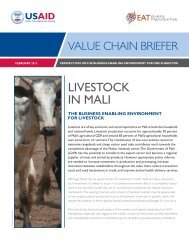
The US does not produce allspice on a commercial basis<br />
and is reliant on imports for supply. Imports of allspice 1<br />
have varied over the past six years, peaking in 2008 at<br />
1,948 MTs and steadily declining to 1,267 MTs in 2010.<br />
This is still well above the 2005 and 2006 figures of 960<br />
MTS and 868 MTs, respectively. The total value of imports<br />
generally mirrored the total volume of imports except for<br />
2010. The total value rose to US$5.3 million in 2008, up<br />
from US$3.9 million in 2007. Unlike total volume which<br />
decreased from 1,487 MTs to 1,267 MTs from 2009-2010,<br />
total value actually increased from US$3.5 million to $3.9<br />
million during that same period.<br />
In regards to points of market entry for 2010, 796 MTs or<br />
63 percent off all imports entered through New York, while<br />
279 MTs or 22 percent of all imports entered through<br />
Baltimore,<br />
1 Import figures derived from HTS 0904208000, “Fruits of the genus<br />
Pimenta (<strong>Inc</strong>luding allspice) dried of crushed or ground,” of the USITC<br />
database. Please note other Pimenta spp. products are included in data.<br />
Maryland. The remaining allspice was primarily imported<br />
through Los Angeles, California (112 MTs or 9 percent of<br />
all imports) and Chicago, Illinois (55 MTs or 4 percent of all<br />
imports).<br />
Figure 1: Annual US Imports of Allspice<br />
$6,000<br />
$5,000<br />
$4,000<br />
$3,000<br />
$2,000<br />
$1,000<br />
EU imports are difficult to calculate since Eurostat, the<br />
statistics bureau of the EU, does not differentiate between<br />
the genus Capsicum and Pimenta (i.e. allspice) in its<br />
database. Capsicum likely comprises the majority of<br />
imports because this genus includes numerous types of<br />
commercially traded peppers including bell pepper,<br />
habanero chili and cayenne pepper.<br />
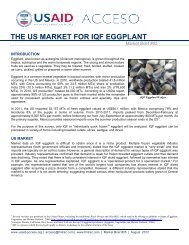
SEASONALITY<br />
In general, US import volumes are linked to crop<br />
seasonality. The allspice flowering season in the major<br />
productions areas occur during the rainy season from<br />
March to June, which is followed by fruiting season from<br />
June to August. Fruit harvesting subsequently takes place<br />
from August to October. As seen in Figure 2, imports begin<br />
to rise during the harvesting period and typically peak in<br />
October. The lowest import volumes are recorded during<br />
the months preceding the harvest period, that is April to<br />
July.<br />
www.usaid-acceso.org | acceso@fintrac.com | www.fintrac.com | Market Survey #01 | August 2011 1<br />
MTs<br />
2500<br />
2000<br />
1500<br />
1000<br />
500<br />
0<br />
Source: USITC<br />
Market Survey #01<br />
2005 2006 2007 2008 2009 2010<br />
Volume Value<br />
$0<br />
US$000s
Figure 2: Monthly US Imports of Allspice<br />
MTs<br />
500<br />
450<br />
400<br />
350<br />
300<br />
250<br />
200<br />
150<br />
100<br />
50<br />
0<br />
Source: USITC<br />
Jan Feb Mar April May June July Aug Sept Oct Nov Dec<br />
2008 2009 2010<br />
SUPPLIERS<br />
The US primarily imports from Mexico, Guatemala,<br />
Honduras and Jamaica.<br />
Mexico is the world’s largest exporter of allspice. It<br />
dominated the US import market in 2005 with 381 MTs of<br />
exports valued at US$1.04 million. By 2010, its share<br />
decreased 8 percent by volume, with exports of 408 MTs<br />
valued at US$1.26 million. Mexico’s comparative<br />
advantages are its proximity to the US, low values and high<br />
production volumes.<br />
In regards to major Mexican-based exporters,<br />
AGROBUSINESS SA de CV, exports approximately 10<br />
percent (400 to 500 MTs) of the nation’s allspice crop per<br />
year. According to a company representative, its primary<br />
market is Peru. Its product is shipped in 50-kg bulk<br />
packages.<br />
Jamaica, where it is believed allspice originated, was the<br />
top global exporter of allspice in the 1990s, but has since<br />
fallen behind Mexico. In terms of crop quality, Jamaican<br />
allspice is of premium grade, which is reflected in its higher<br />
value per MT.<br />
According to Jamaica’s Ministry of Agriculture, the value of<br />
the country’s international allspice exports peaked in 2005<br />
at US$2.8 million or 11 percent of the island’s agricultural<br />
exports. Since 2005, allspice export values have ranged<br />
between US$1.4 and $2.1 million or 3 to 7 percent of all<br />
agricultural exports.<br />
Jamaica supplied 18 percent of US imports of allspice by<br />
volume in 2005, with shipments of 176 MTs valued at<br />
US$1.2 million. By 2010, its share increased 7 percent by<br />
volume, with exports of 317 MT valued at US$1.03 million.<br />
In 2009, Jamaica’s Ministry of Agriculture stated that the<br />
industry consistently earns over US$5 million annually,<br />
from berry, leaf oil, berry oil and other products involving<br />
allspice. Major allspice of Jamaican buyers allspice are<br />
Germany, Holland, France, England and United States.<br />
Guatemalan’s allspice exports to the US accounted for 25<br />
percent of imported allspice in 2005, with shipments of 236<br />
MTs valued at US$781,614. By 2010 its share had<br />
decreased 8 percent by volume, with exports of 217 MTs<br />
valued at US$738,572.<br />
For the 2011 harvest season, it was reported that the<br />
country has harvested no more than 800 MTs at a value of<br />
$4,100 USD per ton. It is expected that this small stock will<br />
be sold before the end of August 2011.<br />
Honduran allspice exports to the US accounted for 12<br />
percent of imports in 2005, with shipments of 120 MTs<br />
valued at US$412,401. By 2010 its share increased 1<br />
percent by volume, with exports of 163 MTs valued at<br />
US$461,936.<br />
Table 1: US Imports of Allspice<br />
Supplier<br />
2005<br />
MTs $000s<br />
2006<br />
MTs $000s<br />
2007<br />
MTs $000s<br />
2008<br />
MTs $000s<br />
2009<br />
MTs $000s<br />
2010<br />
MTs $000s<br />
Mexico 381 1043 424 1090 249 658 480 1412 278 711 408 1269<br />
Jamaica 176 1209 130 747 154 735 174 740 143 487 318 1036<br />
Guatemala 236 782 70 224 321 958 135 471 116 335 217 739<br />
Honduras 120 412 151 444 197 593 300 977 322 866 163 462<br />
Other 48 139 92 343 382 990 858 1761 629 1182 162 442<br />
Total 960 3584 868 2849 1304 3934 1948 5360 1487 3581 1267 3948<br />
Source: USITC<br />
www.usaid-acceso.org | acceso@fintrac.com | www.fintrac.com | Market Survey #01 | August 2011 2
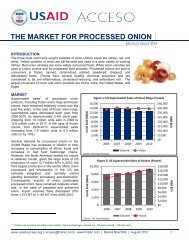
Figure 3: 2005 Market Share of US Imports of Allspice<br />
Guatemala<br />
25%<br />
Source: USITC<br />
Figure 4: 2010 Market Share of US Imports of Allspice<br />
Guatemala<br />
17%<br />
Jamaica<br />
25%<br />
Source: USITC<br />
Jamaica<br />
18%<br />
Honduras<br />
13%<br />
Honduras<br />
12%<br />
Others<br />
5%<br />
Mexico<br />
40%<br />
Others<br />
13%<br />
Mexico<br />
32%<br />
PRICES<br />
Beginning in July 2010, global prices 2 began a steady rise<br />
until peaking in April-June 2011 (see Figure 5). Jamaican<br />
prices peaked at US$8,200 per MT, while Mexican and<br />
Guatemalan/Honduran prices peaked at $4,500 and $5,700<br />
per MT, respectively. It is only as of July 2011 that prices<br />
have started to decline.<br />
Mexican prices of allspice have consistently been below<br />
Jamaican and Guatemalan/Honduran prices. In terms of<br />
the total average price per MT from 2006 to 2011, Mexico<br />
recorded US$3,186 while Jamaica recorded US$5,426 and<br />
Guatemala/Honduras recorded US$3,661. The combined<br />
average of all three prices was US$4,091 per MT. In<br />
2<br />
Prices reported in this figure refer to CIF (Cost, Insurance and Freight)<br />
prices per tonne<br />
general, Jamaican prices are typically the highest due to<br />
the premium grade quality of its allspice. Guatemalan/<br />
Honduran prices have generally hovered slightly above<br />
Mexican prices. See Table 3 in Annex for the monthly price<br />
averages from June 2010 to June 2011.<br />
As of July 2011, the remainder of Mexico’s 2010 allspice<br />
stocks is being offered at $4,600 USD (FOB). An estimated<br />
price for first shipments of the 2011 crop at the end of<br />
September is around $4,350 USD (FOB).<br />
Figure 5: Allspice Prices (CIF) US$ per MT<br />
$9,000<br />
$8,000<br />
$7,000<br />
$6,000<br />
$5,000<br />
$4,000<br />
$3,000<br />
$2,000<br />
$1,000<br />
$0<br />
Figure 6: US Market Value of Allspice Imports<br />
STANDARDS AND REQUIREMENTS<br />
Tariff and Trade. According to the US International Trade<br />
Commission, allspice is not eligible for preferential tariff<br />
programs of North American Free Trade Agreement<br />
(NAFTA) and the Caribbean Basin Initiative (CBI).<br />
However, all of the major allspice producing countries (i.e.<br />
Mexico, Jamaica, Honduras and Guatemala) qualify for the<br />
Normal Trade Relations (NTR) duty rate.<br />
www.usaid-acceso.org | acceso@fintrac.com | www.fintrac.com | Market Survey #01 | August 2011 3<br />
US$ per MT<br />
Jamaican Mexican Guatemalan & Honduran<br />
Source: The Public Ledger<br />
US$ per MT<br />
5000<br />
4000<br />
3000<br />
2000<br />
1000<br />
0<br />
Source: USITC<br />
Jan<br />
Feb<br />
Mar<br />
April<br />
May<br />
June<br />
July<br />
Aug<br />
Sept<br />
Oct<br />
2008 2009 2010<br />
Nov<br />
Dec
Grades and Standards. The American Spice Trade<br />
Association (ASTA) adopted the original Cleanliness<br />
Specifications for spices, seeds and herbs in 1969 and they<br />
have been revised numerous times, the latest occurring in<br />
2007. The ASTA Cleanliness Specifications were designed<br />
to meet or exceed the United States Food and Drug<br />
Administration (FDA) Defect Action Levels (DAL). The DAL<br />
refers to Title 21, Code of Federal Regulations, Part<br />
110.110 that allows the Food and Drug Administration<br />
(FDA) to establish maximum levels of natural or<br />
unavoidable defects in foods for human use that present no<br />
health hazard. The FDA set these action levels because it<br />
is economically impractical to grow, harvest, or process raw<br />
products that are totally free of non-hazardous, naturally<br />
occurring, unavoidable defects.<br />
Table 2: US Cleanliness Specifications for Allspice<br />
Whole<br />
insects<br />
dead<br />
Excreta<br />
Mammalian<br />
By count By mg./lb<br />
Excreta<br />
other<br />
By<br />
mg./lb<br />
Mold<br />
% by<br />
wgt.<br />
Insect<br />
defiled/<br />
infested<br />
Extraneous<br />
foreign<br />
matter<br />
% by wgt. % by wgt.<br />
2 5 5 2 1 0.5<br />
Source: American Spice Trade Association, Revised 2007<br />
Packaging. According to representatives of US spice<br />
wholesale distributers, the largest individual bulk container<br />
for allspice is 25-lb. polyethylene bags. A representative of<br />
a Mexican exporter of allspice noted that export shipments<br />
are made in 50 kilograms (approximately 110-lbs)<br />
containers.<br />
Post-Harvesting Handling. Allspice<br />
berries are generally harvested when they<br />
are fully developed, but still green in<br />
coloration. The height of the trees makes<br />
mechanizing the process difficult, so hand<br />
picking or pulling off branches is still<br />
common. The harvested fruit are piled<br />
into small heaps, approximately two feet high, and ferment<br />
for four to five days. During this period, the temperature<br />
rises due to “sweating” and microbial processes, causing<br />
the berries to turn brown. The cured berries are then dried<br />
in the sun on concrete floors for seven to ten days. During<br />
this period they are raked two to three times a time in order<br />
to prevent mold growth and quicken the drying process.<br />
The dried berries are blackish-brown in color and should<br />
rattle when shaken. Once completed, the berry can either<br />
be sold in its whole form or undergo a grounding process<br />
before sale.<br />
OUTLOOK<br />
Weather conditions in producer countries have led to<br />
insecurity about production from year to year. The major<br />
producing areas of supplier countries are often susceptible<br />
to drought and hurricane conditions. In fact, storms and<br />
hurricanes are very common in the region where allspice<br />
plantations are concentrated. Consequently, poor weather<br />
conditions can lead to lower yields, higher prices of allspice<br />
stocks and delay the harvesting period.<br />
For instance, Mexican production from 2009 to 2010<br />
increased 5,500 MTs to approximately 6,500 MTs due to<br />
favorable weather conditions. However, in 2011 only 4,000<br />
MTs was projected due to severe drought conditions and<br />
an estimated 40 percent crop loss. The 2011 drought<br />
affected all production areas and delayed the maturity of<br />
crops pushing back the harvest period to the end of July.<br />
This was expected to start after July 25, while harvesting<br />
usually occurs between July 10th and the 15th.<br />
Consequently, the first shipments are likely to occur at the<br />
end of September.<br />
Mexico has remained the industry leader in allspice<br />
exports throughout the 2000s due in part to its large<br />
production volumes, cheap price structure and proximity to<br />
the US market. Mexico will likely remain the most<br />
significant player in the market and should account for<br />
approximately 30 percent of all US allspice imports in terms<br />
of total value and total volume in any given year. This<br />
percentage is based on Mexico’s average values and<br />
volumes from 2005 to 2010.<br />
Jamaica should remain the market leader it terms of<br />
product quality and should always have a healthy share of<br />
approximately 20 percent of all US allspice imports in terms<br />
of total value and total volume barring unforeseen<br />
circumstances. This percentage is based on Jamaica’s<br />
average values and volumes from 2005 to 2010.<br />
Guatemala and Honduras shared nearly the same<br />
average market share (approximately 15 percent) of US<br />
imports in terms of value and volume over the 2005 to 2010<br />
period. Allspice grown in these countries has been<br />
characterized as of lower quality than Jamaican allspice,<br />
but slightly better than Mexican allspice. If the two countries<br />
can increase production, maintain quality and institute<br />
value addition processes, it may be possible for them to<br />
gain market share.<br />
www.usaid-acceso.org | acceso@fintrac.com | www.fintrac.com | Market Survey #01 | August 2011 4
REFERENCES<br />
Produced for the USAID-ACCESO Project<br />
1. “Pimenta dioica” Floridata; January 24, 2004 http://www.floridata.com/ref/p/pime_dio.cfm<br />
2. “Economical valuation of Allspice (Pimenta dioica) production for the<br />
restoration strategies proposed for the recovering of “Los Tuxtlas”<br />
livestock pastures (Veracruz, Mexico)” Luz Aliette Hernández-Prieto, Martin Ricker; 2009<br />
http://www.indiana.edu/~workshop/colloquia/materials/papers/Hernandez-Prieto%202008_rev.pdf<br />
3. “Export Division (Pimento)” Jamaican Ministry of Agriculture; September 8, 2009<br />
http://www.moa.gov.jm/about/agencies/export.php<br />
4. “Pimiento Allspice: Mexico reports an estimated crop failure of around 40%” Peppertrade; July 14, 2011<br />
http://www.peppertrade.com.br/vernoticia08BIG09.php?idn=2146<br />
5. “Recent storm in Guatemala didnt affected Allspice in Mexico” Peppertrade; June 4 2010<br />
http://www.peppertrade.com.br/2010vernoticiaCORP.php?idn=2<br />
6. “Mexican Allspice Pimento and Indonesian Nutmegs also on rise” Peppertrade; February 24, 2011<br />
http://www.peppertrade.com.br/vernoticia08BIG09.php?idn=1768<br />
7. “Value of Agricultural Exports, 2005-2009” Jamaican Ministry of Agriculture; July 26, 2011<br />
http://www.moa.gov.jm/data/data/files/Agricultural_Exports_2005-2009_VALUE.jpg<br />
8. “Value of Agricultural Exports, 2003-2007” Jamaican Ministry of Agriculture; July 26, 2011<br />
http://www.moa.gov.jm/data/data/files/vaule%20of%20agri%20export30-27.htm<br />
9. “Allspice” Nature Natural <strong>Inc</strong>., USA; July 28, 2011 http://organic.co.in/organic-product/organicspices/organic_allspice.asp<br />
10. “Allspice (Pimenta dioica [L.] Mer.)”; June 14, 2009 http://www.uni-graz.at/~katzer/engl/Pime_dio.html<br />
11. CABI: Crop Compendium; July 29, 2011 http://www.cabi.org/cpc/<br />
12. “A canker and wilt disease of pimento (Pimenta officinalis) caused by Ceratocystis fimbriata in Jamaica”<br />
Science Direct; July 12 1965 http://www.sciencedirect.com/science/article/pii/S0007153666800554<br />
13. “ASTA Cleanliness Specifications for Spices, Seeds and Herbs” American Spice Trade Association; 2007<br />
http://www.astaspice.org/files/members/Revised2007Version.pdf<br />
14. “Utilization of tropical foods: sugars, spices and stimulants: compendium on technological and nutritional<br />
aspects of processing and utilization of tropical foods, both animal and plant, for purposes of training and field<br />
reference” FAO; 1989<br />
15. “Defect Levels Handbook” U.S. Food and Drug Administration; July 25,2011<br />
http://www.fda.gov/food/guidancecomplianceregulatoryinformation/guidancedocuments/sanitation/ucm05617<br />
4.htm#CHPT3<br />
www.usaid-acceso.org | acceso@fintrac.com | www.fintrac.com | Market Survey #01 | August 2011 5
Buyers of Allspice<br />
Company Comments<br />
1. American Key Food Products<br />
1 Reuten Drive<br />
Closter, NJ 17624-2115<br />
Tel: (201) 767-8022<br />
Fax: (201) 767-9124<br />
Contact: Edwin Posh (ext. 106)<br />
2. Morris J. Golombeck<br />
960 Franklin Ave<br />
Brooklyn, NY 11225-2499<br />
Contact: Zeb<br />
Tel: (718) 284-3505<br />
Fax: (718) 693-1941<br />
3. Wm. E. Martin & Sons Co.,<br />
<strong>Inc</strong>orporated Spices<br />
9341 170 th Street<br />
Jamaica, NY 11433<br />
Contact: Spencer<br />
Tel: (718) 291-1300<br />
www.martinspices.com<br />
4. Badia Spices<br />
1400 NW 93 rd Ave<br />
Miami, FL 33172-2923<br />
Contact: Chuck McDuffy<br />
Tel: 850-450-5490<br />
Company Tel: (305) 629-8000<br />
Fax: (305) 629-8100<br />
Annex: Buyer’s Survey<br />
US importer and wholesaler/distributor of baking ingredients, nuts,<br />
spices and starches including native potato, tapioca, arrowroot, sage,<br />
rice and modified starches. Serving food processors and food service<br />
suppliers. According to Mr. Posh, the company has discontinued its<br />
purchases of allspice.<br />
US processor, importer, and exporter of herbs and spices, including<br />
basil, cassia, cayenne, garlic, ginger, paprika, allspice, etc. US<br />
market is neither promising nor oversupplied.<br />
The company imports from Mexico, Guatemala, Honduras and<br />
Jamaica. The country of origin depends on price and customer<br />
requirements, but they typically purchase early in the crop season<br />
(August-September) to avoid rising prices.<br />
Importer, exporter and distributor to the spice trade, bakery trade<br />
and food industry; supplies entire U.S. market and export worldwide.<br />
Deals in spices, herbs, seeds, dehydrated onion, garlic, parsley other<br />
vegetables. Do distribute whole and ground allspice. Allspice is<br />
typically procured from Mexico due to its low price, large available<br />
quantity and option for product sterilization. Price estimates for<br />
whole allspice from Mexico during the 2011 crop season (i.e. August-<br />
September) equaled $2.45 per pound. An additional $.15 per pound<br />
for sterilization treatment is available. Whole allspice from<br />
Guatemala is $.20 more per pound in comparison to Mexican allspice<br />
and sterilization is not an option. In general, allspice from Jamaica is<br />
more expensive than Guatemalan or Mexican allspice. Ground<br />
allspice is available for purchase, but only from after the crop<br />
season.<br />
US processor and exporter of herbs, spices, and seasonings.<br />
Purchases of whole or ground allspice are available from Jamaica,<br />
Honduras and Mexico.<br />
Allspice Prices<br />
Table 3: Average Allspice Prices (CIF) US$ per MT from June 2010 to July 2011<br />
Country<br />
Jun‐<br />
10<br />
Jul‐<br />
10<br />
Aug‐<br />
10<br />
Sep‐<br />
10<br />
Oct‐<br />
10<br />
Jamaican 3500 3500 3609 4291 4657 5334 6050 6618 7545 7904 8200 8200 8200<br />
Mexican 3550 3470 3264 3073 3057 3370 3800 3948 4220 4370 4500 4457 4450<br />
Guatemalan & Honduran 3600 3536 3491 3900 3924 4145 4500 4650 5030 5352 5700 5700 5700<br />
Source: The Public Ledger<br />
www.usaid-acceso.org | acceso@fintrac.com | www.fintrac.com | Market Survey #01 | August 2011 6<br />
Nov‐<br />
10<br />
Dec‐<br />
10<br />
Jan‐<br />
11<br />
Feb‐<br />
11<br />
Mar‐<br />
11<br />
Apr‐<br />
11<br />
May‐<br />
11<br />
Jun‐<br />
11