The Hertzprung-Russell (HR) Diagram Purpose • Reproduce ...
The Hertzprung-Russell (HR) Diagram Purpose • Reproduce ...
The Hertzprung-Russell (HR) Diagram Purpose • Reproduce ...

Create successful ePaper yourself
Turn your PDF publications into a flip-book with our unique Google optimized e-Paper software.
Name: __________________________<br />
Partner(s): _______________________<br />
1102 or 3311: ______<br />
Desk # ____________<br />
Date: _____________<br />
<strong>The</strong> <strong>Hertzprung</strong>-<strong>Russell</strong> (<strong>HR</strong>) <strong>Diagram</strong><br />
<strong>Purpose</strong><br />
<strong>•</strong> <strong>Reproduce</strong> Hertzsprung and <strong>Russell</strong> simultaneous discovery<br />
<strong>•</strong> Investigate the relationships between luminosity, mass, temperature and size of different<br />
categories of stars<br />
Equipment<br />
<strong>•</strong> Log-log graph paper <strong>•</strong> Ruler<br />
<strong>The</strong> Distribution of Stars<br />
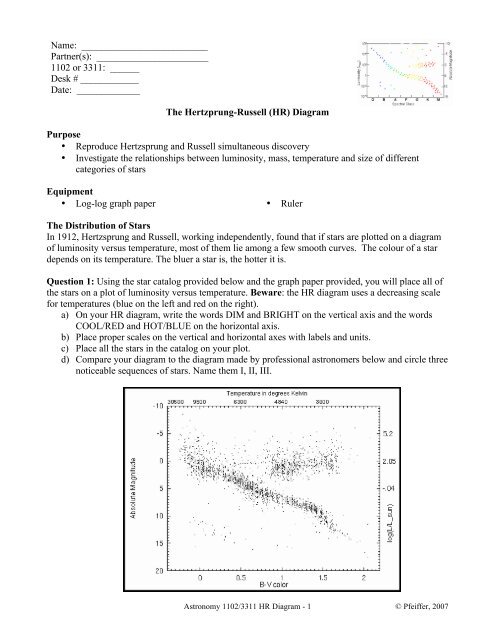
In 1912, Hertzsprung and <strong>Russell</strong>, working independently, found that if stars are plotted on a diagram<br />
of luminosity versus temperature, most of them lie among a few smooth curves. <strong>The</strong> colour of a star<br />
depends on its temperature. <strong>The</strong> bluer a star is, the hotter it is.<br />
Question 1: Using the star catalog provided below and the graph paper provided, you will place all of<br />
the stars on a plot of luminosity versus temperature. Beware: the <strong>HR</strong> diagram uses a decreasing scale<br />
for temperatures (blue on the left and red on the right).<br />
a) On your <strong>HR</strong> diagram, write the words DIM and BRIGHT on the vertical axis and the words<br />
COOL/RED and HOT/BLUE on the horizontal axis.<br />
b) Place proper scales on the vertical and horizontal axes with labels and units.<br />
c) Place all the stars in the catalog on your plot.<br />
d) Compare your diagram to the diagram made by professional astronomers below and circle three<br />
noticeable sequences of stars. Name them I, II, III.<br />
Astronomy 1102/3311 <strong>HR</strong> <strong>Diagram</strong> - 1<br />
© Pfeiffer, 2007
Star Effective<br />
temperatur<br />
e<br />
e) Compare the properties of each sequence by completing the following table<br />
Sequence Bright / dim Cool / hot Colour<br />
I<br />
II<br />
III<br />
(K)<br />
Luminosity<br />
(Sun = 1)<br />
f) Using the terms in the above table, how you characterize our Sun?<br />
g) Astronomers named the diagonal line from the top-left corner to the bottom-right corner, the<br />
main sequence. Label the main sequence on your diagram.<br />
Astronomy 1102/3311 <strong>HR</strong> <strong>Diagram</strong> - 2<br />
Star Effective Luminosity<br />
temperature (Sun = 1)<br />
(K)<br />
Sun 5,800 1.00 Altair 8,000 11.0<br />
Alpha Centauri A 5,800 1.5 Spica 21,000 2,800.0<br />
Alpha Centauri B 4,200 0.33 Delta Aquarii A 9,400 24.0<br />
Alpha Centauri C 2,800 0.0001 70 Ophiuchi A 5,100 0.6<br />
Wolf 359 2,700 0.00003 Delta Persei 17,000 1,300.0<br />
Lalande 21185 3,200 0.0055 Zeta Persei A 24,000 16,000.0<br />
Sirius A 10,400 23.0 Tau Scorpii 25,000 2,500.0<br />
Luyten 726-8 A 2,700 0.00006 Arcturus 4,500 110.0<br />
Luyten 726-8 B 2,700 0.00002 Betelgeuse 3,200 17,000.0<br />
Ross 154 2,800 0.00041 Aldebaran 4,200 100.0<br />
Ross 248 2,700 0.00011 Antares 3,400 5,000.0<br />
Epsilon Eridani 4,500 0.30 Delta Aquarii B 6,000 4,300.0<br />
Ross 128 2,800 0.00054 Sirius B 10,700 0.0024<br />
61 Cygni A 4,200 0.084 Procyon B 7,400 0.00055<br />
61 Cygni B 3,900 0.039 Grw +70 8247 9,800 0.0013<br />
Procyon A 6,500 7.3 L 879-14 6,300 0.00068<br />
Epsilon Indi 4,200 0.14 Van Maanen's Star 7,500 0.00016<br />
Vega 10,700 55.0 W 219 7,400 0.00021<br />
Achernar 14,000 200.0 Barnard's Star 2,800 0.00045<br />
Beta Centauri 21,000 5,000.0 Luyten 789-6 2,700 0.00009<br />
Fomalhaut 9,500 14.0 Canopus 7,400 1,500.0<br />
Deneb 9,900 60,000.0 Capella 5,900 170.0<br />
Beta Crucis 22,000 6,000.0 Rigel 11,800 40,000.0<br />
Qu Tel 27,000 0.9 Alpha Crucis 21,000 4,000.0<br />
© Pfeiffer, 2007
h) What portion of the stars from the catalog falls on the main sequence? Show your calculations.<br />
Question 2: Here you will investigate the relationship between the luminosity and radius of stars.<br />
a) Do you expect hotter objects to be brighter than cooler ones? Why?<br />
b) Can you find a cool star that is brighter than a hot one? Name them. Find an explanation to this<br />
apparent paradox.<br />
Betelgeuse (3200 K, 17000 LSun) is more luminous than Sirius A (10400 K, 23 LSun). Using the<br />
following equation, which of the two stars has the larger radius? Here (4 π σ) = 8.73 × 10 -16 , if<br />
R and L are in solar units and T is in Kelvin.<br />
€<br />
L = 4πσR 2 T 4<br />
c) Fill out the table below with the luminosity of stars with a given radius and temperature using<br />
the equation above.<br />
Temperature 0.01 Rsol 1 Rsol 100 Rsol<br />
3,000K<br />
30,000K<br />
Astronomy 1102/3311 <strong>HR</strong> <strong>Diagram</strong> - 3<br />
© Pfeiffer, 2007
d) On your diagram, draw a line representing the stars of radius 1 RSun, 0.01 RSun and 100 RSun.<br />
e) Estimate and draw the position of the lines of constant radius for stars with radius 0.1 RSun and<br />
10 RSun.<br />
Question 3: You will now look at the properties of different groupings of stars on your <strong>HR</strong> diagram.<br />
a) On your diagram, label the following sequences:<br />
i. White dwarfs: blue to yellow, dim small<br />
ii. Giants: red to yellow, bright, large<br />
iii. Super Giants: very large, very bright<br />
b) Complete the following table and characterize the stars with the terms from part (a).<br />
Star Size Luminosity Colour Label<br />
Aldebaran<br />
Barnard s<br />
Betelgeuse<br />
Deneb<br />
Procyon B<br />
Sirius B<br />
Spica<br />
Sun<br />
Question 4: Luminosity and mass. In 1924, Sir Eddington discovered that the luminosity of a main<br />
sequence star depends on its mass with L = M 3 , where L and M are in solar units. This relation only<br />
holds along the main sequence. For example it does not hold for white dwarfs: a more massive white<br />
dwarf is usually less luminous because its higher gravity contracts the star, reducing its surface area.<br />
a) On your <strong>HR</strong> diagram, using L = M 3 , indicate on the main sequence the position of stars with<br />
0.1 MSun, 1 MSun, 3 MSun, 6 MSun, 10 MSun and 30 MSun.<br />
b) Estimate the mass of the following stars using the mass-luminosity relationship.<br />
<strong>•</strong> Barnard’s<br />
<strong>•</strong> Betelgeuse<br />
<strong>•</strong> Procyon B<br />
<strong>•</strong> Spica<br />
<strong>•</strong> Sun<br />
<strong>•</strong> Vega<br />
Astronomy 1102/3311 <strong>HR</strong> <strong>Diagram</strong> - 4<br />
© Pfeiffer, 2007
Question 5: Stellar evolution. We can also infer information related to the evolution of stars through<br />
the <strong>HR</strong> diagram. <strong>The</strong> following diagram (Arny, 13), shows the evolutionary track of our Sun on an<br />
<strong>HR</strong> diagram.<br />
a) On your <strong>HR</strong> diagram, indicate the five main stages of evolution of the Sun and the time spent<br />
in each stage.<br />
b) Using the time information in the above diagram, calculate the portion of the Sun’s entire time<br />
as a star that it spends as a main sequence star.<br />
c) Now with the information in (b), explain why 90% of the stars observed in the sky are found on<br />
the main sequence.<br />
Astronomy 1102/3311 <strong>HR</strong> <strong>Diagram</strong> - 5<br />
© Pfeiffer, 2007
d) For each image at the following link, chose the stellar evolutionary phase that best represented<br />
(one of the five stages is not represented):<br />
http://www.langara.bc.ca/departments/physics-astronomy/pdf/EvolutionaryPictures.htm<br />
Image 1: Image 3:<br />
Image 2: Image 4:<br />
Question 6: (ASTR 1102 only) Observational bias. <strong>The</strong> faintest object you can see depends on your<br />
equipment. Since brighter stars will be observable at greater distances, it will always seem like the<br />
average brightness of stars in your sample will increase with distance. <strong>The</strong> actual effect is that you<br />
cannot detect the dimmer stars at large distances.<br />
a) Assume that the maximum apparent magnitude your photometer can measure 14. <strong>The</strong><br />
equation below relates the apparent magnitude of a star to its luminosity (in solar units) and<br />
distance (in light years).<br />
m = −2.72 − 2.5log L<br />
d 2<br />
# &<br />
% (<br />
$ '<br />
How far is the farthest blue white dwarf you can observe? <strong>The</strong> farthest Sun-like star? <strong>The</strong><br />
farthest Betelgeuse-like star? Show your calculations.<br />
€<br />
b) Can we study distant white dwarfs? Explain.<br />
Astronomy 1102/3311 <strong>HR</strong> <strong>Diagram</strong> - 6<br />
© Pfeiffer, 2007