Adapting the IUCN Red List criteria for invertebrates - Dr. José L ...
Adapting the IUCN Red List criteria for invertebrates - Dr. José L ...
Adapting the IUCN Red List criteria for invertebrates - Dr. José L ...

You also want an ePaper? Increase the reach of your titles
YUMPU automatically turns print PDFs into web optimized ePapers that Google loves.
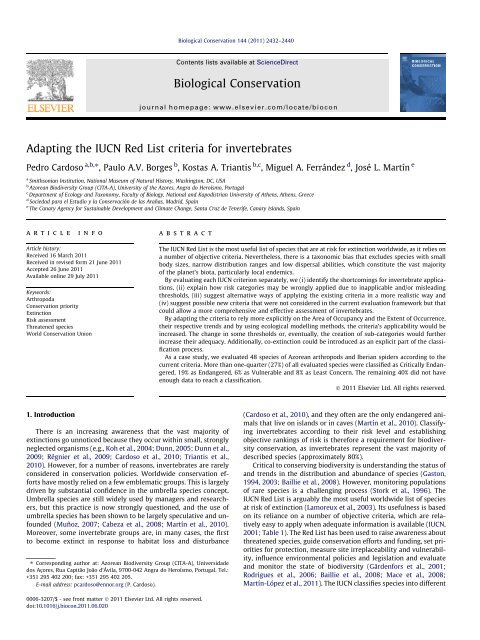
<strong>Adapting</strong> <strong>the</strong> <strong>IUCN</strong> <strong>Red</strong> <strong>List</strong> <strong>criteria</strong> <strong>for</strong> <strong>invertebrates</strong><br />
Pedro Cardoso a,b,⇑ , Paulo A.V. Borges b , Kostas A. Triantis b,c , Miguel A. Ferrández d , <strong>José</strong> L. Martín e<br />
a<br />
Smithsonian Institution, National Museum of Natural History, Washington, DC, USA<br />
b<br />
Azorean Biodiversity Group (CITA-A), University of <strong>the</strong> Azores, Angra do Heroísmo, Portugal<br />
c<br />
Department of Ecology and Taxonomy, Faculty of Biology, National and Kapodistrian University of A<strong>the</strong>ns, A<strong>the</strong>ns, Greece<br />
d<br />
Sociedad para el Estudio y la Conservación de las Arañas, Madrid, Spain<br />
e<br />
The Canary Agency <strong>for</strong> Sustainable Development and Climate Change, Santa Cruz de Tenerife, Canary Islands, Spain<br />
article info<br />
Article history:<br />
Received 16 March 2011<br />
Received in revised <strong>for</strong>m 21 June 2011<br />
Accepted 26 June 2011<br />
Available online 29 July 2011<br />
Keywords:<br />
Arthropoda<br />
Conservation priority<br />
Extinction<br />
Risk assessment<br />
Threatened species<br />
World Conservation Union<br />
1. Introduction<br />
abstract<br />
There is an increasing awareness that <strong>the</strong> vast majority of<br />
extinctions go unnoticed because <strong>the</strong>y occur within small, strongly<br />
neglected organisms (e.g., Koh et al., 2004; Dunn, 2005; Dunn et al.,<br />
2009; Régnier et al., 2009; Cardoso et al., 2010; Triantis et al.,<br />
2010). However, <strong>for</strong> a number of reasons, <strong>invertebrates</strong> are rarely<br />
considered in conservation policies. Worldwide conservation ef<strong>for</strong>ts<br />
have mostly relied on a few emblematic groups. This is largely<br />
driven by substantial confidence in <strong>the</strong> umbrella species concept.<br />
Umbrella species are still widely used by managers and researchers,<br />
but this practice is now strongly questioned, and <strong>the</strong> use of<br />
umbrella species has been shown to be largely speculative and unfounded<br />
(Muñoz, 2007; Cabeza et al., 2008; Martín et al., 2010).<br />
Moreover, some invertebrate groups are, in many cases, <strong>the</strong> first<br />
to become extinct in response to habitat loss and disturbance<br />
⇑ Corresponding author at: Azorean Biodiversity Group (CITA-A), Universidade<br />
dos Açores, Rua Capitão João d’Ávila, 9700-042 Angra do Heroísmo, Portugal. Tel.:<br />
+351 295 402 200; fax: +351 295 402 205.<br />
E-mail address: pcardoso@ennor.org (P. Cardoso).<br />
0006-3207/$ - see front matter Ó 2011 Elsevier Ltd. All rights reserved.<br />
doi:10.1016/j.biocon.2011.06.020<br />
Biological Conservation 144 (2011) 2432–2440<br />
Contents lists available at ScienceDirect<br />
Biological Conservation<br />
journal homepage: www.elsevier.com/locate/biocon<br />
The <strong>IUCN</strong> <strong>Red</strong> <strong>List</strong> is <strong>the</strong> most useful list of species that are at risk <strong>for</strong> extinction worldwide, as it relies on<br />
a number of objective <strong>criteria</strong>. Never<strong>the</strong>less, <strong>the</strong>re is a taxonomic bias that excludes species with small<br />
body sizes, narrow distribution ranges and low dispersal abilities, which constitute <strong>the</strong> vast majority<br />
of <strong>the</strong> planet’s biota, particularly local endemics.<br />
By evaluating each <strong>IUCN</strong> criterion separately, we (i) identify <strong>the</strong> shortcomings <strong>for</strong> invertebrate applications,<br />
(ii) explain how risk categories may be wrongly applied due to inapplicable and/or misleading<br />
thresholds, (iii) suggest alternative ways of applying <strong>the</strong> existing <strong>criteria</strong> in a more realistic way and<br />
(iv) suggest possible new <strong>criteria</strong> that were not considered in <strong>the</strong> current evaluation framework but that<br />
could allow a more comprehensive and effective assessment of <strong>invertebrates</strong>.<br />
By adapting <strong>the</strong> <strong>criteria</strong> to rely more explicitly on <strong>the</strong> Area of Occupancy and <strong>the</strong> Extent of Occurrence,<br />
<strong>the</strong>ir respective trends and by using ecological modelling methods, <strong>the</strong> <strong>criteria</strong>’s applicability would be<br />
increased. The change in some thresholds or, eventually, <strong>the</strong> creation of sub-categories would fur<strong>the</strong>r<br />
increase <strong>the</strong>ir adequacy. Additionally, co-extinction could be introduced as an explicit part of <strong>the</strong> classification<br />
process.<br />
As a case study, we evaluated 48 species of Azorean arthropods and Iberian spiders according to <strong>the</strong><br />
current <strong>criteria</strong>. More than one-quarter (27%) of all evaluated species were classified as Critically Endangered,<br />
19% as Endangered, 6% as Vulnerable and 8% as Least Concern. The remaining 40% did not have<br />
enough data to reach a classification.<br />
Ó 2011 Elsevier Ltd. All rights reserved.<br />
(Cardoso et al., 2010), and <strong>the</strong>y often are <strong>the</strong> only endangered animals<br />
that live on islands or in caves (Martín et al., 2010). Classifying<br />
<strong>invertebrates</strong> according to <strong>the</strong>ir risk level and establishing<br />
objective rankings of risk is <strong>the</strong>re<strong>for</strong>e a requirement <strong>for</strong> biodiversity<br />
conservation, as <strong>invertebrates</strong> represent <strong>the</strong> vast majority of<br />
described species (approximately 80%).<br />
Critical to conserving biodiversity is understanding <strong>the</strong> status of<br />
and trends in <strong>the</strong> distribution and abundance of species (Gaston,<br />
1994, 2003; Baillie et al., 2008). However, monitoring populations<br />
of rare species is a challenging process (Stork et al., 1996). The<br />
<strong>IUCN</strong> <strong>Red</strong> <strong>List</strong> is arguably <strong>the</strong> most useful worldwide list of species<br />
at risk of extinction (Lamoreux et al., 2003). Its usefulness is based<br />
on its reliance on a number of objective <strong>criteria</strong>, which are relatively<br />
easy to apply when adequate in<strong>for</strong>mation is available (<strong>IUCN</strong>,<br />
2001; Table 1). The <strong>Red</strong> <strong>List</strong> has been used to raise awareness about<br />
threatened species, guide conservation ef<strong>for</strong>ts and funding, set priorities<br />
<strong>for</strong> protection, measure site irreplaceability and vulnerability,<br />
influence environmental policies and legislation and evaluate<br />
and monitor <strong>the</strong> state of biodiversity (Gärden<strong>for</strong>s et al., 2001;<br />
Rodrigues et al., 2006; Baillie et al., 2008; Mace et al., 2008;<br />
Martín-López et al., 2011). The <strong>IUCN</strong> classifies species into different
Table 1<br />
Overview of <strong>the</strong> <strong>IUCN</strong> <strong>Red</strong> <strong>List</strong> <strong>criteria</strong> (AOO – Area of Occupancy; EOO – Extent of Occurrence; n – mature individuals).<br />
Criterion Critically Endangered Endangered Vulnerable<br />
A. Population reduction (over (P90% AND causes are reversible, (P70% AND causes are reversible, (P50% AND causes are reversible,<br />
10 years or three generations) understood and ceased) OR P 80% understood and ceased) OR P 50% understood and ceased) OR P 30%<br />
B. Geographic range (EOO < 100 km 2 OR AOO < 10 km 2 ) (EOO < 5000 km 2 OR AOO < 500 km 2 ) (EOO < 20,000 km 2 OR AOO < 2000 km 2 )<br />
AND two of: AND two of: AND two of:<br />
(a) fragmentation and/or a single (a) fragmentation and/or<br />
(a) fragmentation and/or<br />
location;<br />
locations 6 5;<br />
locations 6 10;<br />
(b) continuing decline; (b) continuing decline; (b) continuing decline;<br />
(c) extreme fluctuations (c) extreme fluctuations (c) extreme fluctuations<br />
C. Small population size and decline n < 250 n < 2500 n < 10,000<br />
AND (reduction P 25% over 3 years or AND (reduction P 20% over 5 years or AND (reduction P 10% over 10 years or<br />
one generation<br />
two generations<br />
three generations<br />
OR (reduction OR (reduction OR (reduction<br />
AND (larger subpopulation 6 50 AND (larger subpopulation 6 250 AND (larger subpopulation 6 1000<br />
OR P 90% individuals in a single OR P 95% individuals in a single OR 100% individuals in a single<br />
subpopulation<br />
subpopulation<br />
subpopulation<br />
OR extreme fluctuations))) OR extreme fluctuations))) OR extreme fluctuations)))<br />
D. Very small or restricted<br />
n
2434 P. Cardoso et al. / Biological Conservation 144 (2011) 2432–2440<br />
framework, which has been applied widely, even at <strong>the</strong> global scale<br />
<strong>for</strong> vertebrates. Such a dramatic change could have undesirable<br />
consequences on <strong>the</strong> <strong>Red</strong> <strong>List</strong>’s long-term benefits (Mace et al.,<br />
2008).<br />
2. Shortcomings and possible alternatives to <strong>the</strong> current <strong>criteria</strong><br />
2.1. Population reduction – Criterion A<br />
This criterion is based on <strong>the</strong> reduction of <strong>the</strong> number of individuals<br />
of a given species (Table 1). However, obtaining abundance<br />
data is particularly difficult <strong>for</strong> <strong>invertebrates</strong>, and it is usually<br />
impossible to estimate <strong>the</strong> absolute abundance of a species. Because<br />
of this, it is also very difficult to assess changes in <strong>the</strong>ir abundance<br />
through time. Monitoring population changes requires a<br />
very thorough sampling program replicated at least twice, 10 years<br />
apart to meet <strong>the</strong> <strong>IUCN</strong> <strong>criteria</strong>, but fur<strong>the</strong>r sampling ef<strong>for</strong>ts would<br />
be required to distinguish between natural fluctuations and a real<br />
decline (Fox et al., in press). This kind of long-term ecological monitoring<br />
is very rare <strong>for</strong> <strong>invertebrates</strong>. Such monitoring has been restricted<br />
mainly to butterflies (van Swaay et al., 2008; Lewis and<br />
Senior, 2011), allowing <strong>the</strong> publication of red lists (van Swaay<br />
et al., 2010, 2011; Fox et al., in press) and <strong>the</strong> selection of priority<br />
areas <strong>for</strong> conservation (van Swaay and Warren, 2006).<br />
Abundance is usually correlated with <strong>the</strong> range of a species (<strong>the</strong><br />
intraspecific range-abundance correlation; Gaston, 1994). There<strong>for</strong>e,<br />
one alternative is to use estimates of <strong>the</strong> reduction in <strong>the</strong> Area<br />
of Occupancy (AOO) as a surrogate <strong>for</strong> suspected reductions in population<br />
abundance. Never<strong>the</strong>less, <strong>the</strong> relationship between range<br />
size and abundance, although generally true, is not inevitable, and<br />
it must be justified in <strong>IUCN</strong> evaluations (Akçakaya et al., 2006). In<br />
fact, if it is generally true that no restricted species is locally abundant,<br />
some species can occupy many sites but have only small population<br />
sizes in most of <strong>the</strong>m (<strong>the</strong> triangular intraspecific rangeabundance<br />
relationship; Gaston, 1994). An additional problem is<br />
that any decline in AOO is usually inferred from a decline in habitat<br />
extent and/or quality. This makes most inferences about abundance<br />
declines in populations indirect deductions. Such inferences assume<br />
first, that point abundance is <strong>the</strong> same everywhere inside<br />
<strong>the</strong> AOO and second, that AOO follows <strong>the</strong> same decline as habitat.<br />
Instead of relying on overwhelmingly difficult to obtain (abundance)<br />
or indirect (distribution) data, we suggest <strong>the</strong> modification<br />
of this criterion to incorporate declining range size. This could be<br />
based on declining AOO using <strong>the</strong> same thresholds as population<br />
reduction. This would better reflect <strong>the</strong> type of data that is possible<br />
to obtain <strong>for</strong> <strong>invertebrates</strong> and increase <strong>the</strong> feasibility of evaluations,<br />
leading to a decrease in <strong>the</strong> number of species classified as<br />
Data Deficient (DD). This process has been successfully tested in<br />
<strong>the</strong> evaluation of <strong>the</strong> conservation status of threatened species in<br />
<strong>the</strong> Canary Islands, which included different species of arthropods<br />
(Martín et al., 2005). The Canary Islands Government has incorporated<br />
<strong>the</strong> list in its regional legislation.<br />
2.2. Geographic range – Criterion B<br />
This criterion is based on <strong>the</strong> range size of a species (AOO or Extent<br />
of Occurrence, EOO) and possible fragmentation, decline or extreme<br />
fluctuations (Table 1). The EOO is defined by <strong>the</strong> <strong>IUCN</strong> as,<br />
‘<strong>the</strong> area contained within <strong>the</strong> shortest continuous imaginary<br />
boundary that can be drawn to encompass all sites of present<br />
occurrence of a taxon’. The AOO represents <strong>the</strong> area currently occupied<br />
and is a function of <strong>the</strong> scale (e.g., spatial resolution) at which<br />
it is measured (see Gaston, 2003). It is <strong>the</strong> only existing criterion<br />
that can be properly applied to most species (Lewis and Senior,<br />
2011). However, <strong>the</strong> threshold values do not seem appropriate<br />
<strong>for</strong> many taxa. Organisms with small body sizes usually require<br />
much smaller areas than organisms with larger body sizes, and<br />
<strong>invertebrates</strong> typically have smaller ranges than vertebrates, with<br />
plants presenting intermediate values (Gaston, 2003; Martín,<br />
2009). Especially among island endemics (Martín, 2009) and troglobionts,<br />
many species meet some threshold of criterion B, including<br />
many vertebrates, even if <strong>the</strong>y are naturally rare and not,<br />
<strong>the</strong>re<strong>for</strong>e, necessarily endangered. This may lead to an overestimation<br />
of extinction risk.<br />
The <strong>IUCN</strong> recognizes that this criterion is especially difficult to<br />
meet because <strong>the</strong> use of AOO or EOO is not as robust as using<br />
<strong>the</strong> number of individuals. There<strong>for</strong>e, three conditions have to be<br />
met <strong>for</strong> each species considered: small range, habitat fragmentation<br />
and range decline (Table 1). Extreme fluctuations are usually<br />
difficult to assess. This means that non-insular and non-troglobiont<br />
species may not meet <strong>the</strong> requirements of Criterion B even if <strong>the</strong>y<br />
are endangered. There<strong>for</strong>e, classifications may also underestimate<br />
<strong>the</strong> real risk of extinction.<br />
Finally, incomplete sampling is <strong>the</strong> rule ra<strong>the</strong>r than <strong>the</strong> exception<br />
with <strong>invertebrates</strong>. The fact that a species is not known from<br />
a given region does not mean it is not present; often simply no<br />
one has searched <strong>for</strong> it. This causes <strong>the</strong> EOO and AOO of many species<br />
to be underestimated unless corrections are made. Such corrections<br />
are essential <strong>for</strong> many species described from a<br />
restricted number of individuals found in a single or few locations,<br />
which have not been fur<strong>the</strong>r studied after <strong>the</strong>ir original description.<br />
Classifications based on incomplete sampling may overestimate<br />
<strong>the</strong> real risk of extinction.<br />
As an alternative to <strong>the</strong> current <strong>criteria</strong>, we suggest that two different<br />
approaches could be used to classify a species into a risk category.<br />
Ei<strong>the</strong>r a large EOO or AOO along with two extra <strong>criteria</strong> or a<br />
small AOO or EOO and a single extra criterion could be used <strong>for</strong><br />
classification. This would increase both <strong>the</strong> feasibility, by requiring<br />
less data in many situations, and adequacy, by reducing <strong>the</strong> threshold<br />
distribution ranges <strong>for</strong> classification.<br />
We also propose two alternatives to solve <strong>the</strong> problem of<br />
incomplete sampling. First, <strong>for</strong> habitat specialist species with restricted<br />
distributions, <strong>the</strong> area of its habitat in a region could be<br />
a good surrogate <strong>for</strong> <strong>the</strong> total area occupied by that species.<br />
Second, <strong>for</strong> all o<strong>the</strong>r species, ecological modelling of species distributions<br />
may be a good option <strong>for</strong> reducing bias. Many different<br />
techniques <strong>for</strong> modelling species distributions exist (e.g., Elith<br />
et al., 2006) and <strong>the</strong>ir output is often divergent. Maximum entropy<br />
(Phillips et al., 2006) is often considered one of <strong>the</strong> most accurate<br />
(Elith et al., 2006), but ensemble <strong>for</strong>ecasting, a technique that combines<br />
a variable number of modelling techniques and reaches a<br />
consensus distribution of species, may in many cases be more<br />
accurate (Araújo et al., 2005; Thuiller et al., 2009). In order to reduce<br />
<strong>the</strong>se models’ errors, in addition to climatic variables, variables<br />
directly related to habitat suitability, such as land cover<br />
and human population density, should be used. All of <strong>the</strong>se techniques<br />
produce a map of potential distribution probabilities or<br />
habitat suitability as <strong>the</strong> output. Such a map should be converted<br />
to a binary presence/absence map to calculate AOO and EOO. The<br />
threshold above which a species should be considered as present<br />
is variable, but a few rules have been found to per<strong>for</strong>m well (Liu<br />
et al., 2005). After conversion, <strong>the</strong> EOO can be calculated as <strong>the</strong> area<br />
of <strong>the</strong> convex-hull polygon encompassing all <strong>the</strong> sites predicted as<br />
suitable <strong>for</strong> a species. The area occupied by such sites is <strong>the</strong> AOO<br />
and is nearly always smaller than <strong>the</strong> EOO.<br />
It should be noted that <strong>the</strong> output of ecological models are<br />
maps of potential distributions, not realised distributions, which<br />
can be different due to historical (e.g., geographical barriers, local<br />
extinctions caused by habitat destruction) or biological (e.g., competition,<br />
dispersal capacity) reasons. In addition, using such techniques<br />
makes it virtually impossible to calculate <strong>the</strong> number of
locations as defined by <strong>the</strong> <strong>IUCN</strong>. These kinds of techniques are<br />
only now beginning to be widely used <strong>for</strong> conservation purposes,<br />
with only a few cases pre-dating <strong>the</strong> current <strong>IUCN</strong> <strong>criteria</strong>. The<br />
application of ecological modelling should be considered in <strong>the</strong> future,<br />
particularly <strong>for</strong> invertebrate species or o<strong>the</strong>r taxa <strong>for</strong> which<br />
in<strong>for</strong>mation will probably never be complete. The best way to<br />
use distribution modelling to conduct <strong>Red</strong> <strong>List</strong> classifications is<br />
an area that deserves fur<strong>the</strong>r study.<br />
2.3. Small population size and decline – Criterion C<br />
This criterion is based on <strong>the</strong> number of individuals in a species<br />
and <strong>the</strong> possibility of <strong>the</strong>ir decline or extreme population fluctuations<br />
(Table 1). Even when it is possible to estimate <strong>the</strong> number of<br />
individuals by exhaustively conducting standardized sampling in a<br />
limited set of small areas and extrapolating (see Stroot and Depiereux,<br />
1989), <strong>the</strong> current threshold values are inadequate. Mace<br />
et al. (2008) justify <strong>the</strong> use of <strong>the</strong> current population size thresholds<br />
because ‘‘demographic stochasticity is unlikely to be important<br />
<strong>for</strong> any population that has more than about 100<br />
individuals’’. However, most invertebrate species would probably<br />
be condemned to extinction by demographic stochasticity if only<br />
100 individuals were living, given <strong>the</strong> relatively low probability<br />
that each individual finds a partner, mates, lays eggs and, in many<br />
cases, raises <strong>the</strong> juveniles until <strong>the</strong>y are independent, <strong>the</strong>re<strong>for</strong>e<br />
ensuring <strong>the</strong> survival of <strong>the</strong> next generation. The current <strong>IUCN</strong> population<br />
thresholds simply have no reasonable application <strong>for</strong> most<br />
invertebrate species and <strong>the</strong>re<strong>for</strong>e most extant global species richness.<br />
This may lead to an underestimation of extinction risk.<br />
The thresholds of abundance should increase to numbers that<br />
reflect realistic values <strong>for</strong> <strong>invertebrates</strong>, possibly a few orders of<br />
magnitude higher than <strong>the</strong> current ones, <strong>the</strong>reby increasing <strong>the</strong>ir<br />
adequacy. Given <strong>the</strong> large variability in body size of <strong>invertebrates</strong>,<br />
from dozens of microns (Cycliophorans) to more than a dozen<br />
metres (squid), <strong>the</strong> thresholds in abundance could be variable<br />
and likely even inversely correlated with body size.<br />
2.4. Very small or restricted population – Criterion D<br />
This criterion is based on <strong>the</strong> number of individuals of a species<br />
or a species found in a restricted range or number of locations (Table<br />
1). As with <strong>the</strong> previous criterion, even when it is possible to<br />
estimate <strong>the</strong> number of individuals of a species, <strong>the</strong> current threshold<br />
values are clearly inadequate. Likewise, <strong>the</strong>re<strong>for</strong>e, this criterion<br />
can lead to an underestimation of extinction risk <strong>for</strong> <strong>invertebrates</strong>.<br />
As in <strong>the</strong> previous criterion, <strong>the</strong> thresholds of abundance should<br />
be increased to adequate numbers. Additionally, given that estimating<br />
absolute abundance data is very difficult, we suggest that<br />
<strong>the</strong> AOO could be used as a sufficient criterion <strong>for</strong> more categories<br />
than Vulnerable (Table 1). Many invertebrate species are confined<br />
to extremely small areas (even less than 1 ha), and a single event<br />
could drive <strong>the</strong>m to extinction even if <strong>the</strong>y are not currently in decline.<br />
Such events, if considered as plausible near-future threats<br />
(e.g., pollution spills, nearby active volcanoes) could be used to justify<br />
listing an extremely restricted species as CR or EN. In this way,<br />
<strong>the</strong> applicability of this criterion would increase by allowing <strong>the</strong><br />
use of AOO to classify a species into any category.<br />
2.5. Quantitative analysis of extinction risk – Criterion E<br />
This criterion is based on a quantitative analysis of extinction<br />
risk (Table 1), usually population viability analysis (PVA). This<br />
technique has seldom been applied to <strong>invertebrates</strong> or o<strong>the</strong>r<br />
small-bodied organisms (Schultz and Hammond, 2003; Bergman<br />
and Kindvall, 2004). In fact, as recognized by <strong>the</strong> <strong>IUCN</strong>, this crite-<br />
P. Cardoso et al. / Biological Conservation 144 (2011) 2432–2440 2435<br />
rion requires <strong>the</strong> most exhaustive data and is difficult to apply<br />
even <strong>for</strong> many vertebrate taxa.<br />
However, PVA is not <strong>the</strong> only method <strong>for</strong> <strong>the</strong> quantitative analysis<br />
of extinction risk, and it should be possible to analyse extinction<br />
risk in situations of restricted habitat and predictable habitat<br />
disappearance (including co-extinction, see below). Moreover, decreases<br />
in habitat quality can also have major impacts on population<br />
persistence (Schultz and Hammond, 2003). Because <strong>the</strong>re is an<br />
extinction debt between <strong>the</strong> time of habitat disappearance and<br />
species extinction (Tilman et al., 1994; Triantis et al., 2010) <strong>the</strong>ir<br />
correlation is not straight<strong>for</strong>ward. This criterion should <strong>the</strong>re<strong>for</strong>e<br />
explicitly incorporate <strong>the</strong> probability of habitat disappearance <strong>for</strong><br />
species with restricted habitat types. In this way, <strong>the</strong> applicability<br />
of this criterion <strong>for</strong> invertebrate species would increase.<br />
Projections of global warming and its consequences on species<br />
usually consider 50–100 years into <strong>the</strong> future. Given <strong>the</strong> oftenshort<br />
generation time of <strong>invertebrates</strong>, using such projections<br />
may prove especially useful <strong>for</strong> classifying species into <strong>the</strong> Vulnerable<br />
category (Table 1). It is, however, extremely difficult to provide<br />
exact probabilities of extinction in a given time frame as<br />
required by <strong>the</strong> current criterion (Akçakaya et al., 2006). The quality<br />
of data is especially critical <strong>for</strong> projections using <strong>the</strong> many different<br />
long-term climate change scenarios that are available, and<br />
extinction debt must also be taken into account. Determining <strong>the</strong><br />
most appropriate way to incorporate future projections of AOO<br />
and <strong>the</strong> respective change from <strong>the</strong> present AOO, perhaps by using<br />
ecological modelling (e.g., Araújo et al., 2005), is an additional area<br />
that should be considered <strong>for</strong> future studies.<br />
2.6. Co-extinction<br />
Invertebrates are prone to extinction factors that rarely affect<br />
vertebrates (Dunn, 2005). Many species are dependent on a single<br />
host, prey or o<strong>the</strong>r species that are, <strong>for</strong> various reasons, essential to<br />
<strong>the</strong>ir survival. This includes monophagous predators and herbivores<br />
and single-species parasites or parasitoids. In fact, it has already<br />
been suggested that co-extinction may be <strong>the</strong> most<br />
common <strong>for</strong>m of extinction (Koh et al., 2004; Dunn et al., 2009).<br />
Such dependency may occur at any life stage (eggs, larvae, juveniles<br />
or adults) or sex (often males and females do not overlap in<br />
<strong>the</strong>ir use of resources).<br />
If a host or prey species is listed in any category, <strong>the</strong> dependent<br />
species should be immediately considered in same category without<br />
fur<strong>the</strong>r justification. Although this can be justified with <strong>the</strong><br />
current <strong>criteria</strong>, it is usually only through indirect evidence of <strong>the</strong><br />
inferred decline of <strong>the</strong> population.<br />
3. Case studies<br />
3.1. Datasets<br />
To test <strong>the</strong> application of <strong>the</strong> <strong>criteria</strong> to various invertebrate<br />
taxa in different regions, we have compiled in<strong>for</strong>mation <strong>for</strong> two<br />
comprehensive datasets, each with 24 species, <strong>for</strong> a total of 48 species<br />
evaluated (Appendix 1). We restricted our analyses to species<br />
endemic to each region to per<strong>for</strong>m global evaluations. The given<br />
datasets were chosen because data were relatively comprehensive,<br />
publicly available and familiar to <strong>the</strong> authors.<br />
The first dataset was composed of arthropod species endemic to<br />
<strong>the</strong> Azores archipelago. The arthropod fauna of <strong>the</strong> Azores is particularly<br />
well known because standardized sampling has been per<strong>for</strong>med<br />
over <strong>the</strong> last 10 years in all of <strong>the</strong> remaining natural<br />
<strong>for</strong>ests on <strong>the</strong> islands (Borges et al., 2005; Gaspar et al., 2008, in<br />
press). In addition, work has recently been per<strong>for</strong>med using <strong>the</strong><br />
same sampling protocol in o<strong>the</strong>r types of habitats, including heav-
2436 P. Cardoso et al. / Biological Conservation 144 (2011) 2432–2440<br />
ily impacted ones (Cardoso et al., 2009; Meijer et al., 2011). A thorough<br />
sampling of caves in <strong>the</strong> archipelago has also provided much<br />
of <strong>the</strong> data (Amorim, 2005; Borges et al., 2007). In addition to <strong>the</strong>se<br />
data, comprehensive distribution data were available and have<br />
been compiled into a recent catalogue and public database (Borges<br />
et al., 2010). The 24 species were equally divided into natural <strong>for</strong>est<br />
specialists (eight species; see definition in Triantis et al., 2010),<br />
underground cave-dwelling animals (eight species) and species<br />
from o<strong>the</strong>r habitat types (eight species) because we believed that<br />
this a priori division could balance <strong>the</strong> inclusion of endangered<br />
and common species.<br />
The second dataset was composed of spider species endemic to<br />
<strong>the</strong> Iberian Peninsula. Some spider families in Portugal and Spain<br />
are relatively well known, with standardized sampling per<strong>for</strong>med<br />
over <strong>the</strong> last 10 years in different habitat types in Portugal (Cardoso,<br />
2009). Caves were also sampled in many of <strong>the</strong> karstic areas<br />
of <strong>the</strong> region, providing much of <strong>the</strong> data. In addition to <strong>the</strong>se data,<br />
distribution data were available and have been compiled into a recent<br />
catalogue (Cardoso and Morano, 2010). The 24 species were<br />
divided into troglobionts (eight species), Dysderidae (eight species)<br />
and Zodariidae (eight species) because <strong>the</strong>se are <strong>the</strong> best known<br />
groups among <strong>the</strong> most speciose taxa.<br />
Each of <strong>the</strong> six groups of eight species was divided into three<br />
sub-groups. Two species were chosen ad hoc from those considered<br />
by <strong>the</strong> authors to be rare and in need of protection. Two were<br />
also chosen ad hoc from those considered by <strong>the</strong> authors to be<br />
common and in no need of protection. The remaining four species<br />
per group were chosen randomly from all endemic species described<br />
in order to provide an estimate of <strong>the</strong> general patterns that<br />
would emerge if all species were evaluated in a way similar to <strong>the</strong><br />
Sampled <strong>Red</strong> <strong>List</strong> Index approach (Clausnitzer et al., 2009; Cumberlidge<br />
et al., 2009; Lewis and Senior, 2011).<br />
3.2. Evaluation of <strong>criteria</strong><br />
The AOO was defined differently according to <strong>the</strong> taxa. For <strong>the</strong><br />
Azorean <strong>for</strong>est species, <strong>the</strong> AOO was calculated as <strong>the</strong> sum of <strong>the</strong><br />
area of <strong>the</strong> <strong>for</strong>est patches where each species was known to reside.<br />
Because all <strong>for</strong>est patches were thoroughly sampled, this measure<br />
should be considered as precise, although overestimated in a few<br />
cases where <strong>the</strong> species does not occupy <strong>the</strong> entire <strong>for</strong>est area,<br />
e.g., at <strong>the</strong> disturbed borders (Borges et al., 2006; Cardoso et al.,<br />
2007, 2009). For Azorean species occupying o<strong>the</strong>r habitat types,<br />
<strong>the</strong> AOO was calculated in <strong>the</strong> same way. However, <strong>for</strong> species<br />
found in large numbers in disturbed habitats, <strong>the</strong> entire area of<br />
that habitat type on <strong>the</strong> islands where <strong>the</strong> species occurred was<br />
used instead of only <strong>the</strong> patches known to be occupied. This was<br />
based on <strong>the</strong> assumption that species able to occupy disturbed<br />
habitat types could easily be present in similar, unsampled patches<br />
of habitat. For troglobiont species, in ei<strong>the</strong>r <strong>the</strong> Azores or <strong>the</strong> Iberian<br />
Peninsula, <strong>the</strong> approximate area of <strong>the</strong> cave systems occupied<br />
by <strong>the</strong> species was used. Because caves belonging to <strong>the</strong> same system<br />
are usually connected, we assumed that <strong>the</strong> entire area could<br />
be part of <strong>the</strong> AOO even if <strong>the</strong> species may not have occupied <strong>the</strong><br />
entire system.<br />
For epigean species on <strong>the</strong> Iberian Peninsula (Dysderidae and<br />
Zodariidae), we calculated <strong>the</strong> potential distribution using <strong>the</strong><br />
maximum entropy method with Maxent software (Phillips et al.,<br />
2006). Eleven spatial variables were used <strong>for</strong> this modelling, all<br />
with a resolution of one square kilometre: (1) annual mean temperature;<br />
(2) temperature seasonality; (3) annual precipitation;<br />
(4) precipitation seasonality; (5) potential evapotranspiration; (6)<br />
NDVI; (7) land cover; (8) human population density; (9) altitude;<br />
(10) latitude; and (11) longitude. The continuous probability maps<br />
generated by this method were <strong>the</strong>n converted to presence–absence<br />
maps using an option that equalized sensitivity and specific-<br />
ity as <strong>the</strong> threshold (Liu et al., 2005). Each site evaluated as suitable<br />
<strong>for</strong> <strong>the</strong> species was considered part of <strong>the</strong> AOO.<br />
In <strong>the</strong> current study, EOO was defined by <strong>the</strong> minimum convex<br />
polygon joining all <strong>the</strong> occurrences of a species, as suggested by <strong>the</strong><br />
<strong>IUCN</strong> guidelines. The exception, following <strong>the</strong> <strong>IUCN</strong> recommendations,<br />
was with species in <strong>the</strong> Azores that live on different islands.<br />
In such cases, <strong>the</strong> total EOO was calculated as <strong>the</strong> sum of <strong>the</strong> polygons<br />
on each island because including <strong>the</strong> sea between <strong>the</strong> islands<br />
would artificially increase <strong>the</strong> EOO by several orders of magnitude.<br />
For <strong>the</strong> species whose AOO was calculated based on distribution<br />
modelling, <strong>the</strong> EOO was <strong>the</strong> area of <strong>the</strong> polygon encompassing<br />
<strong>the</strong> entire potential AOO.<br />
The number of locations was calculated per <strong>the</strong> <strong>IUCN</strong> guidelines<br />
as ‘‘a geographically or ecologically distinct area in which a single<br />
threatening event can rapidly affect all individuals of <strong>the</strong> taxon<br />
present’’. In some cases, this was a subjective decision because<br />
<strong>the</strong> extent of future threatening events was difficult to quantify.<br />
The number of locations of <strong>the</strong> species modelled using Maxent<br />
was impossible to determine.<br />
The possible decline and <strong>the</strong> causes <strong>for</strong> decline or extreme fluctuations<br />
in <strong>the</strong> EOO, AOO or number of locations were evaluated<br />
according to <strong>the</strong> known history of <strong>the</strong> habitat (e.g., loss, fragmentation,<br />
invasion by exotic species). The percentage of decline was<br />
impossible to calculate <strong>for</strong> all cases except <strong>for</strong> Anapistula ataecina,<br />
whose habitat is being eliminated by stone quarries (Cardoso and<br />
Scharff, 2009). We were able to infer declines in habitat quality<br />
<strong>for</strong> most species inhabiting one or a few habitats. Fragmentation<br />
of subpopulations was assumed if <strong>the</strong> habitat was fragmented<br />
without adequate corridors between <strong>the</strong> patches; this was usually<br />
<strong>the</strong> case <strong>for</strong> Azorean <strong>for</strong>est specialists and <strong>for</strong> all troglobionts.<br />
We had no abundance data or even rough estimates of abundance<br />
<strong>for</strong> any of <strong>the</strong> species. Instead of considering this value as<br />
unknown, we used <strong>the</strong> arbitrary abundance of 1,000,000 <strong>for</strong> all<br />
species. Using this value allowed us to obtain classifications <strong>for</strong><br />
many species that would be evaluated as DD if ‘‘Unknown’’ were<br />
used. Because we used a conservative value that was far above<br />
<strong>the</strong> abundance thresholds defined by any of <strong>the</strong> <strong>criteria</strong>, we could<br />
avoid <strong>the</strong> classification of any species as at risk based in any way<br />
on abundance values.<br />
Given <strong>the</strong> uncertainty that inevitably arises when many of <strong>the</strong><br />
parameters are unknown, we used <strong>the</strong> RAMAS software package<br />
(Akçakaya and Ferson, 2001) to build a file <strong>for</strong> each species and<br />
reach a single classification (all files are available from <strong>the</strong> first<br />
author by request). In cases of uncertainty, we used <strong>the</strong> most plausible<br />
classification given by <strong>the</strong> software, as suggested by Colyvan<br />
et al. (1999).<br />
3.3. Results<br />
The EOO and AOO <strong>for</strong> most species were below <strong>the</strong> thresholds<br />
needed to classify any species as at risk, even <strong>for</strong> some common<br />
species (Fig. 1; Appendices 1 and 2). For <strong>the</strong> Azores dataset in particular,<br />
all species necessarily had an EOO and AOO smaller than<br />
<strong>the</strong> area of <strong>the</strong> archipelago (2346 km 2 ; Fig. 1). Moreover, being<br />
an archipelago with large distances between islands, many species<br />
that live on more than one island fulfilled <strong>the</strong> fragmentation subcriterion<br />
(B1a), and most single-island endemics fulfilled <strong>the</strong> number<br />
of locations sub-criterion (B1a). This implied that most endemic<br />
species with any kind of decline were immediately classified<br />
at least as EN (Appendix 1). This criterion was also met by <strong>the</strong><br />
cave-dwelling species we assessed, with all troglobionts classified<br />
as ei<strong>the</strong>r CR or EN, unless <strong>the</strong> in<strong>for</strong>mation available was scarce and<br />
an assessment of DD was reached (Appendix 1). In fact, one-third<br />
of <strong>the</strong> 48 species had an EOO below <strong>the</strong> threshold <strong>for</strong> a classification<br />
of CR (100 km 2 ) and one-quarter presented an AOO below<br />
<strong>the</strong> threshold <strong>for</strong> <strong>the</strong> same classification (10 km 2 ).
In many cases, it was impossible to assess whe<strong>the</strong>r <strong>the</strong>re was a<br />
continuing decline in EOO or AOO and, if so, <strong>the</strong> causes (Fig. 1;<br />
Appendix 1). Such assessment was only possible <strong>for</strong> species with<br />
restricted habitat preferences where <strong>the</strong> decline was inferred from<br />
a decline in habitat area and/or quality. Extreme fluctuations were<br />
impossible to assess in all but a few species that were very common<br />
and <strong>the</strong>re<strong>for</strong>e did not present such fluctuations.<br />
P. Cardoso et al. / Biological Conservation 144 (2011) 2432–2440 2437<br />
Fig. 1. Data of extent of occurrence, Area of Occupancy and number of locations <strong>for</strong> <strong>the</strong> 48 species evaluated in this study.<br />
The number of known locations was low in most cases except<br />
<strong>for</strong> species classified a priori as common (Fig. 1). A continuous decline<br />
in <strong>the</strong> number of locations was impossible to assess in half<br />
<strong>the</strong> cases. When it was possible to reach some conclusion, it was<br />
necessary to infer a decline in <strong>the</strong> number of locations from a decline<br />
in AOO, which, as described above, was inferred from a decline<br />
in habitat area and/or quality.
2438 P. Cardoso et al. / Biological Conservation 144 (2011) 2432–2440<br />
Fragmentation was a common situation, given <strong>the</strong> number of<br />
insular, habitat specialist and troglobiont species in our datasets.<br />
For habitat generalists, fragmentation was usually classified as unknown.<br />
Determining declines in habitat quality followed <strong>the</strong> same<br />
trend as fragmentation, as <strong>the</strong> two concepts are necessarily<br />
interconnected.<br />
As mentioned above, absolute abundances, even if roughly estimated,<br />
were impossible to obtain <strong>for</strong> any species (Appendix 1).<br />
Long-term population monitoring of only one species, Trechus terceiranus,<br />
has been per<strong>for</strong>med. However, even after years of study,<br />
only <strong>the</strong> tendencies (decreasing) and not <strong>the</strong> absolute numbers<br />
are known (Borges et al., 2007; Borges and Pereira, unpublished<br />
data). Even <strong>for</strong> this well-studied species, it was impossible to<br />
determine <strong>the</strong> percentage decline in <strong>the</strong> number of individuals<br />
over <strong>the</strong> years. There<strong>for</strong>e, <strong>the</strong>se values all had to be inferred from<br />
perceived declines in <strong>the</strong> AOO, which were <strong>the</strong>mselves inferred<br />
from declines in habitat area and/or quality, as described above.<br />
In all cases, it was not possible to determine <strong>the</strong> proportion of individuals<br />
in <strong>the</strong> largest subpopulation or whe<strong>the</strong>r <strong>the</strong>re were extreme<br />
fluctuations in abundance.<br />
It was impossible to obtain <strong>the</strong> probability of extinction within<br />
a given time frame due to <strong>the</strong> requirement <strong>for</strong> unavailable data<br />
(Appendix 1). At a minimum, it would be necessary to know <strong>the</strong><br />
rate of future disappearance of adequate habitat. However, <strong>the</strong>se<br />
data were not available at <strong>the</strong> time of writing.<br />
More than one-quarter (27%) of <strong>the</strong> 48 evaluated species were<br />
classified as Critically Endangered, 19% as Endangered, 6% as Vulnerable<br />
and 8% as Least Concern. The remaining 40% did not have<br />
enough data to reach a classification (Fig. 2).<br />
If we only took into account <strong>the</strong> 24 randomly chosen species,<br />
<strong>the</strong> numbers changed but <strong>the</strong> trends were similar (Fig. 2). Remarkably,<br />
not a single species chosen randomly could be considered as<br />
Least Concern (LC), and more than half <strong>the</strong> species, mostly Iberian<br />
spiders, had to be classified as DD due to <strong>the</strong> lack of appropriate<br />
data. This meant that all species were classified as in risk of extinction<br />
to some degree.<br />
3.4. Feasibility and adequacy of species evaluations<br />
In many cases, all <strong>the</strong> in<strong>for</strong>mation available about each of <strong>the</strong><br />
species evaluated was insufficient to reach an assessment. Assessments<br />
were possible only <strong>for</strong> those species with relatively wellknown<br />
distribution (allowing <strong>the</strong> estimation of EOO and AOO)<br />
and restricted habitats (allowing <strong>the</strong> evaluation of fragmentation<br />
and habitat quality) that had been studied with quantitative methods<br />
(allowing <strong>the</strong> evaluation of possible declines). When <strong>the</strong>se<br />
three requirements were fulfilled, <strong>the</strong> Wallacean, Prestonian and<br />
Fig. 2. Classifications reached <strong>for</strong> <strong>the</strong> 48 species evaluated in this study.<br />
Table 2<br />
Overview of shortcomings of <strong>the</strong> current <strong>criteria</strong> and possible alternatives <strong>for</strong><br />
<strong>invertebrates</strong> (AOO – Area of Occupancy; EOO – Extent of Occurrence).<br />
Criterion Shortcomings Alternatives<br />
A. Population<br />
reduction<br />
B. Geographic<br />
range<br />
C. Small<br />
population<br />
size and<br />
decline<br />
D. Very small or<br />
restricted<br />
population<br />
Hutchinsonian shortfalls (see Cardoso et al., in press) could be<br />
overcome and a classification reached.<br />
Paradoxically, it seems to be harder to obtain reliable in<strong>for</strong>mation<br />
<strong>for</strong> common species. If a species is restricted in area and habitat<br />
type, it is relatively easy to relate habitat loss with loss of EOO<br />
or AOO. If a species is not restricted to a small area or a unique habitat,<br />
it becomes a daunting task to determine its current trends.<br />
However, common species could also have a declining trend in<br />
both abundance and distribution (Gaston, 2010). Thus, <strong>the</strong> feasibility<br />
of <strong>the</strong> current <strong>criteria</strong> is compromised. A fur<strong>the</strong>r consequence of<br />
this paradox is that almost all species that were possible to be evaluated,<br />
even species considered a priori as common and non-endangered,<br />
were classified as at risk, most commonly as Critically<br />
Endangered. This is more evident <strong>for</strong> <strong>the</strong> island species, which<br />
could create <strong>the</strong> ‘‘island artefact’’ (overestimation of risk) because<br />
<strong>the</strong> small size of islands manifests in most single-island endemic<br />
species being easily classified into one of <strong>the</strong> <strong>IUCN</strong> categories (Martín,<br />
2009). The adequacy of <strong>the</strong> current <strong>criteria</strong> is <strong>the</strong>re<strong>for</strong>e also<br />
compromised. If both feasibility and adequacy seem to be far from<br />
ideal, <strong>the</strong> discussion of a number of improvements to <strong>the</strong> current<br />
<strong>criteria</strong> seems to be necessary (Table 2).<br />
4. Conclusions<br />
Abundance decline difficult to<br />
measure<br />
Use declining AOO as<br />
alternative to<br />
abundance<br />
<strong>Red</strong>uce EOO and AOO<br />
thresholds<br />
Stipulate less<br />
requirements<br />
EOO and AOO very large <strong>for</strong><br />
<strong>invertebrates</strong><br />
Hard to meet all<br />
requirements (small range,<br />
fragmentation, decline)<br />
Incomplete sampling Habitat area <strong>for</strong> habitat<br />
specialist species<br />
Ecological modelling<br />
Inadequate threshold values Increase abundance<br />
<strong>for</strong> abundance<br />
thresholds<br />
Inadequate threshold values<br />
<strong>for</strong> abundance<br />
Increase abundance<br />
thresholds<br />
Abundance data hard to Use AOO as alternative<br />
obtain<br />
to abundance<br />
E. Quantitative Very difficult to apply Use habitat<br />
analysis of without a large amount of disappearance <strong>for</strong><br />
extinction risk data<br />
habitat specialist<br />
species<br />
Use future projections<br />
of EOO and AOO<br />
F. Co-extinction Not considered Dependent species with<br />
same category as host/<br />
prey<br />
The evaluation of risk and <strong>the</strong> ranking of species based on<br />
extinction risk is <strong>the</strong> objective of <strong>the</strong> <strong>IUCN</strong> <strong>Red</strong> <strong>List</strong> <strong>criteria</strong>. However,<br />
we argue that <strong>the</strong> current <strong>criteria</strong> may present serious shortcomings<br />
when applied to <strong>the</strong> majority of invertebrate groups<br />
(Table 2), and thus to <strong>the</strong> majority of known species. The <strong>criteria</strong><br />
should be both feasible, in <strong>the</strong> sense that <strong>the</strong> in<strong>for</strong>mation required<br />
should be obtainable without an unreasonable ef<strong>for</strong>t, and adequate,<br />
in <strong>the</strong> sense that <strong>the</strong> <strong>criteria</strong> should allow realistic ranking<br />
of species according to <strong>the</strong>ir extinction risk.<br />
A prevailing issue in <strong>the</strong> classification of invertebrate species<br />
(and probably many plant and fungi taxa) according to <strong>the</strong> current
<strong>criteria</strong> is subjectivity (Lewis and Senior, 2011). As mentioned<br />
above, many trends are inferred from indirect evidence and <strong>the</strong><br />
methods <strong>for</strong> determining <strong>the</strong>m largely depend on <strong>the</strong> perception<br />
of each evaluator at each moment (Verdú and Galante, 2006). This<br />
means that <strong>the</strong> seemingly objective <strong>criteria</strong> often are subjectively<br />
applied. Subjectivity is even more influential if many taxa are being<br />
evaluated simultaneously and <strong>the</strong> evaluators avoid assigning species<br />
to <strong>the</strong> DD status.<br />
The application of <strong>the</strong> current <strong>criteria</strong> to <strong>invertebrates</strong> is mostly<br />
limited to criterion B (e.g., Lewis and Senior, 2011) and in some<br />
cases A or D (van Swaay et al., 2010; Fox et al., in press; Lewis<br />
and Senior, 2011). There<strong>for</strong>e, adapting <strong>the</strong> <strong>criteria</strong> to explicitly<br />
incorporate measures of AOO and EOO in addition to population<br />
size is critically important to overcome <strong>the</strong> feasibility problems<br />
and allow <strong>the</strong> proper application of <strong>criteria</strong> A, C (in some cases)<br />
and D. Criterion E could also be modified to ensure easy implementation<br />
<strong>for</strong> habitat-restricted species or those that are predicted to<br />
be most affected by climate change. Additionally, co-extinction<br />
could be included as part of <strong>the</strong> process (Table 2). As <strong>the</strong> <strong>criteria</strong><br />
are currently defined, <strong>the</strong>y seem targeted toward <strong>the</strong> exceptions<br />
in data availability ra<strong>the</strong>r than <strong>the</strong> rule.<br />
Adequacy problems are probably more difficult to overcome.<br />
This implies ei<strong>the</strong>r that changes should be made to <strong>the</strong> current<br />
threshold values <strong>for</strong> <strong>invertebrates</strong> or that sub-categories should<br />
be created to guarantee comparability with o<strong>the</strong>r taxa. Dividing<br />
each extinction risk category into sub-categories would allow better<br />
discrimination between rare and relatively common species<br />
that are currently listed in <strong>the</strong> same category. This discrimination<br />
would increase <strong>the</strong> adequacy of <strong>the</strong> current <strong>criteria</strong>.<br />
Given reasonable in<strong>for</strong>mation and adequate <strong>criteria</strong>, it is possible<br />
to evaluate all taxa in an unbiased and objective manner, from<br />
<strong>the</strong> smallest insect to <strong>the</strong> largest mammal (Martín et al., 2010). Our<br />
proposal is intended to promote debate among experts. Having a<br />
parallel set of <strong>criteria</strong> <strong>for</strong> <strong>invertebrates</strong>, and eventually <strong>for</strong> o<strong>the</strong>r little-known<br />
taxa, would allow experts to fill in <strong>the</strong> gap that currently<br />
exists between <strong>the</strong> number of assessed species and <strong>the</strong> number of<br />
described species. With <strong>the</strong> current rate of species description<br />
(15,000 invertebrate species per year, see: http://www.organismnames.com),<br />
this gap is, in fact, increasing every day.<br />
Finally, we emphasize that red lists are not usually equivalent<br />
to legally protected species lists (Martín et al., 2010). Translating<br />
a list of endangered species to binding law is a final, essential, step<br />
in <strong>the</strong> adequate protection of our biodiversity. Using a set of objective<br />
<strong>criteria</strong> to create red lists and, in later stages, protected species<br />
lists, would allow prioritizing species protection in a rigorous, efficient<br />
way.<br />
Acknowledgements<br />
PC is supported by <strong>the</strong> Portuguese Foundation <strong>for</strong> Science and<br />
Technology (SFRH/BPD/40688/2007). The data obtained in <strong>the</strong><br />
Azores was possible due to <strong>the</strong> accumulated ef<strong>for</strong>t of many colleagues<br />
during BALA Project (funded by <strong>the</strong> Direcção Regional<br />
dos Recursos Florestais – Proj. 17.01-080203) and more recently<br />
<strong>the</strong> projects ‘‘Consequences of land-use change on Azorean fauna<br />
and flora – <strong>the</strong> 2010 Target’’ (Ref: Direcção Regional da Ciência e<br />
Tecnologia M.2.1.2/I/003/2008) and FCT-PTDC/BIA-BEC/100182/<br />
2008 – ‘‘Predicting extinctions on islands: a multi-scale<br />
assessment’’.<br />
Appendix A. Supplementary material<br />
Supplementary data associated with this article can be found, in<br />
<strong>the</strong> online version, at doi:10.1016/j.biocon.2011.06.020.<br />
P. Cardoso et al. / Biological Conservation 144 (2011) 2432–2440 2439<br />
References<br />
Akçakaya, H.R., Ferson, S., 2001. RAMAS Ò <strong>Red</strong> <strong>List</strong>: Threatened Species<br />
Classifications under Uncertainty. Version 2.0. Applied Bioma<strong>the</strong>matics, New<br />
York.<br />
Akçakaya, H.R., Butchart, S.H.M., Mace, G.M., Stuart, S.N., Hilton-Taylor, C., 2006. Use<br />
and misuse of <strong>the</strong> <strong>IUCN</strong> <strong>Red</strong> <strong>List</strong> <strong>criteria</strong> in projecting climate change impacts on<br />
biodiversity. Glob. Change Biol. 12, 2037–2043.<br />
Amorim, I.R., 2005. Colonization and diversification on oceanic islands: <strong>for</strong>est<br />
Tarphius and cave-dwelling Trechus beetles of <strong>the</strong> Azores. Ph.D. dissertation,<br />
Department of Ecology and Evolutionary Biology, University of Cali<strong>for</strong>nia, Los<br />
Angeles.<br />
Araújo, M.B., Whittaker, R.J., Ladle, R.J., Erhard, M., 2005. <strong>Red</strong>ucing uncertainty in<br />
projections of extinction risk from climate change. Glob. Ecol. Biogeogr. 14,<br />
529–538.<br />
Baillie, J.E.M., Collen, B., Amin, R., Akçakaya, H.R., Butchart, S.H.M., Brummitt, N.,<br />
Meagher, T.R., Ram, M., Hilton-Taylor, C., Mace, G.M., 2008. Toward monitoring<br />
global biodiversity. Conserv. Lett. 1, 18–26.<br />
Bergman, K.O., Kindvall, O., 2004. Population viability analysis of <strong>the</strong> butterfly<br />
Lopinga achine in a changing landscape in Sweden. Ecography 27, 49–58.<br />
Borges, P.A.V., Aguiar, C., Amaral, J., Amorim, I.R., André, G., Arraiol, A., Baz, A., Dinis,<br />
F., Enghoff, H., Gaspar, C., Ilharco, F., Mahnert, V., Melo, C., Pereira, F., Quartau,<br />
J.A., Ribeiro, S., Ribes, J., Serrano, A.R.M., Sousa, A.B., Strassen, R.Z., Vieira, L.,<br />
Vieira, V., Vitorino, A., Wunderlich, J., 2005. Ranking protected areas in <strong>the</strong><br />
Azores using standardized sampling of soil epigean arthropods. Biodivers.<br />
Conserv. 14, 2029–2060.<br />
Borges, P.A.V., Lobo, J.M., Azevedo, E.B., Gaspar, C., Melo, C., Nunes, L.V., 2006.<br />
Invasibility and species richness of island endemic arthropods: a general model<br />
of endemic vs. exotic species. J. Biogeogr. 33, 169–187.<br />
Borges, P.A.V., Oromí, P., Serrano, A.R.M., Amorim, I.R., Pereira, F., 2007. Biodiversity<br />
patterns of cavernicolous ground-beetles and <strong>the</strong>ir conservation status in <strong>the</strong><br />
Azores, with <strong>the</strong> description of a new species: Trechus isabelae n. sp.<br />
(Coleoptera, Carabidae, Trechinae). Zootaxa 1478, 21–31.<br />
Borges, P.A.V., Gabriel, R., Arroz, A., Costa, A., Cunha, R., Silva, L., Mendonça, E.,<br />
Martins, A.F., Reis, F., Cardoso, P., 2010. The Azorean Biodiversity Portal: an<br />
internet database <strong>for</strong> regional biodiversity outreach. Syst. Biodivers. 8, 423–434.<br />
Cabeza, M., Arponen, A., Van Teeffelen, A., 2008. Top predators: hot or not? A call <strong>for</strong><br />
systematic assessment of biodiversity surrogates. J. Appl. Ecol. 45, 976–980.<br />
Cardoso, P., 2009. Standardization and optimization of arthropod inventories – <strong>the</strong><br />
case of Iberian spiders. Biodivers. Conserv. 18, 3949–3962.<br />
Cardoso, P., Morano, E., 2010. The Iberian spider checklist (Araneae). Zootaxa 2495,<br />
1–52.<br />
Cardoso, P., Scharff, N., 2009. First record of <strong>the</strong> spider family Symphytognathidae in<br />
Europe and description of Anapistula ataecina sp. n. (Araneae). Zootaxa 2246,<br />
45–57.<br />
Cardoso, P., Borges, P.A.V., Gaspar, C., 2007. Biotic integrity of <strong>the</strong> arthropod<br />
communities in <strong>the</strong> natural <strong>for</strong>ests of Azores. Biodivers. Conserv. 16, 2883–2901.<br />
Cardoso, P., Aranda, S.C., Lobo, J.M., Dinis, F., Gaspar, C., Borges, P.A.V., 2009. A<br />
spatial scale assessment of habitat effects on arthropod communities of an<br />
oceanic island. Acta Oecol. 35, 590–597.<br />
Cardoso, P., Arnedo, M.A., Triantis, K.A., Borges, P.A.V., 2010. <strong>Dr</strong>ivers of diversity in<br />
Macaronesian spiders and <strong>the</strong> role of species extinctions. J. Biogeogr. 37, 1034–<br />
1046.<br />
Cardoso, P., Erwin, T.L., Borges, P.A.V., New, T.R., in press. The seven impediments in<br />
invertebrate conservation and how to overcome <strong>the</strong>m. Biol. Conserv.<br />
doi:10.1016/j.biocon.2011.07.024.<br />
Clark, J.A., May, R.M., 2002. Taxonomic bias in conservation research. Science 297,<br />
191–192.<br />
Clausnitzer, V., Kalkman, V.J., Ram, M., Collen, B., Baillie, J.E.M., Bedjanic, M.,<br />
Darwall, W.R.T., Dijkstra, K.B., Dow, R., Hawking, J., Karube, H., Malikova, E.,<br />
Paulson, D., Schütte, K., Suhling, F., Villanuevam, R.J., Ellenrieder, N., Wilson, K.,<br />
2009. Odonata enter <strong>the</strong> biodiversity crisis debate: <strong>the</strong> first global assessment<br />
of an insect group. Biol. Conserv. 142, 1864–1869.<br />
Colyvan, M., Burgman, M.A., Todd, C.R., Akçakaya, H.R., Boek, C., 1999. The treatment<br />
of uncertainty and <strong>the</strong> structure of <strong>the</strong> <strong>IUCN</strong> threatened species categories. Biol.<br />
Conserv. 89, 245–249.<br />
Cumberlidge, N., Ng, P.K., Yeo, D.C.J., Magalhaes, C., Campos, M.R., Alvarez, F.,<br />
Naruse, T., Daniel, S.R., Esser, L.J., Attipoe, F.Y.K., Clotilde-Ba, F.-L., Darwall, W.,<br />
Mcivor, A., Ram, M., Baillie, J.E.M., Collen, B., 2009. Freshwater crabs and <strong>the</strong><br />
biodiversity crisis: importance, threats, status, and conservation challenges.<br />
Biol. Conserv. 142, 1665–1673.<br />
Dunn, R.R., 2005. Modern insect extinctions, <strong>the</strong> neglected majority. Conserv. Biol.<br />
19, 1030–1036.<br />
Dunn, R.R., Harris, N.C., Colwell, R.K., Koh, L.P., Sodhi, N.S., 2009. The sixth mass<br />
coextinction: are most endangered species parasites and mutualists? Proc. Roy.<br />
Soc. B 276, 3037–3045.<br />
Elith, J., Graham, C.H., Anderson, R.P., Dudik, M., Ferrier, S., Guisan, A., Hijmans, R.J.,<br />
Huettmann, F., Leathwick, J.R., Lehmann, A., Li, J., Lohmann, L.G., Loiselle, B.A.,<br />
Manion, G., Moritz, G., Nakamura, M., Nakazawa, Y., McC Overton, J., Peterson, A.T.,<br />
Phillips, S.J., Richardson, K., Scachetti-Pereira, R., Schapire, R.E., Soberon, J.,<br />
Williams, S., Wisz, M.S., Zimmermann, N.E., 2006. Novel methods improve<br />
prediction of species’ distributions from occurrence data. Ecography 29, 129–151.<br />
Fox, R., Warren, M.S., Brereton, T.M., Roy, D.B., Robinson, A., in press. A new <strong>Red</strong> <strong>List</strong> of<br />
British butterflies. Insect Conserv. Diver. doi:10.1111/j.1752-4598.2010.00117.x.
2440 P. Cardoso et al. / Biological Conservation 144 (2011) 2432–2440<br />
Gärden<strong>for</strong>s, U., Hilton-Taylor, C., Mace, G.M., Rodríguez, J.P., 2001. The application of<br />
<strong>IUCN</strong> <strong>Red</strong> <strong>List</strong> <strong>criteria</strong> at regional levels. Conserv. Biol. 15, 1206–1212.<br />
Gaspar, C., Borges, P.A.V., Gaston, K.J., 2008. Diversity and distribution of arthropods<br />
in native <strong>for</strong>ests of <strong>the</strong> Azores archipelago. Arquipélago 25, 1–30.<br />
Gaspar, C., Gaston, K.J., Borges, P.A.V., Cardoso, P., in press. Selection of priority areas<br />
<strong>for</strong> arthropod conservation in <strong>the</strong> Azores archipelago. J. Insect Conserv.<br />
doi:10.1007/s10841-010-9365-4.<br />
Gaston, K.J., 1994. Rarity. Chapman and Hall, London.<br />
Gaston, K.J., 2003. The Structure and Dynamics of Geographic Ranges. Ox<strong>for</strong>d<br />
University Press, Ox<strong>for</strong>d.<br />
Gaston, K.J., 2010. Valuing common species. Science 327, 154–155.<br />
Gaston, K.J., Rodrigues, A.S.L., 2003. Reserve selection in regions with poor biological<br />
data. Conserv. Biol. 17, 188–195.<br />
Hallingbäck, T., 2007. Working with Swedish cryptogam conservation. Biol.<br />
Conserv. 135, 334–340.<br />
Hallingbäck, T., Hodgetts, N., Raeymaekers, G., Schumacker, R., Sérgio, C.,<br />
Søderstrøm, L., Stewart, N., Vana, J., 1998. Guidelines <strong>for</strong> application of <strong>the</strong><br />
revised <strong>IUCN</strong> threat categories to bryophytes. Lindbergia 23, 6–12.<br />
<strong>IUCN</strong>, 2001. <strong>IUCN</strong> <strong>Red</strong> <strong>List</strong> Categories and Criteria version 3.1.