

Science and Management Technical Series_vol1_final.pdf - Upper ...
Science and Management Technical Series_vol1_final.pdf - Upper ...
Science and Management Technical Series_vol1_final.pdf - Upper ...

You also want an ePaper? Increase the reach of your titles
YUMPU automatically turns print PDFs into web optimized ePapers that Google loves.
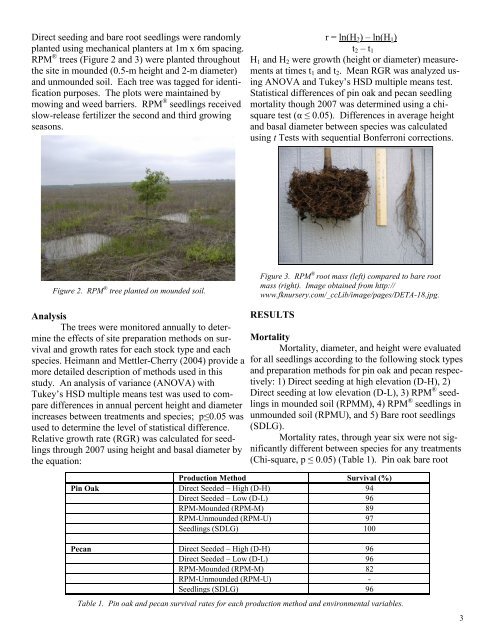
Direct seeding <strong>and</strong> bare root seedlings were r<strong>and</strong>omly<br />
planted using mechanical planters at 1m x 6m spacing.<br />
RPM ® trees (Figure 2 <strong>and</strong> 3) were planted throughout<br />
the site in mounded (0.5-m height <strong>and</strong> 2-m diameter)<br />
<strong>and</strong> unmounded soil. Each tree was tagged for identification<br />
purposes. The plots were maintained by<br />
mowing <strong>and</strong> weed barriers. RPM ® seedlings received<br />
slow-release fertilizer the second <strong>and</strong> third growing<br />
seasons.<br />
Figure 2. RPM ® tree planted on mounded soil.<br />
Analysis<br />
The trees were monitored annually to determine<br />
the effects of site preparation methods on survival<br />
<strong>and</strong> growth rates for each stock type <strong>and</strong> each<br />
species. Heimann <strong>and</strong> Mettler-Cherry (2004) provide a<br />
more detailed description of methods used in this<br />
study. An analysis of variance (ANOVA) with<br />
Tukey’s HSD multiple means test was used to compare<br />
differences in annual percent height <strong>and</strong> diameter<br />
increases between treatments <strong>and</strong> species; p≤0.05 was<br />
used to determine the level of statistical difference.<br />
Relative growth rate (RGR) was calculated for seedlings<br />
through 2007 using height <strong>and</strong> basal diameter by<br />
the equation:<br />
r = ln(H2) – ln(H1)<br />
t2 – t1<br />
H1 <strong>and</strong> H2 were growth (height or diameter) measurements<br />
at times t1 <strong>and</strong> t2. Mean RGR was analyzed using<br />
ANOVA <strong>and</strong> Tukey’s HSD multiple means test.<br />
Statistical differences of pin oak <strong>and</strong> pecan seedling<br />
mortality though 2007 was determined using a chisquare<br />
test (α ≤ 0.05). Differences in average height<br />
<strong>and</strong> basal diameter between species was calculated<br />
using t Tests with sequential Bonferroni corrections.<br />
Figure 3. RPM ® root mass (left) compared to bare root<br />
mass (right). Image obtained from http://<br />
www.fknursery.com/_ccLib/image/pages/DETA-18.jpg.<br />
RESULTS<br />
Mortality<br />
Mortality, diameter, <strong>and</strong> height were evaluated<br />
for all seedlings according to the following stock types<br />
<strong>and</strong> preparation methods for pin oak <strong>and</strong> pecan respectively:<br />
1) Direct seeding at high elevation (D-H), 2)<br />
Direct seeding at low elevation (D-L), 3) RPM ® seedlings<br />
in mounded soil (RPMM), 4) RPM ® seedlings in<br />
unmounded soil (RPMU), <strong>and</strong> 5) Bare root seedlings<br />
(SDLG).<br />
Mortality rates, through year six were not significantly<br />
different between species for any treatments<br />
(Chi-square, p ≤ 0.05) (Table 1). Pin oak bare root<br />
Production Method Survival (%)<br />
Pin Oak Direct Seeded – High (D-H) 94<br />
Direct Seeded – Low (D-L) 96<br />
RPM-Mounded (RPM-M) 89<br />
RPM-Unmounded (RPM-U) 97<br />
Seedlings (SDLG) 100<br />
Pecan Direct Seeded – High (D-H) 96<br />
Direct Seeded – Low (D-L) 96<br />
RPM-Mounded (RPM-M) 82<br />
RPM-Unmounded (RPM-U) -<br />
Seedlings (SDLG) 96<br />
Table 1. Pin oak <strong>and</strong> pecan survival rates for each production method <strong>and</strong> environmental variables.<br />
3