Science and Management Technical Series_vol1_final.pdf - Upper ...
Science and Management Technical Series_vol1_final.pdf - Upper ...
Science and Management Technical Series_vol1_final.pdf - Upper ...
You also want an ePaper? Increase the reach of your titles
YUMPU automatically turns print PDFs into web optimized ePapers that Google loves.
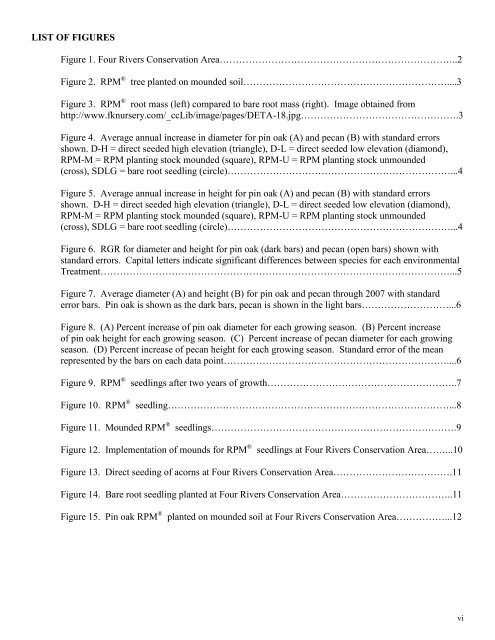
LIST OF FIGURES<br />
Figure 1. Four Rivers Conservation Area………………………………………………………………..2<br />
Figure 2. RPM ® tree planted on mounded soil………………………………………………………....3<br />
Figure 3. RPM ® root mass (left) compared to bare root mass (right). Image obtained from<br />
http://www.fknursery.com/_ccLib/image/pages/DETA-18.jpg………………………………………….3<br />
Figure 4. Average annual increase in diameter for pin oak (A) <strong>and</strong> pecan (B) with st<strong>and</strong>ard errors<br />
shown. D-H = direct seeded high elevation (triangle), D-L = direct seeded low elevation (diamond),<br />
RPM-M = RPM planting stock mounded (square), RPM-U = RPM planting stock unmounded<br />
(cross), SDLG = bare root seedling (circle)……………………………………………………………...4<br />
Figure 5. Average annual increase in height for pin oak (A) <strong>and</strong> pecan (B) with st<strong>and</strong>ard errors<br />
shown. D-H = direct seeded high elevation (triangle), D-L = direct seeded low elevation (diamond),<br />
RPM-M = RPM planting stock mounded (square), RPM-U = RPM planting stock unmounded<br />
(cross), SDLG = bare root seedling (circle)……………………………………………………………...4<br />
Figure 6. RGR for diameter <strong>and</strong> height for pin oak (dark bars) <strong>and</strong> pecan (open bars) shown with<br />
st<strong>and</strong>ard errors. Capital letters indicate significant differences between species for each environmental<br />
Treatment………………………………………………………………………………………………...5<br />
Figure 7. Average diameter (A) <strong>and</strong> height (B) for pin oak <strong>and</strong> pecan through 2007 with st<strong>and</strong>ard<br />
error bars. Pin oak is shown as the dark bars, pecan is shown in the light bars………………………...6<br />
Figure 8. (A) Percent increase of pin oak diameter for each growing season. (B) Percent increase<br />
of pin oak height for each growing season. (C) Percent increase of pecan diameter for each growing<br />
season. (D) Percent increase of pecan height for each growing season. St<strong>and</strong>ard error of the mean<br />
represented by the bars on each data point……………………………………………………………....6<br />
Figure 9. RPM ® seedlings after two years of growth…………………………………………………..7<br />
Figure 10. RPM ® seedling……………………………………………………………………………...8<br />
Figure 11. Mounded RPM ® seedlings………………………………………………………………….9<br />
Figure 12. Implementation of mounds for RPM ® seedlings at Four Rivers Conservation Area……...10<br />
Figure 13. Direct seeding of acorns at Four Rivers Conservation Area……………………………….11<br />
Figure 14. Bare root seedling planted at Four Rivers Conservation Area……………………………..11<br />
Figure 15. Pin oak RPM ® planted on mounded soil at Four Rivers Conservation Area……………...12<br />
vi


