1 Excel functions =NORMSDIST( z value) =NORMSINV ( probability ...
1 Excel functions =NORMSDIST( z value) =NORMSINV ( probability ...
1 Excel functions =NORMSDIST( z value) =NORMSINV ( probability ...

You also want an ePaper? Increase the reach of your titles
YUMPU automatically turns print PDFs into web optimized ePapers that Google loves.
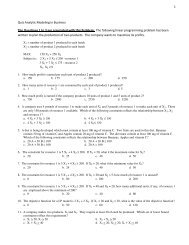
convenience, there is also a column recording whether a student lost weight (0 = “no weight<br />
lost”, 1 = “some weight lost”).<br />
The pulled records reveal that only 24 on the 40 graduates achieved any weight loss during<br />
the month. That means that only 60% of the records pulled demonstrate any weight loss. The<br />
question you must now consider is: is this evidence strong enough to justify an accusation of<br />
false advertising by Beautiful U?<br />
THE QUESTION:<br />
Suppose that the average weight lost by a student in the program is 5 pounds, with a<br />
standard deviation of 20 pounds. How likely is it that the average weight loss in a<br />
random sample of 40 students will be 8.45 pounds or more?<br />
4. Our task to find the <strong>probability</strong> that something is greater than or equal to 8.45. What is that “something”?<br />
a) z b) σ c) s d) µ e) x (x-bar)<br />
5. Our sample size is 40, so we’ll be able to apply our 191 techniques to answer THE QUESTION. This is<br />
because the histogram of a 40 student sample suggests that the population is<br />
a) perfectly normal b) roughly normal c) roughly symmetric d) roughly binomial e) bimodal<br />
6. Question #2 says that “we’ll be able to apply our 191 techniques to answer THE QUESTION”. This is<br />
because the observation that we made in Question #2 allows us to conclude that<br />
a). the population is approximately normal<br />
b). µ is approximately normal<br />
c). the sampling distribution of the mean is approximately normal<br />
d). s is a good approximation for σ<br />
e). µ is a good approximation for x .<br />
7. To answer THE QUESTION, we need to find<br />
the standard deviation of the sampling<br />
distribution of the mean. It is equal to<br />
a). 20<br />
b). 20/40 = 0.5<br />
c). (8.45 - 5)/20 = 0.1725<br />
d). SQRT(8.45 × (20 – 8.45)/40) = 1.562<br />
e). 20/SQRT(40) = 3.162<br />
2<br />
8. We also need to know the mean of the<br />
sampling distribution of the mean. In this<br />
problem, this is<br />
a). <strong>=NORMSINV</strong>(0.1725) = -0.9443<br />
b). <strong>=NORMSINV</strong>(1-0.1725) = 0.9443<br />
c). 5<br />
d). =SQRT(40) = 6.325<br />
e). 8.45<br />
9. Which calculation would give the <strong>probability</strong> that one student chosen at random from the Beautiful U<br />
graduates would have lost 8.45 pounds or more? (Assume, for this problem only, that weight loss is<br />
normally distributed.)<br />
a). = NORMDIST( 5, 8.45, 20, TRUE)<br />
b). = NORMDIST( 5, 8.45, 3.162, TRUE)<br />
c). = NORMDIST( 8.45, 5, 20, TRUE)<br />
d). =1 - NORMDIST( 8.45, 5, 20, TRUE)<br />
e). =1 - NORMDIST( 8.45, 5, 3.162, TRUE)<br />
10. Suppose that the answer to THE QUESTION is 0.1376. What does this mean?<br />
a). About 14% of all Beautiful U students lose 5 pounds or more.<br />
b). About 14% of all Beautiful U students lose 8.45 pounds or more.<br />
c). About 14% of the students in a sample of 40 students would be expected to lose 5 pounds or more.<br />
d). About 14% of the students in a sample of 40 students would be expected to lose 8.45 pounds or more.<br />
e). None of these interpretations is correct.