Energy and Water Performance Benchmarking in the Retail Sector ...
Energy and Water Performance Benchmarking in the Retail Sector ...
Energy and Water Performance Benchmarking in the Retail Sector ...

Create successful ePaper yourself
Turn your PDF publications into a flip-book with our unique Google optimized e-Paper software.
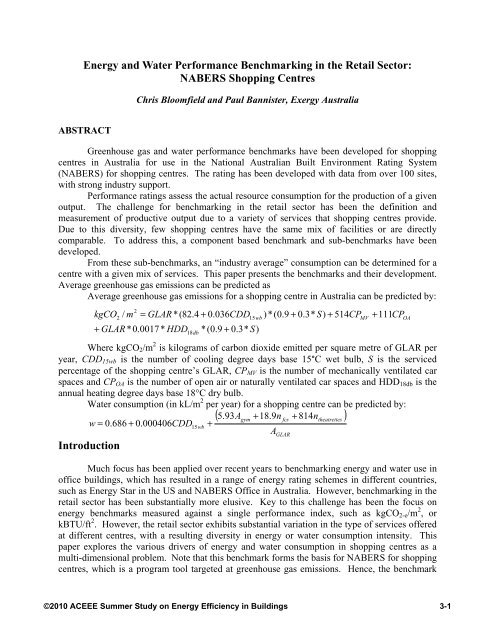
<strong>Energy</strong> <strong>and</strong> <strong>Water</strong> <strong>Performance</strong> <strong>Benchmark<strong>in</strong>g</strong> <strong>in</strong> <strong>the</strong> <strong>Retail</strong> <strong>Sector</strong>:<br />
NABERS Shopp<strong>in</strong>g Centres<br />
ABSTRACT<br />
Chris Bloomfield <strong>and</strong> Paul Bannister, Exergy Australia<br />
Greenhouse gas <strong>and</strong> water performance benchmarks have been developed for shopp<strong>in</strong>g<br />
centres <strong>in</strong> Australia for use <strong>in</strong> <strong>the</strong> National Australian Built Environment Rat<strong>in</strong>g System<br />
(NABERS) for shopp<strong>in</strong>g centres. The rat<strong>in</strong>g has been developed with data from over 100 sites,<br />
with strong <strong>in</strong>dustry support.<br />
<strong>Performance</strong> rat<strong>in</strong>gs assess <strong>the</strong> actual resource consumption for <strong>the</strong> production of a given<br />
output. The challenge for benchmark<strong>in</strong>g <strong>in</strong> <strong>the</strong> retail sector has been <strong>the</strong> def<strong>in</strong>ition <strong>and</strong><br />
measurement of productive output due to a variety of services that shopp<strong>in</strong>g centres provide.<br />
Due to this diversity, few shopp<strong>in</strong>g centres have <strong>the</strong> same mix of facilities or are directly<br />
comparable. To address this, a component based benchmark <strong>and</strong> sub-benchmarks have been<br />
developed.<br />
From <strong>the</strong>se sub-benchmarks, an “<strong>in</strong>dustry average” consumption can be determ<strong>in</strong>ed for a<br />
centre with a given mix of services. This paper presents <strong>the</strong> benchmarks <strong>and</strong> <strong>the</strong>ir development.<br />
Average greenhouse gas emissions can be predicted as<br />
Average greenhouse gas emissions for a shopp<strong>in</strong>g centre <strong>in</strong> Australia can be predicted by:<br />
2<br />
kgCO2<br />
/ m = GLAR * ( 82.<br />
4 + 0.<br />
036CDD15wb<br />
) * ( 0.<br />
9 +<br />
+ GLAR * 0.<br />
0017*<br />
HDD * ( 0.<br />
9 + 0.<br />
3*<br />
S)<br />
18db<br />
0.<br />
3*<br />
S)<br />
+ 514CP<br />
MV<br />
+ 111CP<br />
Where kgCO2/m 2 is kilograms of carbon dioxide emitted per square metre of GLAR per<br />
year, CDD15wb is <strong>the</strong> number of cool<strong>in</strong>g degree days base 15°C wet bulb, S is <strong>the</strong> serviced<br />
percentage of <strong>the</strong> shopp<strong>in</strong>g centre’s GLAR, CPMV is <strong>the</strong> number of mechanically ventilated car<br />
spaces <strong>and</strong> CPOA is <strong>the</strong> number of open air or naturally ventilated car spaces <strong>and</strong> HDD18db is <strong>the</strong><br />
annual heat<strong>in</strong>g degree days base 18°C dry bulb.<br />
<strong>Water</strong> consumption (<strong>in</strong> kL/m 2 per year) for a shopp<strong>in</strong>g centre can be predicted by:<br />
( 5.<br />
93Agym<br />
+ 18.<br />
9n<br />
fcs + 814n<strong>the</strong>atrettes<br />
)<br />
w = 0. 686 + 0.<br />
000406CDD15wb<br />
+<br />
AGLAR<br />
Introduction<br />
Much focus has been applied over recent years to benchmark<strong>in</strong>g energy <strong>and</strong> water use <strong>in</strong><br />
office build<strong>in</strong>gs, which has resulted <strong>in</strong> a range of energy rat<strong>in</strong>g schemes <strong>in</strong> different countries,<br />
such as <strong>Energy</strong> Star <strong>in</strong> <strong>the</strong> US <strong>and</strong> NABERS Office <strong>in</strong> Australia. However, benchmark<strong>in</strong>g <strong>in</strong> <strong>the</strong><br />
retail sector has been substantially more elusive. Key to this challenge has been <strong>the</strong> focus on<br />
energy benchmarks measured aga<strong>in</strong>st a s<strong>in</strong>gle performance <strong>in</strong>dex, such as kgCO2-e/m 2 , or<br />
kBTU/ft 2 . However, <strong>the</strong> retail sector exhibits substantial variation <strong>in</strong> <strong>the</strong> type of services offered<br />
at different centres, with a result<strong>in</strong>g diversity <strong>in</strong> energy or water consumption <strong>in</strong>tensity. This<br />
paper explores <strong>the</strong> various drivers of energy <strong>and</strong> water consumption <strong>in</strong> shopp<strong>in</strong>g centres as a<br />
multi-dimensional problem. Note that this benchmark forms <strong>the</strong> basis for NABERS for shopp<strong>in</strong>g<br />
centres, which is a program tool targeted at greenhouse gas emissions. Hence, <strong>the</strong> benchmark<br />
©2010 ACEEE Summer Study on <strong>Energy</strong> Efficiency <strong>in</strong> Build<strong>in</strong>gs<br />
OA<br />
3-1
outcomes are targeted at greenhouse emissions, but can equally translate to energy consumption.<br />
Certa<strong>in</strong>ly, <strong>in</strong> <strong>the</strong> Australian market, <strong>the</strong> ratio of greenhouse emissions between electricity <strong>and</strong><br />
natural gas (0.94:0.21kgCO2-e/kWh) is similar to <strong>the</strong> ratio of <strong>the</strong>ir typical costs<br />
($0.15:$0.04/kWh), mak<strong>in</strong>g this benchmark relevant for both emissions <strong>and</strong> energy cost.<br />
Key to this paper are <strong>the</strong> boundaries of a shopp<strong>in</strong>g centre. Initially, <strong>the</strong> study was aimed<br />
at <strong>the</strong> total retail sector. However, through early rounds of analysis, it was found that <strong>the</strong>re was<br />
too much diversity <strong>in</strong> tenant <strong>in</strong>stallations <strong>and</strong> usage patterns between different tenant types, such<br />
as supermarkets, department stores, <strong>and</strong> specialty stores. Fur<strong>the</strong>rmore, while water is typically<br />
metered through a master meter for each site, electricity is typically metered direct from <strong>the</strong><br />
electricity retailer to <strong>the</strong> tenants, which makes <strong>the</strong> collection of this data more challeng<strong>in</strong>g due to<br />
<strong>the</strong> substantially <strong>in</strong>creased numbers of survey respondents. <strong>Benchmark<strong>in</strong>g</strong> of energy use with<strong>in</strong><br />
<strong>the</strong> tenanted spaces is an ongo<strong>in</strong>g area of research for this project. The results with<strong>in</strong> this paper<br />
refer to <strong>the</strong> entire site consumption for water benchmark<strong>in</strong>g, but only to <strong>the</strong> “base build<strong>in</strong>g” or<br />
l<strong>and</strong>lord services with<strong>in</strong> shopp<strong>in</strong>g centres for greenhouse benchmark<strong>in</strong>g.<br />
Background on NABERS, <strong>and</strong> <strong>the</strong> Context for this Study<br />
NABERS (www.nabers.com.au) is a performance rat<strong>in</strong>g scheme – <strong>in</strong> simple terms,<br />
measur<strong>in</strong>g actual production aga<strong>in</strong>st actual resource consumption <strong>and</strong> rank<strong>in</strong>g it aga<strong>in</strong>st average<br />
performance <strong>in</strong> <strong>the</strong> market. It is expressed as a 0-5 star scale, <strong>in</strong> half star <strong>in</strong>crements. 2.5 stars<br />
represents average performance <strong>in</strong> <strong>the</strong> <strong>in</strong>dustry, while 5 stars represents an aspirational level of<br />
achievement, beyond what is be<strong>in</strong>g delivered by <strong>in</strong>dustry at <strong>the</strong> time <strong>the</strong> rat<strong>in</strong>g b<strong>and</strong>s are<br />
constructed. Typically, 5 stars represents a reduction <strong>in</strong> resource usage of 60% from average, but<br />
varies slightly between build<strong>in</strong>g types. Key to <strong>in</strong>terpret<strong>in</strong>g NABERS rat<strong>in</strong>gs is that it is based<br />
upon real, measured performance, ra<strong>the</strong>r than predicted or simulated performance. The<br />
experience <strong>in</strong> Australia over <strong>the</strong> last 10 years has shown that <strong>the</strong>re is a non trivial gap between<br />
predicted performance <strong>and</strong> achieved performance (Bannister, 2009).<br />
Australia has had office energy performance rat<strong>in</strong>gs available for over 10 years. Rat<strong>in</strong>gs<br />
were available under <strong>the</strong> Australian Build<strong>in</strong>g Greenhouse Rat<strong>in</strong>g (ABGR) scheme, which was<br />
later absorbed <strong>in</strong>to <strong>the</strong> National Australian Built Environment Rat<strong>in</strong>g Scheme (NABERS), as<br />
o<strong>the</strong>r performance rat<strong>in</strong>gs were released. Currently <strong>the</strong> NABERS program <strong>in</strong>cludes energy,<br />
water, waste <strong>and</strong> <strong>in</strong>door environment rat<strong>in</strong>gs for office build<strong>in</strong>gs, energy <strong>and</strong> water rat<strong>in</strong>gs for<br />
hotels, shopp<strong>in</strong>g centres, houses <strong>and</strong> hospitals, with rat<strong>in</strong>gs for schools <strong>and</strong> data centres currently<br />
under development. The data <strong>and</strong> benchmarks with<strong>in</strong> this paper formed <strong>the</strong> basis for NABERS<br />
for Shopp<strong>in</strong>g Centres.<br />
NABERS has been widely accepted with<strong>in</strong> <strong>the</strong> office market, with over 60% of <strong>the</strong> total<br />
floor area <strong>in</strong> Australia hav<strong>in</strong>g been assessed at least once (DECCW, 2009). NABERS has had a<br />
significant impact on <strong>the</strong> Australian market, with it now be<strong>in</strong>g l<strong>in</strong>ked to rental premiums, longer<br />
leases <strong>and</strong> rental reviews through green leases (DECCW, 2009). Dem<strong>and</strong> from tenants has<br />
generated a substantial premium for build<strong>in</strong>gs operat<strong>in</strong>g at 4.5 or 5 stars, with this dem<strong>and</strong> (<strong>and</strong><br />
contract risk) be<strong>in</strong>g passed on to developers <strong>and</strong> design teams.<br />
The prevalence of NABERS rat<strong>in</strong>gs <strong>in</strong> <strong>the</strong> office environment is highlighted by <strong>the</strong><br />
proposed m<strong>and</strong>atory disclosure legislation currently before parliament (DEWHA, 2009). This<br />
legislation requires <strong>the</strong> disclosure of actual energy performance over <strong>the</strong> last 12 months for office<br />
build<strong>in</strong>gs of greater than 2000m 2 (22,000ft 2 ) net lettable area at key po<strong>in</strong>ts <strong>in</strong> <strong>the</strong>ir life cycle,<br />
©2010 ACEEE Summer Study on <strong>Energy</strong> Efficiency <strong>in</strong> Build<strong>in</strong>gs<br />
3-2
such as build<strong>in</strong>g sale <strong>and</strong> sign<strong>in</strong>g of new leases over 2000m 2 . The <strong>in</strong>troduction of m<strong>and</strong>atory<br />
disclosure to o<strong>the</strong>r build<strong>in</strong>g classes, such as hotels <strong>and</strong> shopp<strong>in</strong>g centres is proposed for 2012.<br />
The purpose of this study is to develop predictive performance benchmarks for<br />
greenhouse emissions <strong>and</strong> water consumption for a shopp<strong>in</strong>g centre with a given set of<br />
consumption drivers, to allow a build<strong>in</strong>gs performance to be assessed aga<strong>in</strong>st <strong>the</strong> performance of<br />
its peers.<br />
Data Collected<br />
Data was collected from <strong>the</strong> Australian shopp<strong>in</strong>g centre <strong>in</strong>dustry via a voluntary survey<br />
process. To assist <strong>in</strong> this process, a technical advisory group (TAG) was formed. Included<br />
with<strong>in</strong> <strong>the</strong> TAG members were 8 of <strong>the</strong> largest shopp<strong>in</strong>g centre owners <strong>in</strong> Australia, <strong>and</strong><br />
representatives of <strong>the</strong> major supermarket <strong>and</strong> department store cha<strong>in</strong>s.<br />
The benchmark development <strong>and</strong> data collection were an iterative process, with early<br />
rounds of benchmark<strong>in</strong>g <strong>in</strong>dicat<strong>in</strong>g areas where <strong>the</strong> collected data was <strong>in</strong>sufficient. A number of<br />
data collection phases were conducted to obta<strong>in</strong> sufficient data to develop <strong>the</strong> rat<strong>in</strong>g system.<br />
Distribution of surveys was predom<strong>in</strong>antly through <strong>the</strong> TAG members, with some o<strong>the</strong>r<br />
participants <strong>in</strong>vited on an <strong>in</strong>dividual basis.<br />
Survey forms requested a broad range of qualitative <strong>and</strong> quantitative <strong>in</strong>formation from<br />
shopp<strong>in</strong>g centres, to help determ<strong>in</strong>e <strong>the</strong> empirical relationships between shopp<strong>in</strong>g centre<br />
background parameters <strong>and</strong> greenhouse emissions or water consumption.<br />
Data collection occurred <strong>in</strong> three ma<strong>in</strong> phases:<br />
• Initial data collection – conducted by <strong>the</strong> New South Wales Department of Environment,<br />
Climate Change <strong>and</strong> <strong>Water</strong> <strong>in</strong> 2005;<br />
• Ma<strong>in</strong> round of data collection – exp<strong>and</strong>ed with specific questions on issues such as<br />
servic<strong>in</strong>g of tenants. Commenced <strong>in</strong> 2008;<br />
• Supplementary survey – sub-meter<strong>in</strong>g data (car parks <strong>and</strong> common area), more details on<br />
gyms <strong>and</strong> c<strong>in</strong>emas. Commenced <strong>in</strong> late 2008.<br />
With<strong>in</strong> each round of data collection, <strong>the</strong>re were numerous liaisons with property owner<br />
<strong>and</strong> management groups to obta<strong>in</strong> responses. In some cases, multiple requests <strong>and</strong> one on one<br />
sessions were required to obta<strong>in</strong> complete <strong>in</strong>formation.<br />
Data Responses<br />
The <strong>in</strong>tent of <strong>the</strong> survey was to collect a representative sample of Australian shopp<strong>in</strong>g<br />
centres upon which to base <strong>the</strong> analysis. Critical to this is achiev<strong>in</strong>g a suitable coverage <strong>and</strong><br />
diversity of <strong>the</strong> dist<strong>in</strong>guish<strong>in</strong>g parameters for shopp<strong>in</strong>g centre function. In particular, it was<br />
critical to have a suitable distribution across:<br />
• Shopp<strong>in</strong>g centre sizes;<br />
• Tenancy sizes <strong>and</strong> types, such as supermarkets, gyms, c<strong>in</strong>emas, food courts <strong>and</strong> large <strong>and</strong><br />
small retailers;<br />
• Car park<strong>in</strong>g facilities – <strong>in</strong>clud<strong>in</strong>g both centres with mechanically ventilated <strong>and</strong> naturally<br />
ventilated/open air car parks;<br />
©2010 ACEEE Summer Study on <strong>Energy</strong> Efficiency <strong>in</strong> Build<strong>in</strong>gs<br />
3-3
• Geographic distribution (for climatic impacts);<br />
• Servic<strong>in</strong>g of tenancies.<br />
A total of 103 survey responses were received. Of <strong>the</strong>se, 65 were used for greenhouse<br />
gas benchmark<strong>in</strong>g, <strong>and</strong> 74 for water benchmark<strong>in</strong>g. The responses from some sites were too<br />
<strong>in</strong>complete, or implausible to be useful, so were excluded. Note that some sites were only able<br />
to provide energy data or water data, so may not appear <strong>in</strong> both energy <strong>and</strong> water samples.<br />
Responses were received from shopp<strong>in</strong>g centres vary<strong>in</strong>g <strong>in</strong> size from 4000m 2 (Gross<br />
Lettable Area <strong>Retail</strong> (GLAR), i.e. <strong>the</strong> tenanted space) to a maximum of 160,000m 2 , although<br />
only centres with a GLAR of greater than 15,000m 2 were used <strong>in</strong> <strong>the</strong> analyses.<br />
Shopp<strong>in</strong>g centres of less than 15,000m 2 of GLAR were shown to have substantially<br />
different energy consumption characteristics than for centres with GLAR of greater than<br />
15,000m 2 . This is largely because <strong>the</strong> type of tenant mix, <strong>and</strong> <strong>the</strong> quantity of services provided<br />
at very small centres differ from that of larger centres. The distribution of residuals (<strong>the</strong><br />
difference between actual <strong>and</strong> predicted energy consumption) from <strong>the</strong> analysis of <strong>the</strong> whole data<br />
set is shown Table 2. The plot demonstrates <strong>the</strong> distributional differences between sub 15,000m 2<br />
build<strong>in</strong>gs <strong>and</strong> <strong>the</strong> rema<strong>in</strong>der of <strong>the</strong> shopp<strong>in</strong>g centres tested. Smaller centres perform<br />
disproportionately well, due to lack of common areas, <strong>and</strong> o<strong>the</strong>r services provided to shoppers.<br />
With <strong>the</strong> exception of three sites which provided car park sub-meter<strong>in</strong>g data, <strong>the</strong>se centres were<br />
excluded from <strong>the</strong> benchmark development.<br />
<strong>Energy</strong> <strong>Benchmark<strong>in</strong>g</strong><br />
Figure 1. Distribution of Residuals <strong>and</strong> Centre Size (GLAR)<br />
Shopp<strong>in</strong>g centres are diverse <strong>in</strong> <strong>the</strong> types of services offered to <strong>the</strong>ir tenants. This can<br />
pose a challenge to <strong>the</strong> creation of fair <strong>and</strong> relevant benchmarks, as few shopp<strong>in</strong>g centres are<br />
directly comparable or have <strong>the</strong> same mix of services. Two methodologies were considered for<br />
this study:<br />
• Multiple regression of all parameters<br />
• A model built up from a number of sub-benchmarks<br />
©2010 ACEEE Summer Study on <strong>Energy</strong> Efficiency <strong>in</strong> Build<strong>in</strong>gs<br />
3-4
Many benchmark<strong>in</strong>g tools (such as <strong>Energy</strong> Star) have been based upon multiple regression<br />
models. However, this type of model presented two key challenges for <strong>the</strong> data <strong>in</strong> this sample,<br />
be<strong>in</strong>g:<br />
• Completion of data. Many survey respondents did not, or were not able to answer<br />
particular questions <strong>in</strong> <strong>the</strong> survey. Multiple regression with data cover<strong>in</strong>g different<br />
responses can lead to spurious results.<br />
• Cross correlation of parameters. Climate data <strong>in</strong> particular is <strong>in</strong>versely correlated. A site<br />
with high heat<strong>in</strong>g degree days will have low cool<strong>in</strong>g degree days. But sites at ei<strong>the</strong>r<br />
extreme will have <strong>in</strong>creased energy consumption. Multiple regression can result <strong>in</strong><br />
spurious results with highly correlated parameters.<br />
Hence <strong>the</strong> method of benchmark<strong>in</strong>g shopp<strong>in</strong>g centre consumption has been based upon<br />
<strong>the</strong> build-up of sub benchmarks for each of <strong>the</strong> major drivers for energy consumption which<br />
warrant correction. For example, a shopp<strong>in</strong>g centre <strong>in</strong> Sydney that provides full HVAC<br />
servic<strong>in</strong>g to its tenants <strong>and</strong> has a car park will have sub-benchmarks for consumption due to its<br />
size, climate, tenant servic<strong>in</strong>g <strong>and</strong> car park. The benchmark for this centre would be different to<br />
shopp<strong>in</strong>g centre with a similar size, but <strong>in</strong> a different location, with no tenant servic<strong>in</strong>g <strong>and</strong><br />
without a car park. This can <strong>the</strong>n be used to assess an <strong>in</strong>dividual site, by compar<strong>in</strong>g its actual<br />
measured consumption <strong>and</strong> measured production aga<strong>in</strong>st <strong>the</strong> modeled energy consumption for a<br />
centre with <strong>the</strong> same facilities.<br />
Calculation of a Site’s Actual Greenhouse Emissions<br />
The greenhouse <strong>in</strong>tensities of different fuel types used by <strong>the</strong> shopp<strong>in</strong>g centres are based<br />
on <strong>the</strong> Australian Greenhouse Office’s (AGO) “Factors <strong>and</strong> Methods Workbook 2008”<br />
(DEWHA 2009). These are full fuel cycle emissions, <strong>and</strong> due to <strong>the</strong> prevalence of coal <strong>in</strong><br />
Australia’s electricity generation, are high by <strong>in</strong>ternational st<strong>and</strong>ards, with an average of<br />
approximately 1.06 kgCO2-e/kWh (SGEe) for electricity, <strong>and</strong> 0.066 kgCO2-e/MJ (SGEg) for<br />
natural gas, <strong>and</strong> 2.89 kgCO2-e/litre (SGEd) of Diesel. Emissions coefficients vary from state to<br />
state with<strong>in</strong> <strong>the</strong> country, with state specific quantities used with<strong>in</strong> <strong>the</strong> study.<br />
The actual greenhouse gas emissions per m 2 of GLAR were calculated based upon:<br />
Actual<br />
Site Production Metrics<br />
SGE<br />
× electricity(kWh)<br />
+ SGEg<br />
× gas(MJ) + SGE<br />
GLAR(<br />
m )<br />
e<br />
_ emissions =<br />
2<br />
d<br />
× diesel(l)<br />
<strong>Performance</strong> benchmarks are to allow <strong>the</strong> comparison of site consumption between sites<br />
offer<strong>in</strong>g different types <strong>and</strong> quantities of production. As <strong>the</strong> primary “production” of shopp<strong>in</strong>g<br />
centre owners is leas<strong>in</strong>g retail space, <strong>the</strong> quantity of retail space is of first order importance.<br />
©2010 ACEEE Summer Study on <strong>Energy</strong> Efficiency <strong>in</strong> Build<strong>in</strong>gs<br />
3-5
Size Metrics<br />
A number of energy use drivers are related to <strong>the</strong> size of <strong>the</strong> shopp<strong>in</strong>g centre, such as air<br />
condition<strong>in</strong>g <strong>and</strong> light<strong>in</strong>g loads. For <strong>the</strong> majority of shopp<strong>in</strong>g centres, shopp<strong>in</strong>g centre size is<br />
determ<strong>in</strong>ed by a comb<strong>in</strong>ation of <strong>the</strong> common area <strong>and</strong> <strong>the</strong> area that can be leased to tenants<br />
(GLAR).<br />
<strong>Energy</strong> consumption is likely to be driven by <strong>the</strong> comb<strong>in</strong>ation of <strong>the</strong>se two parameters.<br />
However, <strong>the</strong>re are some significant differences between <strong>the</strong>m, be<strong>in</strong>g:<br />
• Quality <strong>and</strong> transparency of data. GLAR is a commercial quantity – it is <strong>the</strong> primary unit<br />
<strong>in</strong> which tenants are billed. It has a third party st<strong>and</strong>ard of assessment, <strong>and</strong> is used <strong>in</strong><br />
substantial f<strong>in</strong>ancial transactions.<br />
• Availability of data. All sites were able to report on GLAR with certa<strong>in</strong>ty. However,<br />
only a subset of sites were able to report common area, with variation <strong>in</strong> <strong>the</strong> def<strong>in</strong>ition of<br />
common area. The <strong>in</strong>consistency <strong>in</strong> assessment, <strong>and</strong> <strong>the</strong> lack of exist<strong>in</strong>g data makes it a<br />
poor choice for a benchmark parameter<br />
• Productivity. GLAR is a commodity that is directly dem<strong>and</strong>ed by <strong>the</strong> build<strong>in</strong>g users<br />
(tenants), <strong>and</strong> directly used for <strong>the</strong>ir “production”. Common area is required to facilitate<br />
this production, but not directly “sold” to tenants.<br />
GLAR, or lettable (leasable) area can be shown to have a significant relationship to<br />
energy consumption, with emissions density fall<strong>in</strong>g <strong>in</strong>to a typically Poissonian distribution. The<br />
Poissionian distribution means that st<strong>and</strong>ard statistical tests may result <strong>in</strong> spurious conclusions,<br />
as <strong>the</strong> distribution is far from a normal distribution, with an extended tail. This extended tail <strong>in</strong><br />
<strong>the</strong> distribution is because <strong>the</strong>re is a physical limit to how low consumption can go (zero), but no<br />
physical limit to how high consumption can go.<br />
Figure 2. Distribution of Emissions Density for All Completed Surveys<br />
©2010 ACEEE Summer Study on <strong>Energy</strong> Efficiency <strong>in</strong> Build<strong>in</strong>gs<br />
3-6
Greenhouse Emissions – O<strong>the</strong>r Empirical Relationships<br />
The statistical relationships of greenhouse emissions <strong>and</strong> drivers of greenhouse emissions<br />
with<strong>in</strong> shopp<strong>in</strong>g centres are complex <strong>and</strong> difficult to display for an <strong>in</strong>dividual greenhouse driver.<br />
This is because <strong>the</strong> first order impact changes from site to site. For example for one site tenanted<br />
area may be <strong>the</strong> primary driver, with <strong>the</strong> provision of car park<strong>in</strong>g be<strong>in</strong>g a secondary driver.<br />
Whereas for ano<strong>the</strong>r site, with a far higher provision of car park<strong>in</strong>g, <strong>and</strong> <strong>the</strong> provision of car<br />
park<strong>in</strong>g for non-retail purposes, <strong>the</strong> car park<strong>in</strong>g may be <strong>the</strong> first order driver of consumption.<br />
This mix of first <strong>and</strong> second order impacts means that <strong>the</strong> net impact across all <strong>the</strong> population<br />
only becomes apparent when a multi-dimensional analysis is undertaken.<br />
Climate<br />
Australia encompasses a diverse range of climates, from cool temperate conditions <strong>in</strong> <strong>the</strong><br />
south, to highly arid climates <strong>in</strong> <strong>the</strong> centre, <strong>and</strong> <strong>the</strong> tropics <strong>in</strong> <strong>the</strong> north. This provides a<br />
challenge for energy rat<strong>in</strong>gs, as <strong>the</strong> <strong>the</strong>rmal loads <strong>in</strong> <strong>the</strong>se areas varies substantially.<br />
Climate presents a challenge to correct empirically, as both heat<strong>in</strong>g <strong>and</strong> cool<strong>in</strong>g<br />
requirements can impact upon greenhouse gas emissions. Hence, <strong>the</strong> empirical correlation of<br />
greenhouse gas emissions <strong>and</strong> ei<strong>the</strong>r heat<strong>in</strong>g or cool<strong>in</strong>g degree days can be complex – high<br />
heat<strong>in</strong>g sites have comparatively high greenhouse emissions, temperate sites have comparatively<br />
low emissions, <strong>and</strong> high cool<strong>in</strong>g sites have comparatively high emissions.<br />
Climate driven heat<strong>in</strong>g loads. In <strong>the</strong> shopp<strong>in</strong>g centres <strong>in</strong> <strong>the</strong> sample, <strong>the</strong> majority of sites<br />
with<strong>in</strong> temperate <strong>and</strong> cold areas use natural gas for space heat<strong>in</strong>g, with relatively few sites <strong>in</strong><br />
climates with significant heat<strong>in</strong>g loads us<strong>in</strong>g electric fuelled heat<strong>in</strong>g. Because of this separation,<br />
<strong>the</strong>re is potential to separately benchmark heat<strong>in</strong>g aga<strong>in</strong>st natural gas consumption.<br />
Use of this approach avoids <strong>the</strong> potentially spurious results from regress<strong>in</strong>g with <strong>in</strong>versely<br />
correlated parameters.<br />
The quantity of heat<strong>in</strong>g required by a site is a function of both <strong>the</strong> magnitude (how cold),<br />
<strong>and</strong> <strong>the</strong> duration of heat<strong>in</strong>g load. To benchmark aga<strong>in</strong>st a comb<strong>in</strong>ation of <strong>the</strong>se metrics, <strong>the</strong><br />
heat<strong>in</strong>g degree day has been used, with a base of 18°C dry bulb (HDD18ºDB). Heat<strong>in</strong>g degree day<br />
data has been based upon data provided by <strong>the</strong> Bureau of Meteorology.<br />
Natural Gas Regression Model<br />
Figure 3 shows <strong>the</strong> correlation between average natural gas consumption <strong>and</strong> climate<br />
driven heat<strong>in</strong>g loads (<strong>in</strong> heat<strong>in</strong>g degree days) for each of <strong>the</strong> shopp<strong>in</strong>g centres which reported<br />
<strong>the</strong>ir natural gas consumption. Note <strong>the</strong> red (square) po<strong>in</strong>ts represent <strong>the</strong> averages of <strong>the</strong> centres<br />
<strong>in</strong> each climate zone, which help to remove <strong>the</strong> visual effect of outliers. An averag<strong>in</strong>g approach<br />
has been used to remove <strong>the</strong> bias imposed by large numbers of samples <strong>in</strong> some locations.<br />
A s<strong>in</strong>gle variable, ord<strong>in</strong>ary least squares regression was used to evaluate <strong>the</strong> relationship<br />
between <strong>the</strong> heat<strong>in</strong>g load of <strong>the</strong> shopp<strong>in</strong>g centres <strong>and</strong> actual natural gas consumption. Natural gas<br />
consumption data obta<strong>in</strong>ed dur<strong>in</strong>g <strong>the</strong> survey process was only available for 30 of <strong>the</strong> build<strong>in</strong>gs<br />
<strong>and</strong> conta<strong>in</strong>ed a significant level of variability. Hence, <strong>the</strong> data was not able to support a<br />
statistically significant conclusion. However, <strong>the</strong> relationship suggested by <strong>the</strong> regression of<br />
©2010 ACEEE Summer Study on <strong>Energy</strong> Efficiency <strong>in</strong> Build<strong>in</strong>gs<br />
3-7
averages for each climate group, provides a reasonable best estimate of <strong>the</strong> effect of climate<br />
based heat<strong>in</strong>g loads on natural gas consumption.<br />
Figure 3. Natural Gas Emissions <strong>and</strong> Heat<strong>in</strong>g Load. Squares Indicate Climate Zone<br />
Averages<br />
The correction for greenhouse gas emissions due to climate based heat<strong>in</strong>g loads is<br />
<strong>the</strong>refore:<br />
G = 0 . 0017 × HDD o<br />
Gas<br />
18 DB<br />
Where GGas is <strong>the</strong> natural gas correction <strong>in</strong> kg of CO2 emitted per m 2 of GLAR per annum<br />
<strong>and</strong> HDD18°DB is <strong>the</strong> annual heat<strong>in</strong>g degree days.<br />
There are o<strong>the</strong>r potential users of natural gas with<strong>in</strong> shopp<strong>in</strong>g centres, such as food courts<br />
<strong>and</strong> domestic hot water production. However, as <strong>the</strong>se emissions are likely to be related to <strong>the</strong><br />
o<strong>the</strong>r benchmark parameters, <strong>the</strong>y have been <strong>in</strong>cluded <strong>in</strong> <strong>the</strong> general greenhouse model.<br />
General Greenhouse Model<br />
After apply<strong>in</strong>g <strong>the</strong> heat<strong>in</strong>g climate correction, <strong>and</strong> normaliz<strong>in</strong>g aga<strong>in</strong>st GLAR, <strong>the</strong><br />
residuals were tested aga<strong>in</strong>st a broad range of production metrics. Of those tested, cool<strong>in</strong>g load,<br />
<strong>the</strong> quantity of car park<strong>in</strong>g provided <strong>and</strong> <strong>the</strong> quantity of tenanted area that is air conditioned by<br />
<strong>the</strong> shopp<strong>in</strong>g centre owner were found to be substantiated energy drivers.<br />
Climate Driven Cool<strong>in</strong>g Loads<br />
The provision of space cool<strong>in</strong>g <strong>and</strong> HVAC services is a major end use of shopp<strong>in</strong>g centre<br />
electricity. However, only a portion of this is climate dependent. In order to fairly compare<br />
shopp<strong>in</strong>g centres <strong>in</strong> different climates, a correction for <strong>the</strong> climate dependant portion of <strong>the</strong> load<br />
is required.<br />
A useful metric for <strong>the</strong> magnitude <strong>and</strong> duration of cool<strong>in</strong>g loads is <strong>the</strong> number of cool<strong>in</strong>g<br />
degree days (CDD) <strong>in</strong> a year. For <strong>the</strong> purposes of this report <strong>and</strong> analysis, a base of 15ºC wet<br />
©2010 ACEEE Summer Study on <strong>Energy</strong> Efficiency <strong>in</strong> Build<strong>in</strong>gs<br />
3-8
ulb is used (CDD15ºWB), which will take <strong>in</strong>to account <strong>the</strong> latent <strong>and</strong> sensible cool<strong>in</strong>g loads.<br />
CDDs are an <strong>in</strong>tegral of <strong>the</strong> time (days) spent at temperatures above <strong>the</strong> base temperature. CDD<br />
values used <strong>in</strong> <strong>the</strong> analysis were provided by <strong>the</strong> Bureau of Meteorology for each climate zone.<br />
The correlation between CDD <strong>and</strong> average emissions per square metre for that climate<br />
zone is shown <strong>in</strong> figure 4:<br />
Figure 4. Cool<strong>in</strong>g <strong>and</strong> Emissions. Squares Indicate Averages for a Climate Zone<br />
The noise <strong>in</strong> <strong>the</strong> data is primarily due to <strong>the</strong> level of variation <strong>in</strong> greenhouse emissions<br />
from o<strong>the</strong>r energy drivers. The confidence level from <strong>the</strong> regression of emissions per m 2 of<br />
GLAR for each centre aga<strong>in</strong>st cool<strong>in</strong>g degree days was greater than 99%.<br />
The climate driven cool<strong>in</strong>g load correction used is:<br />
Gcool<strong>in</strong>g = 0. 036CDD15°<br />
wb * GLAR<br />
Table 1: Results from Regression of Climate Based Cool<strong>in</strong>g Loads (CDD15°wb) Aga<strong>in</strong>st<br />
Individual Centre’s Emissions<br />
Variable Coefficients P-value<br />
Intercept 82.39456 6.6301E-14<br />
CDD (<strong>in</strong>dividual<br />
centres)<br />
0.036107 0.00043992<br />
Car Park<strong>in</strong>g<br />
For many shopp<strong>in</strong>g centres, <strong>the</strong> provision of car park<strong>in</strong>g is an <strong>in</strong>tegral component of <strong>the</strong><br />
service provided by <strong>the</strong> centre. However, <strong>the</strong> quantity of car parks is not just related to <strong>the</strong><br />
shopp<strong>in</strong>g centre size. Some centres may have a higher or lower level of park<strong>in</strong>g associated with<br />
<strong>the</strong> centre due to zon<strong>in</strong>g or development approval requirements. This means that <strong>the</strong> number of<br />
car parks be<strong>in</strong>g provided is often outside <strong>the</strong> control of <strong>the</strong> shopp<strong>in</strong>g centre.<br />
Of <strong>the</strong> shopp<strong>in</strong>g centres surveyed, eight were able to provide sub-metered car park<br />
consumption data. Although <strong>the</strong> sample size is smaller than ideal, <strong>the</strong> data was sufficient to<br />
support statistically significant correlations between <strong>the</strong> number of mechanically ventilated <strong>and</strong><br />
naturally ventilated or open air car spaces on <strong>the</strong> car park’s electrical consumption.<br />
©2010 ACEEE Summer Study on <strong>Energy</strong> Efficiency <strong>in</strong> Build<strong>in</strong>gs<br />
3-9
The car park sub-meter<strong>in</strong>g data provided <strong>in</strong>cluded <strong>the</strong> total electricity consumption of <strong>the</strong><br />
car park, <strong>the</strong> operational hours of <strong>the</strong> car parks <strong>and</strong> <strong>the</strong> number of spaces of each type. The<br />
operational hours <strong>and</strong> total consumption were used to produce an estimate of <strong>the</strong> electrical load<br />
of each car park (<strong>in</strong> kW). Tests for <strong>the</strong> effect of each car park type on <strong>the</strong> electrical load were run<br />
aga<strong>in</strong>st this total electrical load figure.<br />
The results of a regression run on <strong>the</strong> effect of <strong>the</strong> number of each type of car space on<br />
<strong>the</strong> shopp<strong>in</strong>g centre’s emissions is outl<strong>in</strong>ed <strong>in</strong> Table 2. The confidence level for <strong>the</strong> comb<strong>in</strong>ed<br />
effects of each type of car park was greater than 99% for <strong>the</strong> 8 sites used. However this<br />
confidence drops substantially when this is applied across <strong>the</strong> general shopp<strong>in</strong>g centre<br />
population.<br />
Table 2: Car Park Correction Figures<br />
kW per<br />
Space<br />
P-value<br />
kWh per Space per Year<br />
(based on 70 hours per<br />
week)<br />
kgCO2 per<br />
Space per Year<br />
Mechanically Ventilated 0.13286 0.000169 485 514<br />
Open Air or Naturally<br />
Ventilated<br />
0.02884 0.024585 105 111<br />
In <strong>the</strong> data provided, <strong>the</strong>re was a small degree of diversity <strong>in</strong> <strong>the</strong> open<strong>in</strong>g hours of car<br />
parks. Because of <strong>the</strong> generally comparable operat<strong>in</strong>g hours, with an average of 70 hours per<br />
week, a fixed correction per car park has been developed:<br />
• 485 kWh (514 kgCO2) per mechanically ventilated space per year<br />
• 105 kWh (111 kgCO2) per open air or naturally ventilated space per year<br />
Tenant <strong>and</strong> Common Area Servic<strong>in</strong>g<br />
The degree of HVAC servic<strong>in</strong>g supplied to tenants <strong>and</strong> <strong>the</strong> common areas varies<br />
significantly between shopp<strong>in</strong>g centres. Condition<strong>in</strong>g to tenants can be provided by ei<strong>the</strong>r <strong>the</strong><br />
shopp<strong>in</strong>g centre or by tenants <strong>the</strong>mselves. For <strong>the</strong> majority of shopp<strong>in</strong>g centres surveyed, <strong>the</strong>re<br />
is some mix of serviced <strong>and</strong> un-serviced tenancies.<br />
The percentage of <strong>the</strong> centre serviced is determ<strong>in</strong>ed by <strong>the</strong> percentage of <strong>the</strong> GLAR of<br />
<strong>the</strong> centre for which full HVAC services are <strong>in</strong>cluded with<strong>in</strong> <strong>the</strong> centre’s energy consumption.<br />
For <strong>the</strong> purposes of this study, full HVAC services means that all <strong>the</strong>rmal (space heat<strong>in</strong>g <strong>and</strong> or<br />
cool<strong>in</strong>g), air movement <strong>and</strong> ventilation is provided by <strong>the</strong> shopp<strong>in</strong>g centre. As an example, a<br />
tenancy supplied with condenser water only is not deemed to be serviced by <strong>the</strong> centre.<br />
The impact of provid<strong>in</strong>g servic<strong>in</strong>g to tenants on a centre’s emissions is affected both by<br />
<strong>the</strong> centre’s size <strong>and</strong> climate based loads. The magnitude of this correction has been determ<strong>in</strong>ed<br />
by exam<strong>in</strong><strong>in</strong>g <strong>the</strong> proportion of serviced GLAR aga<strong>in</strong>st <strong>the</strong> residuals of sample sites.<br />
©2010 ACEEE Summer Study on <strong>Energy</strong> Efficiency <strong>in</strong> Build<strong>in</strong>gs<br />
3-10
Figure 5: Servic<strong>in</strong>g of Tenants<br />
The results of <strong>the</strong> regression are shown below.<br />
Table 3: Tenant Servic<strong>in</strong>g Regression<br />
Variable Coefficients P-value<br />
Intercept -0.1152 0.175005<br />
Serviced Percentage 0.274194 0.068823<br />
The correction is applied as an adjustment factor to <strong>the</strong> predicted emissions from climate<br />
<strong>and</strong> GLAR related loads, but not to unrelated loads, such as car parks.<br />
The correction for servic<strong>in</strong>g used is an adjustment of <strong>the</strong> emissions by up to 30% rang<strong>in</strong>g<br />
from allocat<strong>in</strong>g 90% of <strong>the</strong> predicted emissions for centres with no serviced GLAR to 120% of<br />
<strong>the</strong> predicted emissions for centres with all GLAR serviced, based upon <strong>the</strong> regression <strong>in</strong> table 3.<br />
The correction applied for <strong>the</strong> serviced percentage of <strong>the</strong> centre, also affects <strong>the</strong><br />
allocation of emissions due to HDD. The correction for gas emissions, due to climate driven<br />
heat<strong>in</strong>g loads become:<br />
Ggas db<br />
Predicted Emissions<br />
= GLAR*<br />
0.<br />
0017*<br />
HDD18<br />
* ( 0.<br />
9 + 0.<br />
3*<br />
S)<br />
Based upon <strong>the</strong> comb<strong>in</strong>ation of <strong>the</strong> previous results, average greenhouse gas emissions<br />
for a shopp<strong>in</strong>g centre <strong>in</strong> Australia can be predicted by:<br />
kgCO<br />
2<br />
/ m<br />
2<br />
= GLAR * ( 82.<br />
4 + 0.<br />
036CDD<br />
+ GLAR * 0.<br />
0017*<br />
HDD<br />
18db<br />
* ( 0.<br />
9<br />
+<br />
15wb<br />
0.<br />
3*<br />
S)<br />
) * ( 0.<br />
9<br />
+<br />
0.<br />
3*<br />
S)<br />
+ 514CP<br />
MV<br />
+ 111CP<br />
Where kgCO2/m 2 is kilograms of carbon dioxide emitted per square metre of GLAR per<br />
year, CDD15wb is <strong>the</strong> number of cool<strong>in</strong>g degree days base 15°C wet bulb, S is <strong>the</strong> serviced<br />
percentage of <strong>the</strong> shopp<strong>in</strong>g centre’s GLAR, CPMV is <strong>the</strong> number of mechanically ventilated car<br />
spaces <strong>and</strong> CPOA is <strong>the</strong> number of open air or naturally ventilated car spaces <strong>and</strong> HDD18db is <strong>the</strong><br />
annual heat<strong>in</strong>g degree days base 18°C dry bulb.<br />
©2010 ACEEE Summer Study on <strong>Energy</strong> Efficiency <strong>in</strong> Build<strong>in</strong>gs<br />
OA<br />
3-11
The correlation between predicted <strong>and</strong> actual greenhouse emissions is shown below <strong>in</strong><br />
Figure 6:<br />
Figure 6: Predicted vs. Actual Shopp<strong>in</strong>g Centre GHG Emissions<br />
When applied to <strong>the</strong> total data set expressed <strong>in</strong> total kgCO2, <strong>the</strong> regression equation has<br />
an R² of 0.56, <strong>in</strong>dicat<strong>in</strong>g that <strong>the</strong> factors represented <strong>in</strong> <strong>the</strong> regression equation account for 56%<br />
of <strong>the</strong> variability <strong>in</strong> <strong>the</strong> data set. Note that <strong>the</strong> l<strong>in</strong>e with<strong>in</strong> this graph is a 1:1 relationship, <strong>and</strong> not<br />
a trend-l<strong>in</strong>e.<br />
In order to evaluate <strong>the</strong> efficiency of <strong>the</strong> shopp<strong>in</strong>g centre aga<strong>in</strong>st this metric, <strong>the</strong> actual<br />
consumption of <strong>the</strong> centre should be compared aga<strong>in</strong>st <strong>the</strong> predicted emissions for an “average”<br />
centre with <strong>the</strong> same characteristics. Measured consumption that is lower than predicted<br />
consumption <strong>in</strong>dicates better than average shopp<strong>in</strong>g centre greenhouse emissions.<br />
<strong>Water</strong> <strong>Benchmark<strong>in</strong>g</strong><br />
A similar process was used to develop water benchmarks, with <strong>the</strong> key difference that<br />
water consumption <strong>in</strong>cludes water consumption of tenants, as most sites have a s<strong>in</strong>gle ma<strong>in</strong><br />
water meter. The water model has a substantially better fit to <strong>the</strong> underly<strong>in</strong>g data than <strong>the</strong> energy<br />
model, with <strong>the</strong> water model expla<strong>in</strong><strong>in</strong>g 89% of <strong>the</strong> variation <strong>in</strong> water consumption.<br />
Key parameters with<strong>in</strong> <strong>the</strong> water consumption model are:<br />
• The Gross Lettable Area <strong>Retail</strong>, <strong>in</strong> square metres, AGLAR<br />
• The quantity of cool<strong>in</strong>g degree days <strong>in</strong> <strong>the</strong> year, base 15°C wet bulb, CDD15wb<br />
• The area of gymnasium tenants, <strong>in</strong> square metres, Agym<br />
• The number of food court seats provided, nfcs<br />
• And <strong>the</strong> number of c<strong>in</strong>ema <strong>the</strong>atrettes, n<strong>the</strong>atrettes<br />
©2010 ACEEE Summer Study on <strong>Energy</strong> Efficiency <strong>in</strong> Build<strong>in</strong>gs<br />
3-12
Us<strong>in</strong>g <strong>the</strong>se parameters, <strong>the</strong> predicted water consumption (<strong>in</strong> kL per year per square<br />
metre of GLAR) can be predicted by:<br />
( 5.<br />
93Agym<br />
+ 18.<br />
9n<br />
fcs + 814n<strong>the</strong>atrettes<br />
)<br />
w = 0. 686 + 0.<br />
000406CDD15wb<br />
+<br />
A<br />
Conclusions <strong>and</strong> Fur<strong>the</strong>r Research<br />
This study has developed greenhouse <strong>and</strong> water performance benchmarks for use <strong>in</strong> <strong>the</strong><br />
shopp<strong>in</strong>g centre <strong>in</strong>dustry <strong>in</strong> Australia. These benchmarks have formed <strong>the</strong> basis for <strong>the</strong><br />
development of <strong>the</strong> NABERS retail tool (www.NABERS.com.au), which has found substantial<br />
<strong>in</strong>terest from <strong>the</strong> shopp<strong>in</strong>g centre <strong>in</strong>dustry (Westfield, Colonial, Mirvac <strong>and</strong> Stockl<strong>and</strong>, who<br />
between <strong>the</strong>m represent over 50% of Australian shopp<strong>in</strong>g centres, among o<strong>the</strong>rs are trial<strong>in</strong>g this<br />
tool). Shopp<strong>in</strong>g centre portfolios have begun maneuver<strong>in</strong>g to align <strong>the</strong>ir portfolios to be<br />
assessable under NABERS, <strong>and</strong> to be able to promote rat<strong>in</strong>gs with<strong>in</strong> <strong>the</strong>ir corporate report<strong>in</strong>g.<br />
Research is cont<strong>in</strong>u<strong>in</strong>g <strong>in</strong>to develop<strong>in</strong>g sector specific benchmarks for <strong>in</strong>dividual store<br />
categories, such as supermarkets, department stores, hardware stores <strong>and</strong> bulky goods stores is<br />
required, <strong>and</strong> will require <strong>in</strong>put, feedback <strong>and</strong> support <strong>in</strong> <strong>the</strong> form of data from <strong>the</strong>se <strong>in</strong>dustries.<br />
References<br />
Bannister P, The Application of Simulation <strong>in</strong> <strong>the</strong> Prediction <strong>and</strong> Achievement of Absolute<br />
Build<strong>in</strong>g <strong>Energy</strong> <strong>Performance</strong>, Build<strong>in</strong>g Simulation 2009, IBPSA proceed<strong>in</strong>gs, Exergy<br />
Australia, 2009.<br />
Chung W., Hui Y.V., Lam Y.M. <strong>Benchmark<strong>in</strong>g</strong> <strong>the</strong> <strong>Energy</strong> Efficiency of Commercial<br />
Build<strong>in</strong>gs (2006) Applied <strong>Energy</strong>, 83 (1), pp. 1-14.<br />
DECCW (New South Wales Department of Environment <strong>and</strong> Climate Change, Nabers 2009<br />
annual report, June 2009, Sydney.<br />
DEWHA (Department of Environment, Heritage <strong>and</strong> <strong>the</strong> Arts), M<strong>and</strong>atory Disclosure of<br />
Commercial Build<strong>in</strong>g <strong>Energy</strong> Efficiency – Regulation Document, 2009, Canberra<br />
DEWHA (Department of Environment, Heritage <strong>and</strong> <strong>the</strong> Arts), Australian Greenhouse Office<br />
Factors <strong>and</strong> Methods Workbook, 2008, Canberra. Available onl<strong>in</strong>e at<br />
www.environment.gov.au<br />
DECCW (New South Wales Department of Environment <strong>and</strong> Climate Change, Nabers 2009<br />
annual report, June 2009, Sydney.<br />
UK build<strong>in</strong>g research establishment. <strong>Energy</strong> <strong>Benchmark<strong>in</strong>g</strong> <strong>in</strong> <strong>the</strong> <strong>Retail</strong> <strong>Sector</strong> 1999.<br />
Build<strong>in</strong>g ma<strong>in</strong>tenance <strong>in</strong>formation special report, report no. SR 281. London, UK:<br />
Build<strong>in</strong>g Cost Information Service Ltd.; 1999.<br />
©2010 ACEEE Summer Study on <strong>Energy</strong> Efficiency <strong>in</strong> Build<strong>in</strong>gs<br />
glar<br />
3-13