Financial liberalisation and economic growth: a meta-analysis ... - DfID
Financial liberalisation and economic growth: a meta-analysis ... - DfID
Financial liberalisation and economic growth: a meta-analysis ... - DfID

Create successful ePaper yourself
Turn your PDF publications into a flip-book with our unique Google optimized e-Paper software.
Systematic review<br />
<strong>Financial</strong> <strong>liberalisation</strong> <strong>and</strong><br />
<strong>economic</strong> <strong>growth</strong>:<br />
A <strong>meta</strong>-<strong>analysis</strong><br />
by Silke Bumann<br />
Niels Hermes<br />
Robert Lensink<br />
October 2012
This material has been funded by the Department for International Development.<br />
The views expressed do not necessarily reflect the views of the Department for<br />
International Development. The authors are part of the University of Groningen,<br />
the Université Libre de Bruxelles <strong>and</strong> Wageningen University <strong>and</strong> were supported by<br />
the International Initiative for Impact Evaluation (3ie) <strong>and</strong> the Evidence for Policy<br />
<strong>and</strong> Practice Information <strong>and</strong> Co-ordinating Centre (EPPI-Centre).<br />
The EPPI-Centre reference number for this report is 2011.<br />
This report should be cited as:<br />
Bumann S, Hermes, N, Lensink R (2012) <strong>Financial</strong> <strong>liberalisation</strong> <strong>and</strong> <strong>economic</strong><br />
<strong>growth</strong>: a <strong>meta</strong>-<strong>analysis</strong>. Technical report. London: EPPI-Centre, Social Science<br />
Research Unit, Institute of Education, University of London.<br />
ISBN: 978-1-907345-40-1<br />
© Copyright<br />
Authors of the systematic reviews on the EPPI-Centre website<br />
(http://eppi.ioe.ac.uk/) hold the copyright for the text of their reviews. The EPPI-<br />
Centre owns the copyright for all material on the website it has developed,<br />
including the contents of the databases, manuals, <strong>and</strong> keywording <strong>and</strong> data<br />
extraction systems. The centre <strong>and</strong> authors give permission for users of the site to<br />
display <strong>and</strong> print the contents of the site for their own non-commercial use,<br />
providing that the materials are not modified, copyright <strong>and</strong> other proprietary<br />
notices contained in the materials are retained, <strong>and</strong> the source of the material is<br />
cited clearly following the citation details provided. Otherwise users are not<br />
permitted to duplicate, reproduce, re-publish, distribute, or store material from<br />
this website without express written permission.<br />
i
Contents<br />
List of abbreviations .......................................................................... iii<br />
Abstract ........................................................................................ iv<br />
1. Introduction ................................................................................. 1<br />
2. <strong>Financial</strong> <strong>liberalisation</strong> <strong>and</strong> <strong>economic</strong> <strong>growth</strong>: the debate ........................... 3<br />
3. Measuring financial <strong>liberalisation</strong> ........................................................ 7<br />
4. Meta-<strong>analysis</strong> .............................................................................. 11<br />
4.1 Literature retrieval process ......................................................... 11<br />
4.2 Choosing a st<strong>and</strong>ardised effect measure .......................................... 13<br />
4.3 Descriptive statistics ................................................................. 15<br />
4.4 Meta-regression <strong>analysis</strong>................................................................ 24<br />
5. Conclusions <strong>and</strong> final remarks .......................................................... 43<br />
6. References ................................................................................. 46<br />
Appendices .................................................................................... 50<br />
Appendix 1.1: Authorship of this report ................................................ 50<br />
Appendix 4.1: Studies included in the <strong>meta</strong>-sample ................................. 52<br />
Appendix 4.2: Results from additional robustness checks ........................... 58<br />
ii
<strong>Financial</strong> <strong>liberalisation</strong> <strong>and</strong> <strong>economic</strong> <strong>growth</strong>: a <strong>meta</strong>-<strong>analysis</strong><br />
List of abbreviations<br />
ADR American depositary receipt<br />
AREAER Annual Report on Exchange Arrangements <strong>and</strong> Exchange<br />
Restrictions<br />
FAT funnel graph asymmetry test<br />
FDI foreign direct investment<br />
GDP gross domestic product<br />
IFC International <strong>Financial</strong> Corporation<br />
IMF International Monetary Fund<br />
NBER National Bureau of Economic Research<br />
NUYCO number of years with controls<br />
OECD Organisation for Economic Co-operation <strong>and</strong> Development<br />
PET precision effect test<br />
RePEc Research Papers in Economics<br />
SSRN Social Science Research Network<br />
iii
Abstract<br />
iv<br />
Abstract<br />
This study provides a systematic <strong>analysis</strong> of the empirical literature on the<br />
relationship between financial <strong>liberalisation</strong> <strong>and</strong> <strong>economic</strong> <strong>growth</strong> by conducting a<br />
<strong>meta</strong>-<strong>analysis</strong>, based on 441 t-statistics reported in 60 empirical studies. To our<br />
knowledge, this is the first study using <strong>meta</strong>-<strong>analysis</strong> as a tool to investigate the<br />
financial <strong>liberalisation</strong>–<strong>growth</strong> nexus. We focus on explaining the heterogeneity of<br />
results reported in the studies in our sample, investigating the importance of study-<br />
, data- <strong>and</strong> method-specific characteristics. Although our results indicate that, on<br />
average, there is a positive effect of financial <strong>liberalisation</strong> on <strong>growth</strong>, the<br />
significance of this effect is only weak. Next, we find that most of the variables<br />
that may help explaining the heterogeneity of results regarding the relationship<br />
between financial <strong>liberalisation</strong> <strong>and</strong> <strong>economic</strong> <strong>growth</strong> do not produce any<br />
significant results. There are two exceptions. Our <strong>analysis</strong> suggests that financial<br />
<strong>liberalisation</strong> policies carried out during the 1970s seem to have a stronger<br />
negative relationship with <strong>growth</strong>. Moreover, our results show that studies that<br />
take into account a measure of the level of development of the financial system<br />
report lower t-statistics for the relationship between <strong>liberalisation</strong> <strong>and</strong> <strong>growth</strong>.
<strong>Financial</strong> <strong>liberalisation</strong> <strong>and</strong> <strong>economic</strong> <strong>growth</strong>: a <strong>meta</strong>-<strong>analysis</strong><br />
1. Introduction<br />
During the past two decades, many countries have reformed their domestic<br />
financial markets. In many cases, these reforms were triggered by domestic <strong>and</strong><br />
international developments. Domestically, many government policies that focused<br />
on controlling financial markets – known in the literature as financial repression –<br />
became increasingly criticised, for it was felt that these policies were blocking the<br />
efficient functioning <strong>and</strong> development of financial institutions. The idea that<br />
stagnating <strong>economic</strong> <strong>growth</strong> <strong>and</strong> <strong>economic</strong> crisis were related to financial<br />
repression policies has gained ground since the early 1970s (McKinnon 1973, Shaw<br />
1973). 1 Internationally, the globalisation of markets, including financial markets,<br />
also put pressure on governments to reconsider financial market controls. The<br />
profoundness of these reforms raises questions regarding the potential consequences<br />
of foreign <strong>liberalisation</strong> on <strong>economic</strong> <strong>growth</strong>.<br />
Reforms of financial markets include several specific policies which in one way or<br />
another aim at contributing to higher <strong>economic</strong> <strong>growth</strong>. Several authors claim that<br />
<strong>liberalisation</strong> of financial markets raises the efficiency with which these markets<br />
can transform saving into investment, which ultimately should improve <strong>growth</strong><br />
performance. At the same time, however, financial <strong>liberalisation</strong> policies have<br />
been criticised for their potential role in triggering financial <strong>and</strong> <strong>economic</strong> crises in<br />
the past. The question, therefore, is whether or not these policies lead to higher<br />
<strong>economic</strong> <strong>growth</strong>. Several papers have looked into this debate from an empirical<br />
point of view. The general picture that emerges from st<strong>and</strong>ard literature surveys is<br />
that the evidence remains inconclusive. 2 However, these review studies do not<br />
attempt to systematically investigate the outcomes of empirical studies of the<br />
financial <strong>liberalisation</strong>–<strong>growth</strong> nexus. In light of this gap, this study conducts <strong>meta</strong><strong>analysis</strong><br />
of the relationship between financial <strong>liberalisation</strong> <strong>and</strong> <strong>economic</strong> <strong>growth</strong>,<br />
based on 60 empirical studies, to provide a more systematic review of the available<br />
evidence.<br />
Meta-<strong>analysis</strong> is a methodology that provides a statistical approach to reviewing<br />
<strong>and</strong> summarising the literature (Stanley 2001). According to Florax et al. (2002:1):<br />
‘…<strong>meta</strong>-<strong>analysis</strong> is more “objective” than the traditional literature review,<br />
although it is not necessarily free from subjectivity either.’ This methodology<br />
allows us to draw a more comprehensive picture of the impact of financial<br />
<strong>liberalisation</strong> on <strong>growth</strong> than we may arrive at when looking at small set of studies.<br />
By using <strong>meta</strong>-<strong>analysis</strong>, each study is taken as one single observation containing<br />
information on the nature of the relationship between financial <strong>liberalisation</strong> <strong>and</strong><br />
<strong>economic</strong> <strong>growth</strong>. Recently, a growing number of <strong>meta</strong>-analyses have been<br />
published in <strong>economic</strong>s on issues such as the relationship between aid <strong>and</strong> <strong>growth</strong><br />
(Doucouliagos <strong>and</strong> Paldam 2007, 2009), central bank independence <strong>and</strong> inflation<br />
(Klomp <strong>and</strong> De Haan 2010), investment <strong>and</strong> uncertainty (Koetse et al. 2009),<br />
<strong>economic</strong> freedom <strong>and</strong> <strong>growth</strong> (Doucouliagos <strong>and</strong> Ulubaşoğlu 2008), democracy <strong>and</strong><br />
<strong>growth</strong> (Doucouliagos <strong>and</strong> Ulubaşoğlu 2008), income inequality <strong>and</strong> <strong>growth</strong> (De<br />
Dominicis et al. 2008) <strong>and</strong> fiscal policies <strong>and</strong> <strong>growth</strong> (Nijkamp <strong>and</strong> Poot 2004). To<br />
our knowledge, this is the first study using <strong>meta</strong>-<strong>analysis</strong> as a tool to investigate<br />
the financial <strong>liberalisation</strong>–<strong>growth</strong> nexus.<br />
1 See Fry (1995) for a comprehensive overview of the discussion on financial repression.<br />
2 For comprehensive surveys of the empirical literature, see, e.g. Brownbridge <strong>and</strong><br />
Kirkpatrick (2000), Eichengreen (2001), Henry (2003, 2007), Hermes <strong>and</strong> Lensink (2008) <strong>and</strong><br />
Kose et al. (2006a, 2006b).<br />
1
2<br />
1. Introduction<br />
In the <strong>meta</strong>-<strong>analysis</strong>, we specifically take into account the following issues. First,<br />
we focus on exploring the sources of heterogeneity of findings reported in different<br />
studies. For this, we start by investigating whether the choice of the financial<br />
<strong>liberalisation</strong> measure has an impact on the results reported in different studies.<br />
Next, we analyse the potential impact of study design on results reported. In<br />
particular, we focus on the impact of differences between studies regarding<br />
country samples, time periods, <strong>and</strong> estimation methods. Moreover, we explicitly<br />
focus on indirect effects of financial <strong>liberalisation</strong> on <strong>economic</strong> <strong>growth</strong>. Second, we<br />
analyse whether studies suffer from a potential publication bias (also sometimes<br />
referred to as the file drawer problem), i.e. whether results published provide a<br />
biased distribution of effects found, because there may be a tendency not to<br />
publish results that show insignificant results.<br />
The remainder of this study is organised as follows. Section 2 provides a short<br />
review of the debate on financial <strong>liberalisation</strong> <strong>and</strong> its potential effects on<br />
<strong>economic</strong> <strong>growth</strong>. In section 3 we discuss how studies have dealt with the<br />
measurement of financial <strong>liberalisation</strong>. Section 4 provides an overview of the data<br />
collection procedure, descriptive statistics <strong>and</strong> the methodology we use to carry<br />
out the <strong>meta</strong>-<strong>analysis</strong>. Moreover, section 4 discusses the results of the <strong>meta</strong><strong>analysis</strong><br />
in detail. The study ends with a conclusion, in which we discuss limitations<br />
of this review <strong>and</strong> suggestions for further research in section 5.
<strong>Financial</strong> <strong>liberalisation</strong> <strong>and</strong> <strong>economic</strong> <strong>growth</strong>: a <strong>meta</strong>-<strong>analysis</strong><br />
2. <strong>Financial</strong> <strong>liberalisation</strong> <strong>and</strong> <strong>economic</strong> <strong>growth</strong>: the debate<br />
The financial system performs a number of important functions in an economy.<br />
Basically, it takes care of mobilising financial resources, facilitating risk<br />
management, allocating resources to the most efficient projects, monitoring the<br />
use of financial resources (exerting corporate governance), <strong>and</strong> providing a<br />
payment system that makes trade among <strong>economic</strong> participants more efficient<br />
(Levine 1997). <strong>Financial</strong> development occurs when a financial system is able to<br />
improve on performing these functions. There is a large body of theoretical <strong>and</strong><br />
empirical work emphasising that financial development is positively associated with<br />
<strong>economic</strong> <strong>growth</strong>. 3<br />
Closely related to the discussion of the relationship between finance <strong>and</strong> <strong>growth</strong> is<br />
the discussion of the role that financial <strong>liberalisation</strong> can play in this relationship.<br />
The main idea is that financial <strong>liberalisation</strong> may impact on financial development<br />
which, in turn, affects <strong>economic</strong> <strong>growth</strong>. There is an ongoing debate about whether<br />
the role of financial <strong>liberalisation</strong> with respect to the finance–<strong>growth</strong> nexus is<br />
positive or negative. 4<br />
While there may be several different characterisations of what financial<br />
<strong>liberalisation</strong> contains, 5 in most studies financial <strong>liberalisation</strong> includes official<br />
government policies that focus on deregulating credit as well as interest rate<br />
controls, removing entry barriers for foreign financial institutions, privatising<br />
financial institutions, <strong>and</strong> removing restrictions on foreign financial transactions.<br />
Hence, financial <strong>liberalisation</strong> has both a domestic <strong>and</strong> foreign dimension. In<br />
general, <strong>liberalisation</strong> focuses on introducing or strengthening the price mechanism<br />
in the market, as well as improving the conditions for market competition.<br />
In the literature, several arguments in favour of <strong>liberalisation</strong> have been put<br />
forward. Most of these arguments implicitly start from the neoclassical<br />
perspective, which assumes that markets are most efficient in allocating scarce<br />
resources. The discussion on liberalising financial markets started with the seminal<br />
publications of McKinnon (1973) <strong>and</strong> Shaw (1973). Both scholars wrote their work as<br />
a critique of government policies, which were focused on restricting <strong>and</strong><br />
controlling financial markets, also known as financial repression. Among other<br />
things, these policies consisted of establishing interest rate ceilings, <strong>and</strong><br />
government directed credit <strong>and</strong> subsidies to banks, leading to excess dem<strong>and</strong> <strong>and</strong><br />
inefficient allocation of capital. McKinnon (1973) <strong>and</strong> Shaw (1973) held these<br />
policies responsible for the low <strong>growth</strong> rates in many developing countries during<br />
the 1950s <strong>and</strong> 1960s. They both argued in favour of liberalising financial markets on<br />
the grounds that this would lead to more as well as more efficient investment<br />
which, in turn, would lead to higher <strong>economic</strong> <strong>growth</strong> rates. In the 1990s, when the<br />
role of financial institutions in <strong>economic</strong> <strong>growth</strong> became intensively discussed in<br />
the literature, several authors explicitly modelled the relationship between finance<br />
3 See Berthélemy <strong>and</strong> Varoudakis (1996) <strong>and</strong> Levine (1997) for comprehensive reviews of the<br />
relationship between finance <strong>and</strong> <strong>growth</strong>.<br />
4 For more comprehensive reviews of the debate see Anderson <strong>and</strong> Tarp (2003), Fry (1997),<br />
Gibson <strong>and</strong> Tsakalatos (1994) <strong>and</strong> Singh (1997)<br />
5 In fact, empirical studies on the effects of financial <strong>liberalisation</strong> use different measures<br />
of this phenomenon, which indicate that there are different views of what captures<br />
financial <strong>liberalisation</strong>. In the <strong>meta</strong>-<strong>analysis</strong>, the issue of measurement of is explicitly taken<br />
into account.<br />
3
2. <strong>Financial</strong> <strong>liberalisation</strong> <strong>and</strong> <strong>economic</strong> <strong>growth</strong>: the debate<br />
<strong>and</strong> <strong>growth</strong>, while others focused on investigating the empirical support for these<br />
models.<br />
The following arguments have been raised to support the positive relationship<br />
between financial <strong>liberalisation</strong> of both credit (i.e. banking) <strong>and</strong> capital markets<br />
vis-à-vis <strong>economic</strong> <strong>growth</strong>. First, it is claimed that introducing market principles<br />
<strong>and</strong> competition in banking markets increases interest rates on deposits, which<br />
leads to higher saving rates. This, in turn, increases the amount of resources<br />
available for investment (McKinnon 1973). If financial <strong>liberalisation</strong> includes<br />
opening up the capital account, capital inflows (in terms of both credit <strong>and</strong> equity<br />
investment) may increase, again raising the availability of funds for investment <strong>and</strong><br />
<strong>growth</strong>. In both cases financing constraints of firms are reduced <strong>and</strong> investment<br />
will rise, leading to higher <strong>growth</strong>.<br />
Second, competition puts pressure on profit margins of banks, in particular on the<br />
interest rates dem<strong>and</strong>ed for loans. This reduces the cost of debt, leading to a rise<br />
in investment <strong>and</strong> <strong>growth</strong>. Moreover, financial <strong>liberalisation</strong> increases possibilities<br />
of risk diversification for financial institutions such as banks, as well as for<br />
(international) equity investors. The subsequent reduction in loan rates <strong>and</strong> equity<br />
costs leads to a rise in investment <strong>and</strong> <strong>growth</strong>. Again, this argument would support<br />
the idea that financial <strong>liberalisation</strong> reduces financial constraints of firms, which<br />
ultimately increases macro<strong>economic</strong> <strong>growth</strong>.<br />
Third, if banking markets are liberalised, banks are stimulated to become more<br />
efficient by reducing overhead costs, improving on overall bank management,<br />
improving risk management, <strong>and</strong> offering new financial instruments <strong>and</strong> services to<br />
the market to keep up with competitors. Moreover, if financial <strong>liberalisation</strong> means<br />
opening up domestic markets to foreign competition, this may lead to the import<br />
of bank <strong>and</strong> risk management techniques together with new financial instruments<br />
<strong>and</strong> services. All these effects will help to improve the efficiency of financial<br />
intermediation in a country, contributing to higher returns to investment <strong>and</strong> thus<br />
to higher rates of <strong>economic</strong> <strong>growth</strong>.<br />
In contrast, it has also been argued that financial <strong>liberalisation</strong> has led in many<br />
cases to disappointing results <strong>and</strong> in some cases even to <strong>economic</strong> <strong>and</strong> financial<br />
crises. First, Stiglitz (2000) <strong>and</strong> others have pointed out that financial <strong>liberalisation</strong><br />
as such does not solve the problem of asymmetric information. This may prevent<br />
financial intermediation from becoming more efficient in a liberalised market.<br />
Many papers, among them the seminal contribution of Stiglitz <strong>and</strong> Weiss (1981),<br />
have indeed shown that problems of asymmetric information prevail in financial<br />
markets <strong>and</strong> that therefore financial repression may arise even without government<br />
intervention.<br />
Second, some papers make the point that financial <strong>liberalisation</strong> may actually<br />
aggravate information problems. When financial markets become liberalised <strong>and</strong><br />
competition is increased, this may lead to a reduction of relationship lending, more<br />
opportunities may be open to borrowers <strong>and</strong> they will look for the cheapest way of<br />
financing their investment. However, a reduction of relationship lending also<br />
destroys information capital <strong>and</strong> thereby increases asymmetric information (Boot<br />
2000).<br />
Third, more competition in financial markets may also imply a reduction in profit<br />
margins <strong>and</strong> an increased financial fragility of financial intermediaries such as<br />
banks. Hellmann et al. (1996, 1997, 2000) in a series of articles make the point<br />
that <strong>liberalisation</strong> reduces the franchise value of banks, which makes them more<br />
prone to financial disruption <strong>and</strong> stimulates risk taking in order to try to increase<br />
profits under the pressure of falling interest rate margins. Reduced margins may<br />
4
<strong>Financial</strong> <strong>liberalisation</strong> <strong>and</strong> <strong>economic</strong> <strong>growth</strong>: a <strong>meta</strong>-<strong>analysis</strong><br />
also stimulate banks to economise on screening <strong>and</strong> monitoring efforts, <strong>and</strong> they<br />
may be more willing to opt for a gambling strategy when allocating loans, i.e.<br />
putting less emphasis on risk <strong>and</strong> more on profit. Thus, financial <strong>liberalisation</strong> may<br />
trigger crises if it leads to excessive risk taking under the pressure of increased<br />
competition (Demirgüç-Kunt <strong>and</strong> Detragiache 1998).<br />
Finally, increased risk taking in financial markets <strong>and</strong> the consequent increase in<br />
the number of failures of banks <strong>and</strong> other institutions may in itself trigger bank<br />
runs (Diamond <strong>and</strong> Dybvig 1983). Bank runs are another source of financial<br />
instability, even in a situation where some banks may be <strong>economic</strong>ally viable.<br />
One way to curb the adverse effects of financial <strong>liberalisation</strong> on the stability of<br />
the financial system is to install financial market regulations. Such regulations<br />
should reduce risk taking by banks <strong>and</strong> should, at least to some extent, bail out<br />
depositors when their bank goes bankrupt. Such a deposit insurance system aims to<br />
reduce the probability of bank runs taking place in times of financial distress. This<br />
is why financial <strong>liberalisation</strong> in combination with a weak regulatory structure may<br />
have strongly adverse effects on <strong>growth</strong> (Andersen <strong>and</strong> Tarp 2003). Examples of<br />
this abound: Chile <strong>and</strong> Argentina in the early 1980s experienced the negative<br />
effects of financial <strong>liberalisation</strong>. The same holds for Mexico (in 1994–95) <strong>and</strong> the<br />
countries affected by the Asian crisis (1997–98), to name just a few. Also the global<br />
financial crisis of 2007–08 was triggered by, among other things, insufficient<br />
financial market regulation.<br />
The above short discussion shows that, from a theoretical perspective, the nature<br />
of the relationship between financial <strong>liberalisation</strong> <strong>and</strong> <strong>economic</strong> <strong>growth</strong> is<br />
ambiguous. Given this theoretical ambiguity, it is important to investigate from an<br />
empirical point of view whether or not financial <strong>liberalisation</strong> leads to higher<br />
<strong>economic</strong> <strong>growth</strong>. Several papers have looked into this issue. The general picture<br />
that emerges from the empirical literature is that the empirical evidence is<br />
inconclusive. Yet, studies reviewing the empirical evidence provide a narrative<br />
discussion of the financial <strong>liberalisation</strong>–<strong>economic</strong> <strong>growth</strong> relationship. They do not<br />
attempt to systematically review the empirical evidence, for example, by using<br />
<strong>meta</strong>-regression <strong>analysis</strong>.<br />
The purpose of this study is to shed light on the nature of the relationship between<br />
financial <strong>liberalisation</strong> <strong>and</strong> <strong>economic</strong> <strong>growth</strong> using the <strong>meta</strong>-<strong>analysis</strong> framework,<br />
based on a sample of 60 empirical studies. We investigate the determinants of the<br />
heterogeneity of the results found in our sample of empirical studies. These<br />
determinants consist of several study specific characteristics, as well as a number<br />
of contextual variables, specifying the context in which policies have been carried<br />
out. We are not aware of any <strong>meta</strong>-analytical review of the financial <strong>liberalisation</strong>–<br />
<strong>growth</strong> nexus.<br />
In particular, we address the following research question (i) <strong>and</strong> sub-questions (ii–<br />
vi):<br />
i) Is the relationship between financial <strong>liberalisation</strong> <strong>and</strong> <strong>economic</strong> <strong>growth</strong><br />
positive or negative?<br />
ii) Does the sign of this relationship differ for different types of measures<br />
of financial <strong>liberalisation</strong>?<br />
iii) Does the sign of the relationship differ for developed versus developing<br />
countries?<br />
iv) Does the sign of the relationship between financial <strong>liberalisation</strong> <strong>and</strong><br />
<strong>growth</strong> differ for different time periods?<br />
v) Are findings about the relationship different for different types of<br />
studies (i.e. published versus working papers) <strong>and</strong> methods of <strong>analysis</strong><br />
5
2. <strong>Financial</strong> <strong>liberalisation</strong> <strong>and</strong> <strong>economic</strong> <strong>growth</strong>: the debate<br />
(i.e. panel, fixed effects, controlling for endogeneity, etc.) used in the<br />
studies in our sample?<br />
vi) Is the context in which financial <strong>liberalisation</strong> is carried out important<br />
for the nature of the relationship between financial <strong>liberalisation</strong> <strong>and</strong><br />
<strong>economic</strong> <strong>growth</strong>?<br />
6
<strong>Financial</strong> <strong>liberalisation</strong> <strong>and</strong> <strong>economic</strong> <strong>growth</strong>: a <strong>meta</strong>-<strong>analysis</strong><br />
3. Measuring financial <strong>liberalisation</strong><br />
The literature distinguishes three broad categories of measures, namely capital<br />
account <strong>liberalisation</strong>, equity market <strong>liberalisation</strong> <strong>and</strong> banking sector<br />
<strong>liberalisation</strong>. In addition, there are multidimensional measures which combine<br />
aspects of the above categories. In general, authors rely on capital account<br />
measures as proxies for financial <strong>liberalisation</strong>. Measures of the other categories<br />
are used less frequently. Table 3.1 summarises important <strong>liberalisation</strong> measures<br />
on the basis of the different categories. As can be seen from the table, capital<br />
account <strong>liberalisation</strong> can be divided into two subcategories. On the one h<strong>and</strong>, so<br />
called de jure measures reflect the existence of legal restrictions on international<br />
capital transactions. Typically, these measures involve scoring methods where each<br />
increment means a lowering of restrictions. Many of these measures use<br />
information from the Annual Report on Exchange Arrangements <strong>and</strong> Exchange<br />
Restrictions (AREAER) of the International Monetary Fund (IMF). On the other h<strong>and</strong>,<br />
de facto measures refer to actual flows <strong>and</strong> stocks of capital. The former comprise<br />
different types of capital such as FDI (foreign direct investment) plus portfolio<br />
flows or total capital flows (see, e.g., Edison et al. 2002). Kose et al. (2006b) as<br />
well as Prasad et al. (2003) advocate the adoption of the related stock data, such<br />
as foreign assets <strong>and</strong> liabilities. The authors point out that stocks are less volatile<br />
<strong>and</strong> less vulnerable to measurement error. In light of this, many studies use the<br />
database on gross foreign assets <strong>and</strong> liabilities which was compiled by Lane <strong>and</strong><br />
Milesi-Ferretti (2001).<br />
Edison et al. (2004) show that for developed countries de jure measures <strong>and</strong> de<br />
facto measures (i.e. those based on the estimated stocks of gross foreign assets<br />
<strong>and</strong> liabilities as a ratio of GDP [gross domestic product]) follow very similar<br />
patterns over time. For the case of developing countries the picture is less<br />
straightforward. While both de jure <strong>and</strong> de facto <strong>liberalisation</strong> seemed to stagnate<br />
at low levels until the mid-1980s, they appear to diverge in more recent decades,<br />
with de facto measures pointing towards an acceleration of <strong>liberalisation</strong>, whereas<br />
de jure <strong>liberalisation</strong> has reverted back to its level of the early 1970s.<br />
Both de facto <strong>and</strong> de jure measures of capital account <strong>liberalisation</strong> have specific<br />
shortcomings. An often cited criticism with respect to de jure measures is that they<br />
are silent about the intensity of capital account openness. This problem is most<br />
obvious in case of the IMF_AREAER binary indicator which becomes 1 if a country<br />
has no legal capital restrictions in place <strong>and</strong> 0 otherwise. For instance, it is possible<br />
that countries with an assigned value of 0 can in practice enforce capital controls<br />
in different ways leading to diverse outcomes in terms of flows (Kose et al. 2006a,<br />
2006b). In view of this criticism, more nuanced or disaggregated measures such as<br />
the Quinn measure or OPENNESS were developed. Nonetheless, these measures<br />
preserve the dummy variable nature of the original IMF_AREAER measure (Quinn<br />
<strong>and</strong> Toyoda 2008). By virtue of this limitation, de facto measures are considered as<br />
an adequate alternative (Kose et al. 2006b, Prasad et al. 2003). Nevertheless,<br />
there are a number of potential problems with de facto measures. Some authors<br />
suggest that these measures are potentially endogenous in <strong>growth</strong> regressions. In<br />
addition, capital flows might be driven by factors other than capital account<br />
openness policies such as reforms in other areas of the economy (Kose et al. 2006b,<br />
Quinn <strong>and</strong> Toyoda 2008). The last point also implies that de facto <strong>liberalisation</strong> is<br />
not necessarily consistent with what we actually would like to capture, namely the<br />
link between exogenous political changes in capital account restrictions <strong>and</strong><br />
<strong>economic</strong> <strong>growth</strong>. However, the endogeneity problem also applies to the de jure<br />
7
8<br />
3.Measuring financial <strong>liberalisation</strong><br />
measures of capital account <strong>liberalisation</strong>. For example, fast growing countries may<br />
decide to remove restrictions on capital movements to push <strong>economic</strong> <strong>growth</strong><br />
further, leading to a stronger correlation between <strong>liberalisation</strong> <strong>and</strong> <strong>growth</strong>.<br />
Apart from capital account <strong>liberalisation</strong>, several studies investigate the impact of<br />
equity market <strong>liberalisation</strong> using measures of restrictions on the international sale<br />
or purchase of equities. As shown in Table 3.1, there are different approaches to<br />
measuring equity market <strong>liberalisation</strong>. The traditional measure is official<br />
<strong>liberalisation</strong> which aims at determining the time period in which the <strong>liberalisation</strong><br />
of equity markets to foreign investors occurred (Bekaert <strong>and</strong> Harvey 2000). Several<br />
authors have extended this indicator by combining different sources <strong>and</strong> including<br />
additional countries (i.e. Bekaert <strong>and</strong> Harvey 2000, Bekaert et al. 2005, Kaminsky<br />
<strong>and</strong> Schmukler 2003).<br />
The third category of measures focuses on the <strong>liberalisation</strong> of the banking sector.<br />
In general, these measures are concerned with the <strong>liberalisation</strong> of the interest<br />
rate. However, compared with the other two categories, bank-based measures are<br />
rarely employed.<br />
Finally, we identify a fourth group consisting of measures that cannot be<br />
incorporated into one of the above categories. Often, these measures combine<br />
several dimensions of financial <strong>liberalisation</strong>. A prominent example is based on the<br />
work by Abiad <strong>and</strong> Mody (2005) <strong>and</strong> Abiad et al. (2010) who take into account six<br />
dimensions of financial market policies.<br />
The endogeneity problem discussed above also applies to measures of equity<br />
market <strong>and</strong> banking sector <strong>liberalisation</strong> as well as multidimensional measures.<br />
Abiad <strong>and</strong> Mody (2005), using their multi-dimensional measure of financial<br />
<strong>liberalisation</strong>, suggest that financial <strong>liberalisation</strong> is positively associated with<br />
global interest rate declines, balance of payments crises <strong>and</strong> greater openness to<br />
trade, whereas banking crises seem to have been associated with reversals of<br />
reforms. Huang (2009) criticises Abiad <strong>and</strong> Mody (2005). Using different<br />
econometric methods <strong>and</strong> additional data, Huang (2009) shows that efforts to<br />
implement financial <strong>liberalisation</strong> by countries depend on the extent to which they<br />
have financially repressed financial systems. Moreover, he shows that a country’s<br />
<strong>economic</strong> <strong>and</strong> political structure <strong>and</strong> ideology have an impact on decisions to<br />
implement reforms. Thus, both studies indicate that the decision to liberalise<br />
financial markets may not be independent from other (<strong>economic</strong> or political)<br />
factors. Hence, their evidence implies that endogeneity may be a problem when<br />
implementing the <strong>liberalisation</strong> measures.<br />
Table 3.1: Measures of financial <strong>liberalisation</strong><br />
A.1 de jure measures<br />
IMF_AREAER<br />
A. Capital account <strong>liberalisation</strong><br />
� binary variable to indicate countries with an<br />
open capital account<br />
� comprises six categories<br />
� takes a value of 0 if the country in question has<br />
at least one restriction in the ‘restrictions on<br />
payments for the capital account transactions’,<br />
1 otherwise
<strong>Financial</strong> <strong>liberalisation</strong> <strong>and</strong> <strong>economic</strong> <strong>growth</strong>: a <strong>meta</strong>-<strong>analysis</strong><br />
Quinn (1997) � <strong>liberalisation</strong> scale ranging between 0 <strong>and</strong> 4<br />
with increments of 0.5 points<br />
� higher values indicate lower intensity of<br />
financial regulation<br />
� based on AREAER data<br />
OPENNESS � <strong>liberalisation</strong> scales with increments of 0.5<br />
points<br />
� ranges between 0 <strong>and</strong> 14<br />
� based on AREAER data<br />
KAOPEN � index to measure the extent of capital account<br />
openness<br />
Number of years with controls<br />
SHARE<br />
A.2 De Facto measures<br />
� based on the four main categories of the<br />
restrictions on external accounts reported in<br />
the AREAER<br />
� ratio between number of years without controls<br />
on capital flows divided by total number of<br />
years in the sample, values between 0 <strong>and</strong> 1<br />
� based on AERAER data<br />
� types: FDI plus portfolio in- <strong>and</strong> out-flows,<br />
foreign assets plus foreign liabilities, stock of<br />
FDI plus portfolio flows<br />
� measured as a fraction of GDP<br />
B. Equity market <strong>liberalisation</strong><br />
Official <strong>liberalisation</strong> � corresponds to a date of formal regulatory<br />
change after which foreign investors officially<br />
have the opportunity to invest in domestic<br />
equity securities<br />
� constructed as a share of years liberalised<br />
First sign � denotes the year associated with the earliest of<br />
three dates: official <strong>liberalisation</strong>, first<br />
American depositary receipt (ADR)<br />
announcement <strong>and</strong> first country fund launch<br />
International <strong>Financial</strong><br />
Corporation (IFC)<br />
� takes a value of 1 after the first sign year, 0<br />
otherwise<br />
� index on stock market <strong>liberalisation</strong> capturing<br />
two regimes: a <strong>liberalisation</strong> <strong>and</strong> restricted<br />
regime<br />
9<br />
(continued)
C. Banking sector <strong>liberalisation</strong><br />
10<br />
3.Measuring financial <strong>liberalisation</strong><br />
Kaminsky <strong>and</strong> Schmukler (2003) � chronology of bank <strong>liberalisation</strong> taking into<br />
account regulations on deposit interest rates,<br />
lending interest rates, allocation of credit,<br />
foreign currency deposits<br />
� distinguishes the degree of openness:<br />
repressed, partially liberalised, fully liberalised<br />
Demirgüç-Kunt <strong>and</strong> Detragiache<br />
(1998) � dates of domestic interest rate <strong>liberalisation</strong><br />
D. Multidimensional measures<br />
Abiad et al. (2010) � measure that considers six dimensions of<br />
financial market policies: i) credit controls; ii)<br />
interest rate controls; iii) entry barriers; iv)<br />
operational restrictions for securities markets;<br />
v) privatisation of financial institutions; vi)<br />
restrictions on international financial<br />
transactions
<strong>Financial</strong> <strong>liberalisation</strong> <strong>and</strong> <strong>economic</strong> <strong>growth</strong>: a <strong>meta</strong>-<strong>analysis</strong><br />
4. Meta-<strong>analysis</strong><br />
Meta-<strong>analysis</strong> is a statistical technique to quantitatively synthesise the empirical<br />
evidence of a specific field of research. In this study, we look at the relationship<br />
between financial <strong>liberalisation</strong> <strong>and</strong> <strong>economic</strong> <strong>growth</strong>. Meta-<strong>analysis</strong> is conducted<br />
most prominently in medical sciences. However, it has also become an increasingly<br />
accepted research tool in <strong>economic</strong>s since it is proving to be very useful for policy<br />
evaluations (Pang et al. 1999, Stanley 2001).<br />
As discussed in section 2, the impact of financial <strong>liberalisation</strong> on <strong>economic</strong> <strong>growth</strong><br />
has sparked controversy <strong>and</strong>, therefore, has received considerable coverage over<br />
the years. This is reflected in the number of empirical studies that deal with the<br />
different dimensions of financial <strong>liberalisation</strong> <strong>and</strong> their impact on various aspects<br />
of <strong>economic</strong> development. The extensive empirical literature on this issue<br />
rationalises the usage of <strong>meta</strong>-analytical tools to clear the picture.<br />
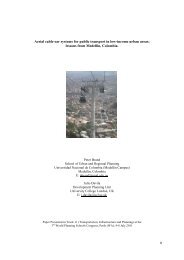
Figure 4.1 provides an overview of the different steps involved in our <strong>meta</strong><strong>analysis</strong>.<br />
6 In step 1 we describe our literature retrieval process. This step is crucial<br />
to the quality <strong>and</strong> conclusiveness of the <strong>meta</strong>-<strong>analysis</strong>. Only a comprehensive<br />
dataset makes it possible to deliver a valid summary of previously established<br />
results. We break up the literature retrieval process into two substeps. The first<br />
part consists of defining eligibility criteria for the inclusion of relevant studies. The<br />
second part involves a systematic search process. In step 2, we discuss the measure<br />
of the <strong>liberalisation</strong>–<strong>growth</strong> relationship used in our <strong>analysis</strong>. Choosing a measure<br />
that is comparable across studies is important in order to be able to carry out a<br />
meaningful <strong>meta</strong>-<strong>analysis</strong>. In step 3, we provide a detailed description of our<br />
dataset. The aim is to familiarise the reader with the data <strong>and</strong> give an overview of<br />
the problem to be studied before delving into the deeper <strong>analysis</strong> on the basis of<br />
hypothesis testing. The objectives of step 4 are twofold. First, we intend to<br />
examine the sources of heterogeneity in the study results by means of <strong>meta</strong>regression<br />
<strong>analysis</strong>. Second, we explore whether the existing literature is biased<br />
towards a significantly positive correlation between financial <strong>liberalisation</strong> policies<br />
<strong>and</strong> <strong>economic</strong> <strong>growth</strong> (i.e. we investigate whether our data suffer from a possible<br />
publication bias).<br />
4.1 Literature retrieval process<br />
<strong>Financial</strong> <strong>liberalisation</strong> has been investigated from many different perspectives<br />
resulting in a large variety of research questions <strong>and</strong> methodologies. For instance,<br />
the term financial <strong>liberalisation</strong> yields 264,000 findings on Google Scholar. 7 Thus, in<br />
order to conduct a meaningful <strong>meta</strong>-<strong>analysis</strong>, we defined criteria to separate<br />
relevant studies from the large amount of literature. Accordingly, we chose to<br />
include studies that:<br />
6<br />
The individual steps will be more carefully explained <strong>and</strong> results obtained in subsequent<br />
sections.<br />
7<br />
This outcome is based on a search in May 2011.<br />
11
Figure 4.1: Overview of the <strong>meta</strong>-analytical framework<br />
Step 1<br />
Step 2<br />
Step 3<br />
Step 4<br />
Literature retrieval process<br />
Defining eligibility criteria<br />
Systematic literature search<br />
Choosing a st<strong>and</strong>ardised effect measure<br />
Descriptive statistics<br />
Meta-regression <strong>analysis</strong><br />
Exploring sources of heterogeneity<br />
Detecting publication selection bias<br />
12<br />
4.Meta-<strong>analysis</strong><br />
Take <strong>economic</strong> <strong>growth</strong> as the dependent variable <strong>and</strong> some measure of financial<br />
<strong>liberalisation</strong> as the independent variable;<br />
i) Investigate either a cross-section or a panel of countries;<br />
ii) Provide sufficient statistical information – especially on the coefficient<br />
<strong>and</strong> the corresponding t-statistic or st<strong>and</strong>ard error of the financial<br />
<strong>liberalisation</strong> variable;<br />
iii) Examine the <strong>liberalisation</strong>–<strong>growth</strong> nexus in terms of a multivariate<br />
regression model;<br />
iv) Are written in English language; <strong>and</strong><br />
v) Were published after 1990 in books, journals or as a working paper.<br />
Excluded studies often did not examine the <strong>liberalisation</strong> <strong>growth</strong> nexus in a crosscountry<br />
setting or did not have <strong>economic</strong> <strong>growth</strong> as the dependent variable. A few<br />
studies had to be disregarded due to insufficient statistical information.<br />
We started our search for relevant publications by querying the electronic<br />
database consisting of RePEc 9 (Research Papers in Economics) pairing the words<br />
‘cross-country’ <strong>and</strong> ‘<strong>growth</strong>’ with ‘banking reform’, ‘banking deregulation’,<br />
‘banking liberalization/ <strong>liberalisation</strong>’, ‘capital account liberalization/<br />
<strong>liberalisation</strong>’ or ‘equity market liberalization/<strong>liberalisation</strong>’. RePEc served as our<br />
primary database. 10 This search resulted in 1,256 papers that encompassed a<br />
9 RePEc is a database that comprises the largest electronic collection of working papers <strong>and</strong><br />
journal articles in <strong>economic</strong>s. The database was queried in September 2010.<br />
10 In the systematic review protocol, we mentioned the possibility of looking at the links<br />
between financial <strong>liberalisation</strong> policies <strong>and</strong> savings, investments <strong>and</strong> financial sector
<strong>Financial</strong> <strong>liberalisation</strong> <strong>and</strong> <strong>economic</strong> <strong>growth</strong>: a <strong>meta</strong>-<strong>analysis</strong><br />
diverse spectrum of hypotheses <strong>and</strong> empirical approaches. By reading the title or<br />
abstract <strong>and</strong> skimming the text, we were able to identify 41 relevant studies. The<br />
same identification strategy was used when we searched for relevant publications<br />
in three additional electronic databases, i.e. SSRN (Social Science Research<br />
Network), JSTOR <strong>and</strong> Google Scholar. These are three large databases, which<br />
helped us backing up our findings. 11 This search led to 359 results from which 16<br />
additional studies were included. We then searched in the databases of the World<br />
Bank <strong>and</strong> International Monetary Fund, which yielded two additional studies. 12<br />
After having reviewed the above-mentioned databases, we checked important<br />
journals in the field of financial <strong>liberalisation</strong> for recent publications. In particular,<br />
we went through all issues from January 1990 to March 2011 of the Review of<br />
<strong>Financial</strong> Studies, Journal of Finance, Journal of <strong>Financial</strong> Economics, Review of<br />
<strong>Financial</strong> Studies, Journal of International Money <strong>and</strong> Finance, Journal of<br />
Development Studies, Journal of Development Economics <strong>and</strong> World Bank<br />
Economic Review. Finally, we verified that we had not overlooked empirical studies<br />
by scanning the references of well-recognised literature surveys that deal with the<br />
link between financial <strong>liberalisation</strong> <strong>and</strong> <strong>economic</strong> <strong>growth</strong>, for instance<br />
Eichengreen (2001), Henry (2003, 2007) <strong>and</strong> Kose et al. (2006). The last two<br />
sources (journals <strong>and</strong> survey articles) yielded one further study.<br />
The literature search <strong>and</strong> the exclusion review were undertaken by two<br />
independent researchers, one of whom is an author of this study. Based on the<br />
systematic search <strong>and</strong> our inclusion criteria (points (i) to (vi)), we ended up with a<br />
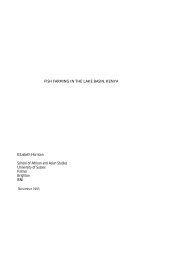
set of 60 studies. 13 Figure 4.2 summarises the steps involved in the process. To<br />
support the accuracy of our results, the search <strong>and</strong> coding were carried out by two<br />
independent researchers. Table A4.1 in Appendix 4.1 lists all the studies which we<br />
include in the <strong>meta</strong>-<strong>analysis</strong>.<br />
4.2 Choosing a st<strong>and</strong>ardised effect measure<br />
Throughout the following sections we consider the t-statistic of the financial<br />
<strong>liberalisation</strong> coefficient (with <strong>economic</strong> <strong>growth</strong> as the dependent variable) as a<br />
st<strong>and</strong>ardised effect size which is be subjected to a <strong>meta</strong>-<strong>analysis</strong>. This decision is<br />
mainly motivated by the fact that the t-statistic is a dimensionless variable. Using<br />
the financial <strong>liberalisation</strong> coefficient itself is not appropriate owing to the<br />
different financial <strong>liberalisation</strong> measures employed across studies. 14<br />
performance. However, due to the relatively large amount of empirical evidence on the<br />
relationship between financial <strong>liberalisation</strong> <strong>and</strong> <strong>growth</strong>, <strong>and</strong> the lack of studies on the<br />
relationship between financial <strong>liberalisation</strong> <strong>and</strong> other macro<strong>economic</strong> variables, we<br />
decided to concentrate on the literature investigating the financial-<strong>liberalisation</strong>-<strong>economic</strong><strong>growth</strong><br />
nexus.<br />
11 SSRN was queried in November 2010, JSTOR was queried in September 2010 <strong>and</strong> April<br />
2011, <strong>and</strong> Google Scholar was queried in November 2010.<br />
12 The databases of the World Bank <strong>and</strong> the International Monetary Fund were queried in<br />
July 2012.<br />
13 We completed our literature search on 12 April 2011.<br />
14 Ideally, we would like to use the simple or partial correlation <strong>and</strong>/or the elasticity<br />
between financial <strong>liberalisation</strong> <strong>and</strong> <strong>economic</strong> <strong>growth</strong>, because this would allow us to<br />
identify the magnitude of the relationship between the two (Doucouliagos <strong>and</strong> Ulubaşoğlu<br />
2008). Unfortunately, the information provided in the studies in our dataset is not sufficient<br />
to calculate st<strong>and</strong>ardized correlations <strong>and</strong>/or elasticities. Based on the t-statistic we use, it<br />
13
Figure 4.2: Literature search <strong>and</strong> retrieval process<br />
14<br />
4.Meta-<strong>analysis</strong><br />
1. Baseline search on financial <strong>liberalisation</strong>/<strong>liberalisation</strong>, financial<br />
deregulation, financial integration, financial globalization/globalisation in<br />
combination with <strong>economic</strong> <strong>growth</strong> yielded 1,256 studies<br />
First, reading the title/abstract <strong>and</strong> second, scanning<br />
the text of those with a relevant abstract yielded 41<br />
studies<br />
2. Additional search based on reform-specific terms resulted in 359 relevant<br />
studies<br />
First, reading the title/abstract <strong>and</strong> second, scanning<br />
the text of those with a relevant abstract yielded 18<br />
studies<br />
3. Back-up search reviewing important journals <strong>and</strong> going through the<br />
reference list of major review studies on financial <strong>liberalisation</strong> <strong>and</strong><br />
<strong>economic</strong> <strong>growth</strong><br />
1 more study included<br />
4. Final outcome: 60 studies meeting the inclusion criteria<br />
From our 60 identified studies we collected 441 t-statistics. Each individual tstatistic<br />
relates to the effect size of the financial <strong>liberalisation</strong> variable in a<br />
particular model specification. One study may present the results of one or more<br />
model specifications. Given that our sample consists of 60 studies, the average<br />
number of model specifications per study is 7.4. 16 We only included the t-statistics<br />
from the main regressions of a study. Thus, we did not consider those of robustness<br />
checks. Arguably, including the results of robustness checks could lead to bias since<br />
not all authors report their outcomes if they do not support their central findings.<br />
We inferred the main regressions from the explanations in the text. Phrases such as<br />
‘...to verify the robustness of our results...’ <strong>and</strong> ‘... section [...] considers several<br />
is not possible to draw conclusions about the magnitude of the financial <strong>liberalisation</strong><br />
coefficient since a change in the size of the t-statistic can increase if either the coefficient<br />
is higher or the st<strong>and</strong>ard deviation is smaller. It does allow us, however, to draw<br />
conclusions on whether the relationship between financial <strong>liberalisation</strong> <strong>and</strong> <strong>economic</strong><br />
<strong>growth</strong> is found to be positive or negative <strong>and</strong> whether or not this relationship is<br />
statistically significant. With respect to interpreting the value of the t-statistics reported,<br />
We would like to make clear that a t-statistic that is smaller than 1.96 in magnitude –<br />
regardless of the direction of the effect – is considered to be not statistically significant at<br />
α = 0.05.<br />
16 Usually, in econometric modelling it is important to estimate different specifications of<br />
the model to control for omitted variables bias.
<strong>Financial</strong> <strong>liberalisation</strong> <strong>and</strong> <strong>economic</strong> <strong>growth</strong>: a <strong>meta</strong>-<strong>analysis</strong><br />
robustness exercises...’ helped us to separate the main regressions from the ones<br />
that are included for robustness checks purposes.<br />
4.3 Descriptive statistics<br />
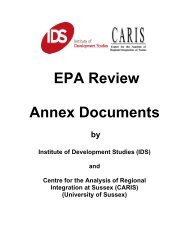
Table 4.1 <strong>and</strong> Figure 4.3 present descriptive statistics of the studies included in our<br />
<strong>meta</strong>-sample. According to the table, the majority of studies report multiple<br />
estimates of the financial <strong>liberalisation</strong> coefficient. Two important facts emerge<br />
from Figure 4.3. First, the t-statistic varies over a considerable range of values<br />
across studies (the largest negative value is -12, whereas the largest positive value<br />
is 25). Second, the t-statistics seem to be widely dispersed.<br />
Table 4.2 presents descriptive statistics of our <strong>meta</strong>-sample by publication year. As<br />
can be seen from the table, there are only a few publications in the 1990s with an<br />
average number of publications of approximately one per year. In contrast, in the<br />
period 2000 to 2010 the average annual number of publications is five. As a result<br />
of variation in publications per year in our sample, a large fraction of t-statistics<br />
originate from studies that were published in the years 2001, 2003, 2004 <strong>and</strong> 2008.<br />
Overall, the number of positive <strong>and</strong> significant results appears to be correlated<br />
with the number of publications in journals. The fact that 2008 is the year with<br />
most publications suggests that the link between financial <strong>liberalisation</strong> <strong>and</strong><br />
<strong>economic</strong> <strong>growth</strong> is still a highly relevant <strong>and</strong> unsettled issue. The table further<br />
shows the time coverage of all studies in our sample. Most studies cover at least<br />
the 1970s, 1980s <strong>and</strong> 1990s. One study uses historical data going back as far as<br />
1880; the most recent data are from 2005. The average number of control variables<br />
ranges between 3.6 <strong>and</strong> 6.3. The observation that studies use different numbers of<br />
controls is relevant to the general criticism that Barro-type <strong>growth</strong> regressions<br />
allow for various model specifications <strong>and</strong> do not deliver accurate insights into the<br />
<strong>liberalisation</strong>–<strong>growth</strong> relationship due to their lack of sufficient theoretical<br />
underpinnings (i.e. Levine <strong>and</strong> Renelt 1992, Sala-i-Martin 1997). In section 4, we<br />
will explore the role of the different control variables in accounting for the<br />
variation in the t-statistic across studies.<br />
Table 4.1: Mean, minimum <strong>and</strong> maximum t-statistics from each study<br />
# Study N Min. Mean Max. min_year max_year<br />
1 Achy (2004) 1 0.17 0.17 0.17 1970 1998<br />
2 Arteta (2001) 26 -2.47 1.02 2.6 1973 1992<br />
3 Bailliu (2000) 3 -2.64 -2.09 -1.82 1975 1995<br />
4 Bekaert (2001) 1 3.29 3.29 3.29 1980 1997<br />
5 Bekaert (2003) 3 4.91 5.72 6.39 1980 2002<br />
6 Bekaert (2005) 23 0.59 4.18 6.38 1980 1997<br />
7 Ben Gmra (2009) 9 -3.2 0.26 3.38 1980 2002<br />
8 Ben Naceur (2008) 6 -2.11 -0.68 1 1979 2005<br />
9 Bonfiglioli (2004) 11 0.61 1.48 2.17 1975 1999<br />
10 Bordo (2007) 8 -0.45 1.33 2.73 1880 1913<br />
11 Bussière (2008) 5 1.14 1.74 2.63 1980 2002<br />
12 Butkiewicz (2008) 16 -1.75 1.46 6.92 1970 1997<br />
15
16<br />
4.Meta-<strong>analysis</strong><br />
13 Calderon (2005) 5 -6.5 -1.36 5.1 1960 2000<br />
14 Choong (2010) 16 -6.84 -1.5 2.58 1988 2002<br />
15<br />
De Avila Torrijos<br />
(2003) 2 -0.54 0.57 1.69 1960 2001<br />
16 De Gregorio (1998) 6 -0.95 0.74 2.57 1976 1993<br />
17 Dreher (2006) 2 2.37 2.39 2.4 1970 2000<br />
18 Durham (2004) 8 -2.1 0.45 3.05 1979 1998<br />
19 Edison (2002) 17 -0.91 0.64 2.46 1976 2000<br />
20 Edison (2004) 13 -0.81 2.01 3.82 1970 1995<br />
21 Edwards (2001) 7 1.26 2.02 2.48 1975 1997<br />
22 Edwards (2004) 2 -2.09 -1.82 -1.54 1970 2001<br />
23 Eichengreen (2003) 11 0.28 3.92 5.83 1880 1997<br />
24 Francois (1999) 1 -0.98 -0.98 -0.98 1986 1995<br />
25<br />
Fuchs –Schendeln<br />
(2004) 12 0.51 2.89 3.88 1975 2000<br />
26 Garita (2009) 10 2 2.95 3.55 1970 2005<br />
27 Haveman (2001) 1 2.33 2.33 2.33 1970 1989<br />
28 Hermes (2008) 6 2.32 2.9 3.55 1973 1996<br />
29 Holl<strong>and</strong> (2005) 2 -0.01 0.001 0.01 1972 2000<br />
30 Honig (2008) 30 0.43 2.85 5.4 1970 2005<br />
31 IMF (2007) 2 -1.64 0.18 2 1975 2004<br />
32 IMF (2008) 4 3 4.3 5 1960 2005<br />
33 Klein (2003) 8 -3.11 -1.94 -0.8 1976 1995<br />
34 Klein (2005) 5 0.42 2.01 4.53 1976 1995<br />
35 Kose (2006) 7 0.27 1.28 2.25 1960 2000<br />
36 Kose (2011) 21 -3.27 -1.24 0 1975 2004<br />
37 Lee (2008) 5 1.36 2.63 3.67 1980 1999<br />
38 Levine (1998) 2 1.01 1.26 1.51 1976 1993<br />
39 Masten (2008) 3 -0.4 -0.27 -0.2 1996 2004<br />
40 McLean (2002) 5 -0.43 0.96 2.31 1976 1995<br />
41 Mody (2007) 4 -1.45 0.51 2.57 1975 2004<br />
42 Mukerji (2009) 2 -0.52 -0.51 -0.5 1960 1999<br />
43 Neto (2008) 3 -1.45 -0.4 1.31 1970 2004<br />
44 Prasad (2003) 1 1.42 1.42 1.42 1982 1997<br />
45 Prasad (2007) 9 -0.48 0.86 2.58 1970 2004<br />
46 Quinn(1997) 8 1.07 2.4 3.09 1958 1989<br />
47 Quinn (2001) 4 1.87 2.99 4.56 1950 1997
<strong>Financial</strong> <strong>liberalisation</strong> <strong>and</strong> <strong>economic</strong> <strong>growth</strong>: a <strong>meta</strong>-<strong>analysis</strong><br />
48 Quinn (2003) 2 2.67 4.08 5.5 1890 1999<br />
49 Quinn (2008) 13 2.77 3.83 5.29 1955 2004<br />
50 Ranciere (2006) 4 2.22 3.46 4.26 1980 2002<br />
51 Razin (2004) 2 -2.83 -2.05 -1.28 1970 1997<br />
52 Reisen (2001) 1 3.13 3.13 3.13 1986 1997<br />
53 Rincon (2007) 6 -12 -2.42 0 1984 2003<br />
54 Rodrik (2009) 2 -0.8 -0.77 -0.74 1970 2004<br />
55 Romero-Avilo (2009) 9 -0.31 1.72 4.25 1960 2001<br />
56 Santana (2004) 12 1.1 3.4 6.56 1970 2000<br />
57 Schularick (2006) 12 -0.06 1.75 3.6 1880 2002<br />
58 Stoianov (2008) 11 -3 -0.27 2.49 1996 2005<br />
59 Tornell (2004) 7 2.8 10.79 24.77 1980 1999<br />
60 Worldbank (2001) 4 -0.1 0.98 1.96 1970 1998<br />
Notes: N refers to the number of t-statistics extracted from each individual study; min_year<br />
indicates the earliest year <strong>and</strong> max_year the most recent year of the dataset which is subjected to<br />
a regression <strong>analysis</strong>.<br />
17
Figure 4.3: Box plot by study<br />
18<br />
4.Meta-<strong>analysis</strong><br />
Notes: The lower <strong>and</strong> the upper hinge of the box denote the 25 th <strong>and</strong> 75 th percentile of the<br />
t-statistic in a study respectively. The b<strong>and</strong> inside the box indicates the median. The<br />
whiskers represent the largest <strong>and</strong> smallest t-statistic, respectively. The red lines at -1.96<br />
<strong>and</strong> +1.96 indicate the critical t-values when α = 0.05; t-values greater than 1.96 in<br />
absolute terms are considered to indicate a statistically significant relationship between<br />
financial <strong>liberalisation</strong> <strong>and</strong> <strong>economic</strong> <strong>growth</strong>.
<strong>Financial</strong> <strong>liberalisation</strong> <strong>and</strong> <strong>economic</strong> <strong>growth</strong>: a <strong>meta</strong>-<strong>analysis</strong><br />
Figure 4.4 displays the frequency distribution of the t-statistic. The main message<br />
of this figure is that a considerable number of t-statistics lie inside the region<br />
between the two red lines indicating insignificance. As reported in Table 4.3, 194<br />
t-statistics (i.e. 44 percent of the total sample of t-statistics) are smaller than 1.96<br />
in absolute terms. Apart from this, there are a few values that can be regarded as<br />
outliers.<br />
Table 4.4 offers a more detailed overview of the average t-statistics in our sample<br />
by type of financial <strong>liberalisation</strong> measure <strong>and</strong> group of countries for different time<br />
periods. At first glance, the table indicates that the coverage in terms of time<br />
periods <strong>and</strong> country groups differs across measures. More precisely, the dataset<br />
does not allow us to report t-statistics for all country groups <strong>and</strong> time periods.<br />
Moreover, the distribution of t-statistics in terms of magnitude is rather<br />
heterogeneous, although the sign is positive in most cases. The unweighted average<br />
value of the 441 t-statistics is 1.6 17 implying that, overall, there does not seem to<br />
exist a statistically significant relationship between financial <strong>liberalisation</strong> <strong>and</strong><br />
<strong>economic</strong> <strong>growth</strong>. A closer look at the table reveals that studies using data from<br />
developed countries (oecd) exhibit a strong tendency to report statistically<br />
significant <strong>and</strong> positive <strong>liberalisation</strong> coefficients for capital account <strong>liberalisation</strong>.<br />
Studies combining both developing <strong>and</strong> developed countries in their sample (mixed)<br />
find that financial <strong>liberalisation</strong> is positively associated with <strong>economic</strong> <strong>growth</strong> when<br />
measures referring to de jure capital account <strong>liberalisation</strong> <strong>and</strong> equity market<br />
<strong>liberalisation</strong> are used. However, when measures of de facto capital account<br />
<strong>liberalisation</strong> are considered, the findings are less optimistic. With respect to<br />
developing countries (dc), the results are also mixed. Studies focusing on this set of<br />
countries do not generally report positive significant <strong>liberalisation</strong> coefficients,<br />
except those studies employing bank-based measures of financial <strong>liberalisation</strong>. In<br />
addition, for these countries de jure capital account <strong>liberalisation</strong> appears to be<br />
positively related to <strong>economic</strong> <strong>growth</strong> until the 1960s. However, this relationship<br />
turns negative over the subsequent decades.<br />
Finally, Table 4.4 shows that there are no studies that consider equity measures in<br />
developed countries; only one study considers bank measures in the mixed country<br />
group. We note that the results relating to the bank-based <strong>and</strong> other measures<br />
must be interpreted with caution, since only a few studies are based on these<br />
measures. Three main lessons can be drawn from Table 4.4. First, studies that<br />
combine developed <strong>and</strong> developing countries report the highest t-statistics on<br />
average. Second, capital account measures indicate trend reversals with respect to<br />
the significance of the financial <strong>liberalisation</strong>–<strong>growth</strong> nexus. Third, studies<br />
generally do not find significant <strong>growth</strong>-enhancing effects of financial <strong>liberalisation</strong><br />
in developing countries.<br />
17 The weighted average (using the inverse of the number of t-statistics for each study as<br />
our weight) is 1.39.<br />
19
Table 4.2: Study characteristics by publication year<br />
No. of<br />
publications<br />
No. of<br />
estimates<br />
WP a Journal<br />
20<br />
Average<br />
no. of<br />
controls<br />
4.Meta-<strong>analysis</strong><br />
t-statistic<br />
sig. b<br />
negative insig. sig. positive<br />
1997 1 0 8 6.3 0 1 7<br />
1998 2 6 2 4.8 0 7 1<br />
1999 1 1 0 5.0 0 1 0<br />
2000 1 3 0 6.3 1 2 0<br />
2001 6 41 2 4.1 1 25 17<br />
2002 3 5 18 4.4 0 18 5<br />
2003 6 11 16 3.6 4 10 13<br />
2004 8 35 32 4.6 3 23 41<br />
2005 5 11 25 5.4 3 9 24<br />
2006 4 12 13 5.2 0 11 14<br />
2007 4 30 0 6.1 2 18 9<br />
2008 10 24 78 4.7 4 38 60<br />
2009 5 12 20 4.2 2 14 16<br />
2010 1 0 16 4.5 7 4 5<br />
2011 1 0 21 5.6 8 13 0<br />
Notes: a WP = working paper; b sig. = significant.<br />
� 35 � 194 � 212
<strong>Financial</strong> <strong>liberalisation</strong> <strong>and</strong> <strong>economic</strong> <strong>growth</strong>: a <strong>meta</strong>-<strong>analysis</strong><br />
Figure 4.4: Frequency distribution of the t-statistic<br />
Note: The red lines at -1.96 <strong>and</strong> +1.96 indicate the critical t-values when the probability<br />
level equals 5%; t-values greater than 1.96 in absolute terms are considered to indicate a<br />
statistically significant relationship between financial <strong>liberalisation</strong> <strong>and</strong> <strong>economic</strong><br />
<strong>growth</strong>.<br />
21
Table 4.3: Average t-statistics for different time periods, country groups <strong>and</strong> measures<br />
Capital account <strong>liberalisation</strong><br />
de jure de facto<br />
OECD a DC b Mixed c OECD DC Mixed OECD DC Mixed<br />
Before 1960 4.08 2.42 3.47 1.48 - 2.00 - - -<br />
1960s 2.72 2.42 2.93 - - -0.70 -0.27 - 4.18<br />
1970s 1.93 1.55 1.85 2.54 0.68 0.81 -0.27 - 4.18<br />
1980s 1.93 0.87 1.67 1.67 0.87 1.10 -0.27 3.24 4.18<br />
1990s 1.93 0.87 1.69 0.63 0.92 1.09 -0.27 3.24 4.18<br />
2000s 1.96 -1.96 2.22 0.49 0.97 -0.29 -0.27 3.24 4.18<br />
No. of obs. d 14 13 146 29 44 101 3 4 1<br />
22<br />
Bank<br />
(continued)<br />
4.Meta-<strong>analysis</strong>
<strong>Financial</strong> <strong>liberalisation</strong> <strong>and</strong> <strong>economic</strong> <strong>growth</strong>: a <strong>meta</strong>-<strong>analysis</strong><br />
Table 4.3, continued.<br />
Equity Multidimensional<br />
OECD DC Mixed OECD DC Mixed<br />
Before 1960 - - - - - -<br />
1960s - - 1.74 2.40 - 4.33<br />
1970s - 1.11 2.37 2.40 0.17 2.72<br />
1980s - 1.34 3.15 2.40 0.17 2.28<br />
1990s - 1.34 3.15 2.40 0.17 2.28<br />
2000s - 0.31 3.05 2.40 - 3.25<br />
No. of obs. d 0 18 55 4 1 8<br />
Notes: Numbers in bold indicate significance at the 10% level.<br />
a Studies investigating OECD or developed countries.<br />
b Studies that look at developing countries (DC).<br />
c Studies combining data for developed <strong>and</strong> developing countries.<br />
d Number of observations (obs.) for the different types of measures by country group.<br />
23
4.4 Meta-regression <strong>analysis</strong><br />
24<br />
4.Meta-<strong>analysis</strong><br />
In Step 3 of the preceding <strong>analysis</strong>, it was shown that the t-statistic varies considerably<br />
across the different types of measures, country groups as well as time periods. In this<br />
section, we investigate this heterogeneity more deeply by means of a <strong>meta</strong>-regression<br />
model. Our approach follows that of Doucouliagos <strong>and</strong> Stanley (2009).<br />
Before proceeding, we want to make some remarks on the type of <strong>analysis</strong> we adopt. In<br />
the literature, there are two approaches to <strong>meta</strong>-regression <strong>analysis</strong>. On the one h<strong>and</strong>,<br />
there are studies that divide all variables in the <strong>meta</strong>-regression model by the st<strong>and</strong>ard<br />
error of the variable that is subject to <strong>meta</strong>-<strong>analysis</strong> in order to account for publication<br />
selection bias <strong>and</strong> to correct for heteroskedasticity (see, e.g., Doucouliagos 2005,<br />
Doucouliagos <strong>and</strong> Stanley 2009). Intuitively, due to this scaling, observations with large<br />
st<strong>and</strong>ard errors get a smaller weight in the estimation. In other words, dividing by the<br />
st<strong>and</strong>ard error controls for a non-r<strong>and</strong>om correlation between the coefficient <strong>and</strong> the<br />
st<strong>and</strong>ard error. On the other h<strong>and</strong>, authors such as Mookerjee (2006) <strong>and</strong> De Dominicis et<br />
al. (2008) are rather cautious about the importance of publication bias. As argued by De<br />
Dominicis et al. (2008), publication bias may be only one explanation for a correlation<br />
between the coefficient <strong>and</strong> the st<strong>and</strong>ard error. Moreover, an implicit requirement of the<br />
first approach is that the dimensions of the variables in the original studies are<br />
comparable. However, this is not the case in our sample as studies use different variables<br />
with different dimensions when measuring financial <strong>liberalisation</strong>. 18 Thus, we suggest that<br />
it is difficult to disentangle publication bias from dimensional effects. Therefore, we<br />
choose not to apply scaling of the variables by the st<strong>and</strong>ard errors. In a separate <strong>analysis</strong>,<br />
we will examine whether our data potentially suffer from publication bias by means of a<br />
funnel asymmetry test (Egger et al. 1997).<br />
4.4.1 Exploring sources of heterogeneity<br />
We begin this section with some conceptual as well as notational remarks that apply to the<br />
remainder of the study. Our dataset consists of N studies, with a different number m of<br />
individual t-statistics t in each study. The total number of individual t-statistics is denoted<br />
N<br />
by M � �� tij<br />
. The j-index represents the studies ( j � 1,<br />
�,<br />
N)<br />
, <strong>and</strong> the i-index st<strong>and</strong>s for<br />
j<br />
m<br />
i<br />
the individual t-statistics within a certain study<br />
( i � 1,<br />
�,<br />
m)<br />
. Since we collect multiple t-<br />
statistics per study, our dataset can be interpreted in terms of a two-level structure: the t-<br />
statistics are located at the first level, whereas the studies correspond to the second<br />
level. 19 The estimated effects of financial <strong>liberalisation</strong> reported in the same study are<br />
expected to be dependent if an author has based their estimations on the same group of<br />
countries <strong>and</strong>/or the same time period. By estimating a r<strong>and</strong>om-effects model, we take<br />
account of this dependence structure through the exploitation of both between- <strong>and</strong><br />
18 Scaling by the st<strong>and</strong>ard errors would then have the strange result that observations measured in<br />
millions (which is the case for some of the de facto <strong>liberalisation</strong> measures) would at least<br />
potentially receive a much lower weight in the estimates compared to observations measured as a<br />
ratio (as is the case many of the de jure measures).<br />
19 Also notice that the idea of the hierarchical model is to explain the variation that occurs at level<br />
1 (the lowest level). Therefore, the t-statistic has to vary at level 1 (Snijders <strong>and</strong> Bosker 2004).
<strong>Financial</strong> <strong>liberalisation</strong> <strong>and</strong> <strong>economic</strong> <strong>growth</strong>: a <strong>meta</strong>-<strong>analysis</strong><br />
within-study information. 20 Other <strong>meta</strong>-studies using this kind of framework include<br />
Doucouliagos (2005), Mookerjee (2006), De Dominicis et al. (2008) <strong>and</strong> Klomp <strong>and</strong> De Haan<br />
(2010).<br />
The model to be estimated reads as follows:<br />
level 1: tij � � 1 j � � l �l<br />
X l,<br />
ij � � p � pZ<br />
p,<br />
j � eij<br />
(1)<br />
level 2: with � 1 j � � 00 � u0 j ,<br />
where the dependent variable is the t-statistic, Z <strong>and</strong> X are vectors of conditioning<br />
variables explaining differences in the <strong>liberalisation</strong> effect within <strong>and</strong> between studies.<br />
Note that the variables in Z only vary at the study level (level 2), whereas those in X<br />
alternate at the observational level (level 1). 1 j<br />
25<br />
� is the intercept that varies between<br />
studies as indicated by the index j. It can be split into an average intercept, � 00 , <strong>and</strong> a<br />
r<strong>and</strong>om study effect, u0 j . We assume that u0 j is independently <strong>and</strong> identically distributed<br />
2<br />
with mean 0 <strong>and</strong> between-study variance � (level 2). ~ ( 0,<br />
) N e � represents the usual<br />
error term.<br />
2<br />
u<br />
2<br />
� e is also referred to as the within-study variance (level 1). 21 The indices i <strong>and</strong><br />
j specify the source of variation of a variable. For instance, the notation tij implies that the<br />
value of t is dependent on the study j, but also on the individual, i. The specification of<br />
the model corresponds to a so-called mixed effects model, including a r<strong>and</strong>om effect (the<br />
intercept) <strong>and</strong> fixed effects. It is also in line with a r<strong>and</strong>om-effects panel model.<br />
Table 4.4 lists the variables that are included in Z <strong>and</strong> X , respectively. The table also<br />
reports the overall, <strong>and</strong> the within <strong>and</strong> between st<strong>and</strong>ard deviation. Note that all<br />
variables, except no. of countries, are so-called indicator variables, with two possible<br />
values, 0 or 1. We include two pure level-2 variables called working paper <strong>and</strong> journal.<br />
These two variables are mutually exclusive, implying that they add up to 1, <strong>and</strong> hence only<br />
one of them can be added to avoid perfect multicolinearity. The variable journal tests<br />
whether marginal effects of financial <strong>liberalisation</strong> differ for studies presented in journals<br />
relative to studies presented in working papers.<br />
There are two different types of measures for financial <strong>liberalisation</strong>, namely de facto <strong>and</strong><br />
de jure. 22 As indicated in the table, these dummy variables also add up to 1. De jure<br />
combines equity, multidimensional, KAOPEN <strong>and</strong> bank <strong>liberalisation</strong> measures. We decided<br />
not to include each of these four measures separately since not all studies include<br />
sufficient observations for all of them (see Table 4.3).<br />
The next set of moderator variables pertains to data characteristics. In order to investigate<br />
time-period effects, we employ dummy variables that refer to different decades or time<br />
periods: before 1970, 1970s, 1980s, 1990s, 2000s. For instance, the dummy variable 1970s<br />
20 Raudenbush <strong>and</strong> Bryk (2002) propose to implement <strong>meta</strong>-<strong>analysis</strong> in terms of a two-level model.<br />
21 Model (1) is the simplest version of a hierarchical linear or multi-level model. A more general<br />
model would also allow for r<strong>and</strong>om slopes.<br />
22 According to Kose et al. (2010) the distinction between de jure <strong>and</strong> de facto measures of financial<br />
<strong>liberalisation</strong> is important for underst<strong>and</strong>ing the different findings provided by the empirical<br />
literature, which is why we explicitly investigate whether using different types of measurement<br />
explains the heterogeneity of findings about the relationship between financial <strong>liberalisation</strong> <strong>and</strong><br />
<strong>economic</strong> <strong>growth</strong>.<br />
ij<br />
e
26<br />
4.Meta-<strong>analysis</strong><br />
is assigned the value 1 if the data in a study cover the 1970s. We do not examine the<br />
periods before 1960 <strong>and</strong> the 1960s separately due to the limited number of observations. 23<br />
In order to gauge the effects of different country types we distinguish between developing<br />
<strong>and</strong> developed countries (dc, oecd). In addition , if a study combines both groups, we<br />
indicate this by means of the dummy variable mixed. The distinction between developing<br />
<strong>and</strong> developed countries is crucial since, from a theoretical perspective, the outcomes of<br />
financial <strong>liberalisation</strong> in the two groups of countries can be very distinct. On the one<br />
h<strong>and</strong>, neoclassical theory postulates that the <strong>liberalisation</strong> of financial markets causes a<br />
flow of resources from capital-rich developed countries, where the return to capital is low,<br />
to capital-poor developing countries with a high return to capital (i.e. Summers 2000). On<br />
the other h<strong>and</strong>, critical voices question the positive impact of financial <strong>liberalisation</strong> in<br />
developing countries by alluding to the fact that these countries become more vulnerable<br />
to financial crises (Stiglitz 2000).<br />
23 It is possible to combine these four categories because all of them rely on qualitative information<br />
rather than financial stocks or flows.
<strong>Financial</strong> <strong>liberalisation</strong> <strong>and</strong> <strong>economic</strong> <strong>growth</strong>: a <strong>meta</strong>-<strong>analysis</strong><br />
Table 4.4: Explanatory variables<br />
Variable Description Mean SD a<br />
Variables that relate to differences in publication<br />
working<br />
Paper<br />
journal<br />
Dummy variable equal to 1 if the study is a working<br />
paper <strong>and</strong> was not published, 0 otherwise.<br />
Dummy variable equal to 1 if the study was<br />
published in a journal, 0 otherwise.<br />
Variables that relate to the measurement of financial <strong>liberalisation</strong><br />
de jure<br />
de facto<br />
Dummy variable equal to 1 if de jure measures of<br />
financial <strong>liberalisation</strong> are used, 0 otherwise<br />
Dummy variable equal to 1 if de facto measures of<br />
financial <strong>liberalisation</strong> are used, 0 otherwise<br />
Variables that relate to dataset characteristics<br />
oecd<br />
dc<br />
mixed<br />
no. of<br />
countries<br />
before<br />
1970<br />
1970s<br />
Dummy variable equal to 1 if the analysed countries<br />
are all member of the OECD, 0 otherwise.<br />
Dummy variable equal to 1 if the analysed countries<br />
are all developing countries, 0 otherwise.<br />
Dummy variable equal to 1 if the analysed countries<br />
are mixed between developing <strong>and</strong> OECD, 0<br />
otherwise<br />
27<br />
Σ<br />
=<br />
1<br />
Σ<br />
=<br />
1<br />
Σ<br />
=<br />
1<br />
Σ<br />
=<br />
1<br />
0.42<br />
0.58<br />
0.60<br />
0.40<br />
0.12<br />
0.18<br />
0.70<br />
The number of countries in the study 54.99<br />
Dummy variable equal to 1 if the data cover the<br />
time period before 1970s, 0 otherwise<br />
Dummy variable equal to 1 if the data cover the<br />
1970s, 0 otherwise<br />
0.21<br />
0.63<br />
0.49<br />
0.50<br />
0.00<br />
0.49<br />
0.50<br />
0.00<br />
0.49<br />
0.46<br />
0.23<br />
0.49<br />
0.46<br />
0.23<br />
0.32<br />
0.30<br />
0.18<br />
0.39<br />
0.41<br />
0.22<br />
0.46<br />
0.45<br />
0.24<br />
34.31<br />
31.72<br />
20.15<br />
0.54<br />
0.55<br />
0.21<br />
0.48<br />
0.46
28<br />
4.Meta-<strong>analysis</strong><br />
Variable Description Mean SD a<br />
1980s<br />
1990s<br />
2000s<br />
primary<br />
data<br />
panel<br />
Dummy variable equal to 1 if the data cover the<br />
1980s, 0 otherwise<br />
Dummy variable equal to 1 if the data cover the<br />
1990s, 0 otherwise<br />
Dummy variable equal to 1 if the data cover the<br />
2000s, 0 otherwise<br />
Dummy variable equal to 1 if authors use their own<br />
data, 0 otherwise<br />
Dummy variable equal to 1 if the study uses panel<br />
data, 0 otherwise.<br />
Variables that relate to the estimation procedure<br />
endogeneity<br />
fixed effect<br />
Dummy variable equal to 1 if the study controls for<br />
endogeneity (i.e. IV or GMM), 0 otherwise<br />
Dummy variable equal to 1 if fixed effects are<br />
included, 0 otherwise.<br />
0.93<br />
0.92<br />
0.39<br />
0.41<br />
0.72<br />
0.50<br />
0.43<br />
Variables that relate to the <strong>economic</strong> conditions <strong>and</strong> indirect effects of flib<br />
trade<br />
inflation<br />
government<br />
Dummy variable equal to 1 if a trade variable is<br />
included, 0 otherwise<br />
Dummy variable equal to 1 if the inflation rate is<br />
included, 0 otherwise<br />
Dummy variable equal to 1 if a measure of the size<br />
of the government is included, 0 otherwise<br />
0.39<br />
0.30<br />
0.34<br />
0.17<br />
0.25<br />
0.24<br />
0.10<br />
0.27<br />
0.25<br />
0.15<br />
0.49<br />
0.48<br />
0.12<br />
0.49<br />
0.45<br />
0.25<br />
0.45<br />
0.43<br />
0.17<br />
0.50<br />
0.41<br />
0.36<br />
0.50<br />
0.43<br />
0.26<br />
0.49<br />
0.46<br />
0.27<br />
0.46<br />
0.45<br />
0.20<br />
0.48<br />
0.47<br />
0.15
<strong>Financial</strong> <strong>liberalisation</strong> <strong>and</strong> <strong>economic</strong> <strong>growth</strong>: a <strong>meta</strong>-<strong>analysis</strong><br />
Variable Description Mean SD a<br />
financial<br />
depth<br />
investment<br />
financial<br />
crisis<br />
institutions<br />
human<br />
capital<br />
social<br />
indicators<br />
Dummy variable equal to 1 if a variable capturing<br />
the depth of the financial system is included, 0<br />
otherwise<br />
Dummy variable equal to 1 if investment is included,<br />
0 otherwise<br />
Dummy variable equal to 1 if a financial/bankingcrisis<br />
dummy is used, 0 otherwise<br />
Dummy variable equal to 1 if a measure of<br />
institutions (i.e. property rights, law <strong>and</strong> order) is<br />
included, 0 otherwise<br />
Dummy variable equal to 1 if a measure of human<br />
capital is included, 0 otherwise<br />
Dummy variable equal to 1 if life expectancy <strong>and</strong>/or<br />
population <strong>growth</strong> are included, 0 otherwise<br />
Notes: a The numbers refer to the overall, between <strong>and</strong> within st<strong>and</strong>ard deviation (SD) respectively.<br />
DC = developing country; OECD = Organisation for Economic Co-operation <strong>and</strong> Development; IV =<br />
instrumental variables; GMM = generalised method of moments.<br />
In addition, we explore whether financial <strong>liberalisation</strong> effects vary because of differences<br />
in the numbers of countries (no. of countries) included, <strong>and</strong> whether or not the original<br />
study uses panel data (panel).<br />
Next, we examine the role of different estimation procedures. Therefore, we include the<br />
dummy variable endogeneity which becomes 1 if a study treats the endogeneity problem<br />
inherent in <strong>liberalisation</strong> <strong>growth</strong> regressions by means of either an instrumental variable or<br />
a method of moments approach. 24 Moreover, we add a binary dummy variable equalling<br />
one if the original study controls for fixed effects (fixed effect).<br />
For the set of relevant conditioning variables, our decision process was driven by the<br />
studies in our sample on the one h<strong>and</strong>, <strong>and</strong> by the related <strong>growth</strong> literature on the other<br />
h<strong>and</strong>. The literature offers a large spectrum of moderator variables that may at least<br />
potentially play a role in explaining <strong>growth</strong> differences. We include nine variables that<br />
capture specification differences across studies. This number is in line with other <strong>meta</strong>studies<br />
dealing with <strong>economic</strong> <strong>growth</strong>. For instance, Doucouliagos <strong>and</strong> Ulubaşğoglu (2008)<br />
include 12 variables to account for different specifications <strong>and</strong> Abreu et al. (2005) have 12<br />
categories of conditioning variables. The vector of conditioning variables in our <strong>meta</strong>-<br />
24 For a discussion of endogeneity in financial <strong>liberalisation</strong>–-<strong>growth</strong> regressions see Bekaert et al.<br />
(2005).<br />
29<br />
0.33<br />
0.56<br />
0.13<br />
0.26<br />
0.73<br />
0.46<br />
0.47<br />
0.45<br />
0.22<br />
0.50<br />
0.49<br />
0.16<br />
0.34<br />
0.35<br />
0.13<br />
0.44<br />
0.44<br />
0.20<br />
0.44<br />
0.47<br />
0.14<br />
0.50<br />
0.49<br />
0.10
30<br />
4.Meta-<strong>analysis</strong><br />
<strong>analysis</strong> contains indicator variables referring to the development of the financial sector<br />
(depth), the openness of the real economy (trade), the size of the government<br />
(government) <strong>and</strong> the social conditions (social indicators) such as life expectancy or<br />
population <strong>growth</strong>. Furthermore, we use dummy variables for investment, inflation, a<br />
measure of institutions such as property rights or law <strong>and</strong> order <strong>and</strong> a measure of human<br />
capital. Finally, we add an indicator for financial crisis. In the <strong>growth</strong> literature,<br />
institutions, human capital <strong>and</strong> investment are generally found to be robustly related to<br />
<strong>economic</strong> <strong>growth</strong> (Sala-i-Martin 1997, Sala-i-Martin et al. 2004).<br />
4.4.1.1 Results<br />
Table 4.5 reports the results of the <strong>meta</strong>-regression <strong>analysis</strong> based on 441 t-statistics we<br />
collected from the 60 studies in our sample. Each column shows a different specification of<br />
model 1. The results are based on r<strong>and</strong>om-effects estimation. 25 The dependent variable is<br />
always the t-statistic. Column (1) indicates that the unconditional mean is highly<br />
significant with a value of 1.42. It may be helpful to explain our result in more detail. As<br />
the constant reflects the average t-statistic of the financial <strong>liberalisation</strong> proxy, our results<br />
imply that we can reject the null hypothesis that the average t-statistic equals 0. Using a<br />
chi-squared test we also have to reject the null hypothesis that the average t-statistic<br />
equals 1.96 (the st<strong>and</strong>ard value for judging whether financial <strong>liberalisation</strong> has a<br />
significant impact on <strong>economic</strong> <strong>growth</strong>, or not). However, we cannot reject the null<br />
hypothesis that the average t-statistic equals 1.66. Hence, we conclude that although our<br />
results indicate that, on average, there is a positive effect of financial <strong>liberalisation</strong> on<br />
<strong>growth</strong>, the significance of this effect is only weak. 26<br />
Next, we focus on the role of using different types of measures for financial <strong>liberalisation</strong>.<br />
Column (2) in Table 4.5 shows that the results for studies using de facto measures are not<br />
statistically different from those that use de jure measures. A similar outcome is found<br />
when different groups of countries are considered. The results presented in column (3)<br />
suggest that the relationship between financial <strong>liberalisation</strong> <strong>and</strong> <strong>growth</strong> does not differ<br />
across types of countries. We also examine whether combinations of measures of financial<br />
<strong>liberalisation</strong> <strong>and</strong> types of countries lead to differences in outcomes. Again, we do not find<br />
significant results (see column (4)).<br />
We proceed by investigating whether the relationship between financial <strong>liberalisation</strong> <strong>and</strong><br />
<strong>growth</strong> may be dependent on the time span covered in the studies. Column (5) suggests<br />
that such time-period effects may indeed exist. In particular, the dummy variables for the<br />
period before the 1970s <strong>and</strong> for the 1990s are positive <strong>and</strong> significant, whereas for the<br />
1970s <strong>and</strong> 2000s the dummy variables are negative <strong>and</strong> significant in case of the dummy<br />
variable for the 2000s 27 . Given that the omitted dummy variable represents data for the<br />
1980s <strong>and</strong> that the constant (representing the effect of this dummy variable) is significant,<br />
these results suggest that the association between <strong>liberalisation</strong> <strong>and</strong> <strong>growth</strong> is stronger<br />
when a sample includes data from before 1970 <strong>and</strong> the 1990s. The results also imply that<br />
for data from the 1970s <strong>and</strong> 2000s the association is less strong compared to the 1980s.<br />
If we do accept the above interpretation, our findings indicate that financial <strong>liberalisation</strong><br />
measures may have been more effective before the 1970s <strong>and</strong> during the 1990s than at<br />
other times. Intuitively, this seems to make sense. First of all, before the 1970s most<br />
25 The Hausman test showed that both the fixed- <strong>and</strong> the r<strong>and</strong>om-effects model are consistent.<br />
Since the r<strong>and</strong>om-effects model is more efficient, we use the r<strong>and</strong>om-effects specification.<br />
26 We acknowledge that the goodness of fit of the model is rather low. The R-squared runs from<br />
0.00 for the specification in column (1) to 0.17 in the full specification presented in column (8).<br />
Therefore, we suggest the results of the different specifications presented in Table 4.5 should be<br />
interpreted with caution.<br />
27 The dummy variable for the 1970s is close to being significant at the 10 percent level.
<strong>Financial</strong> <strong>liberalisation</strong> <strong>and</strong> <strong>economic</strong> <strong>growth</strong>: a <strong>meta</strong>-<strong>analysis</strong><br />
governments were still pursuing strong financial repression policies (McKinnon 1973, Shaw<br />
1973). Under these circumstances, financial <strong>liberalisation</strong> policies appear to be conducive<br />
to higher allocative efficiency of financial resources, thereby contributing to <strong>economic</strong><br />
<strong>growth</strong>. Moreover, financial <strong>liberalisation</strong> policies were carried out most eagerly from the<br />
late 1980s through the 1990s. In developing economies several governments undertook<br />
these policies, in combination with other <strong>liberalisation</strong> measures, as part of IMF <strong>and</strong> World<br />
Bank financed structural adjustment programmes. In developed countries during the 1990s<br />
financial <strong>liberalisation</strong> was also part of a wave of <strong>economic</strong> reform based on a more<br />
liberalist view of the role of markets versus governments. The findings for the 1970s<br />
support the view that in both these decades financial <strong>liberalisation</strong> may have gone too far,<br />
leading to crisis, or at least a slowdown of <strong>economic</strong> <strong>growth</strong>. In the 1970s, several<br />
countries carried out sweeping <strong>liberalisation</strong> programmes that led to <strong>economic</strong> crisis;<br />
examples of this are Chile, Argentina <strong>and</strong> Uruguay (Diaz-Alej<strong>and</strong>ro 1985). The results for<br />
the 2000s may indicate that by this time most countries had already experienced financial<br />
<strong>liberalisation</strong> in most areas, so that the marginal effect of further <strong>liberalisation</strong> was only<br />
modest.<br />
Column (6) shows the results when we include variables relating to various other dataset<br />
characteristics (i.e. no. of countries, working paper, primary data <strong>and</strong> panel) <strong>and</strong><br />
variables relating to the estimation procedure (i.e. endogeneity <strong>and</strong> fixed effects). None<br />
of these variables appear to be statistically significant, indicating that these study<br />
characteristics cannot explain differences between studies regarding the reported<br />
relationship between financial <strong>liberalisation</strong> <strong>and</strong> <strong>economic</strong> <strong>growth</strong>.<br />
Finally, we explore whether financial <strong>liberalisation</strong> effects vary with the set of relevant<br />
conditioning variables. Column (7) shows that most conditioning variables do not turn out<br />
to be statistically significant, i.e. results for the relationship between financial<br />
<strong>liberalisation</strong> <strong>and</strong> <strong>growth</strong> reported in different studies do not seem to be conditional on<br />
the macro<strong>economic</strong> <strong>and</strong> socio-<strong>economic</strong> variables we take into account in the <strong>analysis</strong>. The<br />
only exception is the variable financial depth (a measure of the level of financial system<br />
development), which turns out to be negative <strong>and</strong> statistically significant. This suggests<br />
that studies taking into account this variable in their <strong>analysis</strong> report lower t-statistics for<br />
the relationship between <strong>liberalisation</strong> <strong>and</strong> <strong>growth</strong>. Given the above interpretation of the<br />
results, this would support the idea that for countries with less developed financial<br />
systems, financial <strong>liberalisation</strong> may have more value in terms of stimulating <strong>economic</strong><br />
<strong>growth</strong> as compared to countries with more developed financial systems. An alternative<br />
interpretation of the results may be that if financial <strong>liberalisation</strong> improves financial<br />
depth, the lower t-statistic with respect to the relationship between financial<br />
<strong>liberalisation</strong> <strong>and</strong> <strong>growth</strong> (i.e. the direct effect), may be compensated by an increase in<br />
the indirect effect of financial <strong>liberalisation</strong> on <strong>growth</strong> via an increase in financial depth<br />
(Doucouliagos <strong>and</strong> Ulubaşoğlu 2008).<br />
4.4.1.2 Robustness checks<br />
We perform a number of robustness checks. First of all, in column (8) of Table 4.5 we<br />
simultaneously include variables referring to different time periods, data characteristics,<br />
estimation procedures <strong>and</strong> conditioning variables, as an elaboration of the findings<br />
reported in the columns (5) to (7). The results in column (8) are similar to those reported<br />
in columns (5) to (7) although the time-period dummy for the period for the 1990s is no<br />
longer statistically significant.<br />
Second, column (9) of the table shows the results when we drop all variables with a t-value<br />
below or equal to 1 from the specification presented in column (8). With respect to the<br />
time-period dummies, the results are very comparable to those presented in column (5),<br />
i.e. the dummy variables for the period before the 1970s <strong>and</strong> for the 1990s are positive<br />
<strong>and</strong> significant, whereas for the 1970s <strong>and</strong> 2000s the dummy variables are negative <strong>and</strong><br />
31
32<br />
4.Meta-<strong>analysis</strong><br />
significant in case of the dummy variable for the 1970s 28 , providing further ground for the<br />
hypothesis that the relationship between financial <strong>liberalisation</strong> <strong>and</strong> <strong>growth</strong> may be time<br />
dependent.<br />
Third, we redo the <strong>analysis</strong> presented in Table 4.5, but remove the top <strong>and</strong> bottom 5<br />
percent of the observations from our dataset to check for the impact of outliers. The<br />
number of observations drops from 441 to 399. The results are reported in Appendix 4.2<br />
Table A4.2. As the table shows the results are similar to those reported in Table 4.5.<br />
Column (1) indicates that the unconditional mean is again highly significant <strong>and</strong> does not<br />
change much as compared to the value presented in Table 4.5 (1.42 versus 1.40). As was<br />
mentioned above, since the constant reflects the average t-statistic of the financial<br />
<strong>liberalisation</strong> proxy, our results imply that we can reject the null hypothesis that the<br />
average t-statistic equals 0. However, we cannot reject the null hypothesis that the<br />
average t-statistic equals 1.66. Hence, these results again indicate that, on average, there<br />
is a positive effect of financial <strong>liberalisation</strong> on <strong>growth</strong>, although the significance of this<br />
effect appears to be weak.<br />
The results presented in the remaining columns of table A4.2 are comparable to those<br />
presented in columns (2) to (9) in Table 4.5. Thus, different types of countries, various<br />
dataset characteristics (such as the number of countries, primary data, <strong>and</strong> panel data)<br />
<strong>and</strong> variables relating to the estimation procedure (i.e. endogeneity <strong>and</strong> fixed effects) do<br />
not appear to be statistically significant, indicating that these study characteristics cannot<br />
explain differences across studies regarding the reported relationship between financial<br />
<strong>liberalisation</strong> <strong>and</strong> <strong>economic</strong> <strong>growth</strong> in a sample of studies that excludes outliers. With<br />
respect to time-period effects, Table A4.2 shows that the dummy variable for the 1970s is<br />
negative <strong>and</strong> significant. This is in line with findings reported in Table 4.5, suggesting that<br />
the positive association between financial <strong>liberalisation</strong> <strong>and</strong> <strong>economic</strong> <strong>growth</strong> is weakest in<br />
the 1970s. Regarding the question of whether financial <strong>liberalisation</strong> effects vary with<br />
conditioning variables, the results in Table A4.2 confirm our finding on the importance of<br />
the level of development of the financial system, as the variable financial depth is again<br />
negative <strong>and</strong> significant. In contrast to the results in Table 4.5, Table A4.2 shows that the<br />
variable working paper is also significant <strong>and</strong> has a negative sign, indicating that in our<br />
sample of studies working papers report lower t-statistics than journal papers do for the<br />
relationship between financial <strong>liberalisation</strong> <strong>and</strong> <strong>economic</strong> <strong>growth</strong>.<br />
As a fourth robustness check, we rerun the <strong>analysis</strong> of Table 4.5, but this time we focus on<br />
observations that are based on de jure measures. The results are reported in Appendix 4.2,<br />
Table A4.3. The <strong>analysis</strong> is based on a sample of 264 t-statistics collected from 41 different<br />
studies. Column (1) indicates that the unconditional mean equals 1.55, which is higher<br />
than for the full sample of t-statistics (i.e. including those referring to studies using de<br />
facto measures of financial <strong>liberalisation</strong>). This result again implies that we can reject the<br />
null hypothesis that the average t-statistic equals 0 <strong>and</strong> that we cannot reject the null<br />
hypothesis that the average t-statistic equals 1.66. Hence, on average, there is a positive<br />
effect of financial <strong>liberalisation</strong> on <strong>growth</strong>.<br />
Most of the results in Table A4.3 are comparable to those presented in Table 4.5, i.e.<br />
different types of countries, dataset characteristics <strong>and</strong> variables relating to the<br />
estimation procedure are not statistically significant, indicating that for the subsample of<br />
studies using de jure measures of financial <strong>liberalisation</strong> most study characteristics also<br />
cannot explain differences between studies about the reported relationship between<br />
financial <strong>liberalisation</strong> <strong>and</strong> <strong>economic</strong> <strong>growth</strong>. With respect to time-period effects, Table<br />
A4.3 shows that the dummy variable for the 1990s is positive <strong>and</strong> significant. This is in line<br />
with findings reported in Table 4.5. Moreover, the dummy for the 1970s period is negative<br />
<strong>and</strong> significant, which also is in line with findings reported in Table 4.5. Taken together,<br />
the findings for the time-period dummy variables in Tables 4.5 <strong>and</strong> A4.3 allow us to<br />
28 The dummy variable for the 1990s is close to being significant at the 10 percent level.
<strong>Financial</strong> <strong>liberalisation</strong> <strong>and</strong> <strong>economic</strong> <strong>growth</strong>: a <strong>meta</strong>-<strong>analysis</strong><br />
conclude that the positive association between financial <strong>liberalisation</strong> <strong>and</strong> <strong>economic</strong><br />
<strong>growth</strong> is strongest for the 1990s <strong>and</strong> weakest in the 1970s. The results in Table A4.3 also<br />
confirm our previous finding about the importance of the level of development of the<br />
financial system, as the variable financial depth is again negative <strong>and</strong> significant. In<br />
contrast to the results in Table 4.5, Table A4.3 shows that the variable working paper is<br />
also significant <strong>and</strong> has a negative sign, indicating that in a sample of studies using de jure<br />
measures of financial <strong>liberalisation</strong>, working papers report lower t-statistics than journal<br />
papers do for the relationship between financial <strong>liberalisation</strong> <strong>and</strong> <strong>economic</strong> <strong>growth</strong>.<br />
The fifth robustness check that we perform relates to the working papers included in the<br />
dataset. One may argue that, at least potentially, working papers included in our dataset<br />
that have been published during the last few years may become journal articles in the<br />
future. This would mean that these papers are counted as working papers in our <strong>analysis</strong>,<br />
whereas in fact they should have been counted as published papers. To control for this<br />
potential bias we delete all working papers that have been published during the period<br />
2008–11 from our dataset. This reduces the sample to 405 t-statistics collected from 54<br />
different studies. The results are reported in Appendix 4.2, Table A4.4. As the table shows,<br />
the results are qualitatively similar to those discussed above. We note that in this<br />
robustness check the variable working paper is not significant, which contrasts with the<br />
results reported for the robustness checks presented in Tables A4.2 <strong>and</strong> A4.3, but<br />
corroborates the base results presented in Table 4.5.<br />
Finally, we take out the study by Tornell et al. (2004). Table 4.2 <strong>and</strong> the box plot in Figure<br />
4.3 show that this study appears to be an outlier: the highest mean of the t-statistics<br />
reported in other studies is 5.7 (i.e. Bekaert et al. 2003), whereas the mean t-statistic<br />
reported in the Tornell et al. (2004) study is 10.8. To control for the fact that this study<br />
may be considered an outlier, we remove it from our dataset <strong>and</strong> rerun the <strong>analysis</strong><br />
presented in Table 4.5 as well as all the robustness checks discussed above. The results are<br />
qualitatively similar to those discussed above. 29<br />
Summarising the results presented in Table 4.5 <strong>and</strong> outcomes of the various robustness<br />
checks, the following two main findings st<strong>and</strong> out. First, there is a positive, albeit weakly<br />
significant, effect of financial <strong>liberalisation</strong> on <strong>economic</strong> <strong>growth</strong>. Second, with respect to<br />
the variables that are supposed to explain the heterogeneity of financial <strong>liberalisation</strong><br />
coefficients, we find negative <strong>and</strong> robust results for the time-period variable capturing<br />
financial <strong>liberalisation</strong> policies carried out during the 1970s <strong>and</strong> the variable indicating<br />
whether or not studies takes into account a measure of the level of development of the<br />
financial system.<br />
29 The results are not reported, but are available upon request.<br />
33
Table 4.5: Meta-regression <strong>analysis</strong><br />
Variable (1) (2) a (3) b (4) c (5) d (6) (7) (8) d (9) d<br />
constant 1.42*** 1.57*** 1.43*** 1.81*** 1.15** 1.35* 2.18*** 1.78 1.55**<br />
(0.30) (0.55) (0.47) (0.55) (0.57) (0.76) (0.58) (1.12) (0.62)<br />
de jure -0.24<br />
(0.67)<br />
mixed -0.13<br />
(0.65)<br />
dc 0.30<br />
(0.38)<br />
dejure × oecd -0.93<br />
(1.17)<br />
de jure × dc -0.89<br />
(0.83)<br />
de jure × mixed -0.43<br />
(0.64)<br />
de facto × dc 0.40<br />
(0.33)<br />
de facto × mixed -0.51<br />
(0.73)<br />
before 1970 0.83* 0.66* 0.75*<br />
34<br />
(0.43) (0.40) (0.42)<br />
1970s -0.64 -0.76* -0.77*<br />
4.Meta-<strong>analysis</strong>
<strong>Financial</strong> <strong>liberalisation</strong> <strong>and</strong> <strong>economic</strong> <strong>growth</strong>: a <strong>meta</strong>-<strong>analysis</strong><br />
35<br />
(0.40) (0.44) (0.44)<br />
1990s 0.92** 0.86 1.00**<br />
(0.46) (0.60) (0.51)<br />
2000s -0.93* -0.96* -0.82<br />
(0.52) (0.57) (0.53)<br />
working paper -0.66 -0.62<br />
(0.75) (0.70)<br />
no. of countries 0.00 0.00<br />
(0.00) (0.00)<br />
panel data 1.02 1.18<br />
(1.28) (1.36)<br />
endogeneity -0.03 -0.13<br />
(0.30) (0.32)<br />
fixed effect -0.64 -0.48<br />
(0.71) (0.68)<br />
primary data -0.02 -0.09<br />
(0.30) (0.30)<br />
financial crisis -0.19 -0.39<br />
(0.86) (0.74)<br />
inflation -0.43 -0.57 -0.52<br />
(0.41) (0.36) (0.41)<br />
depth -0.85*** -0.86*** -0.78***<br />
(0.25) (0.24) (0.25)<br />
government -0.58 -0.48 -0.39
36<br />
(0.43) (0.44) (0.41)<br />
trade 0.66 0.65 0.63<br />
(0.45) (0.42) (0.41)<br />
investment -0.38 -0.32<br />
(0.47) (0.39)<br />
institutions -0.49 -0.40 -0.50<br />
(0.37) (0.36) (0.34)<br />
human capital 0.04 0.07<br />
(0.42) (0.44)<br />
social indicators -0.22 -0.17<br />
(0.58) (0.55)<br />
� u 1.97 1.97 2.01 2.02 1.87 1.95 1.99 1.84 1.81<br />
� e 1.95 1.94 1.94 1.92 1.95 1.95 1.95 1.95 1.95<br />
R² 0.00 0.03 0.01 0.01 0.07 0.05 0.07 0.19 0.12<br />
M 441 441 441 441 441 441 441 441 441<br />
N 60 60 60 60 60 60 60 60 60<br />
4.Meta-<strong>analysis</strong><br />
Notes: St<strong>and</strong>ard error given in parentheses. ***, **, * denotes significance at the 1%, 5% <strong>and</strong>10% level, respectively. There are no observations<br />
in the case of oecd x equity (where equity refers to studies using one of the measures of equity market <strong>liberalisation</strong>) <strong>and</strong> well as bank x<br />
mixed (where bank refers to studies using one of the measures of bank sector <strong>liberalisation</strong>). M refers to the total number of observations<br />
<strong>and</strong> N represents the total number of studies. � e <strong>and</strong> � u st<strong>and</strong> for the within-study <strong>and</strong> between-study st<strong>and</strong>ard deviations, respectively.<br />
We report these st<strong>and</strong>ard deviations in the table, because, by comparing the between- <strong>and</strong> within-study variances, we can gauge the<br />
proportion of the total variance of the residuals that is explained by studies. To be more precise, the larger the between-study variance<br />
relative to the within-study variance, the stronger the influence of effects shared by studies (such as author, time period, etc.). In our case,<br />
the two variance components have similar magnitudes implying that effects shared by studies account for approximately half of the total<br />
variance. In the estimations, we account for clustering of the st<strong>and</strong>ard errors.
<strong>Financial</strong> <strong>liberalisation</strong> <strong>and</strong> <strong>economic</strong> <strong>growth</strong>: a <strong>meta</strong>-<strong>analysis</strong><br />
a The de facto measure has been omitted. The constant represents the effect of the omitted variable.<br />
b The oecd variable has been omitted. The constant represents the effect of the omitted variable.<br />
c The interaction de facto × oecd has been omitted. The constant represents the effect of the omitted variable.<br />
d The 1980s indicator has been omitted.<br />
37
4.4.2 Publication selection bias<br />
38<br />
4.Meta-<strong>analysis</strong><br />
In this section, we want to look at our dataset from a different angle. Therefore,<br />
we assume that our data potentially suffer from publication selection bias.<br />
Moreover, we assume that such a bias is captured by a systematic relationship<br />
between the effect size <strong>and</strong> the st<strong>and</strong>ard error. According to Florax (2001)<br />
‘[p]ublication bias occurs when only studies reporting statistically significant<br />
results or with a “reasonable” magnitude of the effect size are being published,<br />
<strong>and</strong> others are not.’ Publication bias is a crucial issue because it implies that the<br />
studies included in a <strong>meta</strong>-<strong>analysis</strong> might be a biased sample of the overall<br />
population of studies leading to biased conclusions about the relationship between<br />
financial <strong>liberalisation</strong> <strong>and</strong> <strong>economic</strong> <strong>growth</strong>. Only if it was possible to identify<br />
enough studies that have not gone through an official revision process by some<br />
university, institution, journal or the like, could the problem of publication bias be<br />
disregarded, because in this situation we could directly compare the studies of<br />
published <strong>and</strong> unpublished outcomes (Borenstein et al. 2009).<br />
It is controversial whether publication status is an adequate decision criterion for<br />
the inclusion of a study in a <strong>meta</strong>-<strong>analysis</strong>. On the one h<strong>and</strong>, peer review ensures<br />
that a study adheres to certain quality st<strong>and</strong>ards. On the other h<strong>and</strong>, the<br />
distinction between journal articles, working papers <strong>and</strong> unpublished papers is to<br />
some extent arbitrary, since the contribution of an unpublished paper from a topranked<br />
university in terms of methodological rigour as well as value-addition might<br />
be higher than that of an article in a low-ranked journal (Borenstein et al. 2009,<br />
Florax 2001). In the end, the whole issue of publication bias boils down to the<br />
problem that a <strong>meta</strong>-<strong>analysis</strong> tends to under- or over-estimate the true relationship<br />
between two variables if the included studies are a biased sample. Therefore, we<br />
want to scrutinise our <strong>meta</strong>-sample for the presence of publication selection bias.<br />
Before we continue explaining our statistical approach, we would like to emphasise<br />
that there is considerable discussion in the literature about the proper<br />
measurement of publication selection bias, especially with respect to the<br />
implementation of the concept in statistical tests. Such tests implicitly assume that<br />
selection is driven by statistical significance, but this does not need to be the case,<br />
as there may be other sources of selection bias. Moreover, instead of publication<br />
selection bias, a <strong>meta</strong>-sample may be characterised by true heterogeneity, such as<br />
heterogeneity between small <strong>and</strong> large studies (i.e. smaller studies might have<br />
been conducted for particular reasons). We are therefore somewhat sceptical<br />
regarding the value of testing for publication selection bias. Nonetheless, for the<br />
sake of completeness of our <strong>analysis</strong>, we perform a statistical test of publication<br />
selection bias, using a methodology that has been widely used in the literature. In<br />
an early contribution, Egger et al. (1997) established the following regression<br />
model in order to detect publication selection bias:<br />
(2)<br />
coefficient � � � � se � u ,<br />
i<br />
0 1 i i<br />
where coefficienti denotes the regression coefficient of the original study <strong>and</strong> sei is<br />
the corresponding sample st<strong>and</strong>ard error. Without publication selection bias, � 1<br />
will be 0. This implies that a systematic relationship between coefficient <strong>and</strong> se<br />
does not exist. In other words, a non-zero � 1 indicates to what extent studies<br />
based on smaller samples tend to search for larger coefficients in order to make up<br />
for larger st<strong>and</strong>ard errors (Doucouliagos <strong>and</strong> Stanley 2009).<br />
We would like to state that the measurement of publication selection bias using<br />
the above methodology may be potentially problematic in the context of our <strong>meta</strong>-
<strong>Financial</strong> <strong>liberalisation</strong> <strong>and</strong> <strong>economic</strong> <strong>growth</strong>: a <strong>meta</strong>-<strong>analysis</strong><br />
sample, since different studies have used variables of financial <strong>liberalisation</strong> that<br />
may (widely) diverge in terms of their dimensions (i.e. ratios versus absolute<br />
values). This implies that st<strong>and</strong>ard errors will also differ depending on the<br />
underlying type of variable used. These differences will, however, be unrelated to<br />
potential publication selection bias. Thus, it might be difficult to distinguish<br />
dimensional effects from publication selection bias.<br />
Doucouliagos <strong>and</strong> Stanley (2009) suggest dividing equation (2) by the st<strong>and</strong>ard error<br />
( se i ) to remedy the problem of heteroscedastic error terms (ei). Heteroscedasticity<br />
is caused by research studies using different estimation methods, model<br />
specifications <strong>and</strong> sample sizes to explain the same relationship. Hence we rewrite<br />
equation (2) in the following way:<br />
(3)<br />
t � � � � 1/<br />
se � e .<br />
i<br />
1 0 i i<br />
Next, if we take into account the two-level structure of our data, it is possible to<br />
represent model (3) as:<br />
(4)<br />
X l,<br />
ij Z p,<br />
j<br />
level 1: tij � � 1 j � �001/<br />
seij<br />
��<br />
�<br />
ij,<br />
l l ��<br />
� p p � e<br />
se se<br />
level 2: with � 1 j � � 00 � u0 j ,<br />
with tij denoting the i th t-statistic of study j. Note that the structure of model (4) is<br />
similar to that of model (1). Again, Z <strong>and</strong> X are vectors of conditioning variables<br />
explaining differences in the financial–<strong>liberalisation</strong> effect within <strong>and</strong> between<br />
studies. First, we will estimate the unconditional model. Second, we will estimate<br />
the conditional model including the variables from model (8) in section 4.4.<br />
In order to detect publication selection bias, we run a conventional t-test on � 00 . 30<br />
The underlying idea is that without publication selection bias, the t-statistic <strong>and</strong><br />
the st<strong>and</strong>ard error ( se ij ) should be inversely related through � 00 (in the<br />
unconditional model) which can be considered as the genuine effect of financial<br />
<strong>liberalisation</strong>. (Egger et al. 1997, Klomp <strong>and</strong> de Haan 2010). 31,32<br />
4.4.2.1. Results<br />
Table 4.4 presents the results on the basis of equation (4). We report results of<br />
r<strong>and</strong>om-effects estimation. In the case of the unconditional model (column 1), the<br />
coefficient of the inverse st<strong>and</strong>ard error is insignificant. To put it differently, we<br />
30 In the terminology of Egger et al. (1997) or Doucouliagos <strong>and</strong> Stanley (2009), this test is<br />
also called funnel graph asymmetry test (FAT).<br />
31<br />
Doucouliagos <strong>and</strong> Stanley (2009) refer to the t-test on � 00 as the precision effect test<br />
(PET).<br />
32 Note that Doucouliagos (2005) remains critical about the interpretation of 00<br />
� as the<br />
genuine effect.<br />
39<br />
ij<br />
ij
40<br />
4.Meta-<strong>analysis</strong><br />
find no evidence of a genuine association between financial <strong>liberalisation</strong> <strong>and</strong><br />
<strong>economic</strong> <strong>growth</strong>. Apparently, the estimation outcome is dominated by the<br />
constant which suggests that there is a systematic association between the<br />
coefficient <strong>and</strong> the st<strong>and</strong>ard error.<br />
It is of interest whether these findings persist if we include further conditioning<br />
variables (column 2). Concerning the interpretation of the results, the reader<br />
should recall that we interpreted the coefficients on the Z <strong>and</strong> X variables in Table<br />
4.4 in terms of t-statistics. Here, instead, these coefficients give us an indication<br />
of the corrected effect of financial <strong>liberalisation</strong> on <strong>economic</strong> <strong>growth</strong>. Hence, the<br />
overall effect of financial <strong>liberalisation</strong> is obtained by combining several factors<br />
(i.e. those that turn out to be significant).<br />
A first important result is that publication selection bias again is at work. Apart<br />
from that, the coefficient on the inverse st<strong>and</strong>ard error now appears to be<br />
significant. Thus, supposing that the variables in X <strong>and</strong> Z were 0 (which means that,<br />
inter alia, data from the 1980s were used) financial <strong>liberalisation</strong> seems to have a<br />
positive, but small, effect on <strong>economic</strong> <strong>growth</strong>. In addition, we find significant<br />
coefficients on some additional variables. Controlling for financial development,<br />
investment <strong>and</strong> institutions reduces the significance of financial <strong>liberalisation</strong><br />
coefficient, whereas trade increases it. These findings support the view that<br />
financial development, institutions <strong>and</strong> investment are important channels through<br />
which financial <strong>liberalisation</strong> stimulates <strong>economic</strong> <strong>growth</strong>. Studies that address the<br />
endogeneity problem inherent in <strong>growth</strong> regressions report slightly larger tstatistics.<br />
The financial <strong>liberalisation</strong> effect appears to less significant in the case<br />
of working papers. Concerning the time periods, the significant coefficients flip<br />
sign vis-à-vis the results in Table 4.5 such that it becomes difficult to interpret<br />
them.<br />
Table 4.6: Publication selection bias<br />
1<br />
RE<br />
2 a<br />
RE<br />
constant 1.21*** 1.076***<br />
(0.32) (0.347)<br />
1 (se) 0.001 0.007*<br />
(0.001) (0.004)<br />
working paper (se) -0.006**<br />
(0.003)<br />
financial crisis (se) 0.005<br />
(0.005)<br />
inflation (se) -0.001<br />
(0.002)<br />
depth (se) -0.002*<br />
(0.001)<br />
government (se) -0.002<br />
(0.002)
<strong>Financial</strong> <strong>liberalisation</strong> <strong>and</strong> <strong>economic</strong> <strong>growth</strong>: a <strong>meta</strong>-<strong>analysis</strong><br />
41<br />
1<br />
RE<br />
2 a<br />
RE<br />
trade (se) 0.0031*<br />
(0.002)<br />
investment (se) -0.004**<br />
(0.002)<br />
institutions (se) -0.002*<br />
(0.001)<br />
human capital (se) 0.003<br />
(0.003)<br />
social indicators (se) -0.001<br />
(0.002)<br />
no. of countries (se) 0.000<br />
(0.000)<br />
panel data (se) 0.000<br />
endogeneity (se) 0.002*<br />
(0.001)<br />
fixed effect (se) 0.002<br />
(0.003)<br />
primary data (se) -0.001<br />
(0.002)<br />
before 1970 (se) 0.002<br />
(0.004)<br />
1970s (se) 0.005*<br />
(0.002)<br />
1990s (se) -0.005*<br />
(0.003)<br />
2000s (se) -0.003<br />
(0.003)<br />
M 441 435<br />
N 60 58<br />
� u 1.95 2.07<br />
� e 1.94 1.93<br />
R² 0.02 0.11<br />
Notes: st<strong>and</strong>ard error given in parentheses. ***, **, * denotes significance at the<br />
1%, 5% <strong>and</strong> 10% level, respectively. M refers to the total number of observations<br />
<strong>and</strong> N represents the total number of studies. � e <strong>and</strong>� u st<strong>and</strong> for the within-
42<br />
4.Meta-<strong>analysis</strong><br />
study <strong>and</strong> between-study st<strong>and</strong>ard deviations, respectively. In the estimation,<br />
we account for clustering of the st<strong>and</strong>ard errors.<br />
a The 1980s indicator has been omitted.<br />
Based on our findings, <strong>and</strong> accepting that the methodology used correctly<br />
addresses publication selection bias, we conclude that publication bias might play<br />
a role in the financial <strong>liberalisation</strong> literature. Apart from that, we find evidence of<br />
a slightly positive, genuine relationship between financial <strong>liberalisation</strong> <strong>and</strong><br />
<strong>economic</strong> <strong>growth</strong>. Moreover, various factors impact the significance of the<br />
<strong>liberalisation</strong>–<strong>growth</strong> nexus. However, relative to the results presented in Table<br />
4.5, financial development is the only variable that is found to robustly lower the<br />
<strong>liberalisation</strong>–<strong>growth</strong> nexus. But, as discussed above, we remain sceptical of the<br />
validity of for publication selection bias using methodologies presented in the<br />
existing literature.
<strong>Financial</strong> <strong>liberalisation</strong> <strong>and</strong> <strong>economic</strong> <strong>growth</strong>: a <strong>meta</strong>-<strong>analysis</strong><br />
5. Conclusions <strong>and</strong> final remarks<br />
Since the early 1970s, the relationship between financial <strong>liberalisation</strong> <strong>and</strong><br />
<strong>economic</strong> <strong>growth</strong> has been hotly debated, in both in policy <strong>and</strong> academic circles.<br />
On the one h<strong>and</strong>, this is due to the fact that during the past two decades many<br />
countries have liberalised their domestic financial markets. On the other h<strong>and</strong>,<br />
views with respect to the impact of these <strong>liberalisation</strong> policies differ. Whereas<br />
some have claimed that <strong>liberalisation</strong> of financial markets contributes to the<br />
efficiency with which these markets can transform saving into investment, which<br />
ultimately fosters <strong>economic</strong> <strong>growth</strong>, others have pointed out that these<br />
<strong>liberalisation</strong>s have contributed to various financial <strong>and</strong> <strong>economic</strong> crises in the<br />
past. Several papers have investigated the nature of the relationship between<br />
financial <strong>liberalisation</strong> <strong>and</strong> <strong>economic</strong> <strong>growth</strong>. The evidence that emerges from<br />
these studies remains inconclusive.<br />
In this study we aimed at providing a systematic <strong>analysis</strong> of the empirical literature<br />
by conducting a <strong>meta</strong>-<strong>analysis</strong> of the relationship between financial <strong>liberalisation</strong><br />
<strong>and</strong> <strong>economic</strong> <strong>growth</strong> based on 60 empirical studies <strong>and</strong> 441 t-statistics. As far as<br />
we know, this is the first study using <strong>meta</strong>-<strong>analysis</strong> as a tool to investigate the<br />
financial <strong>liberalisation</strong>–<strong>growth</strong> nexus.<br />
In the <strong>meta</strong>-analytical framework we have used, we focus on explaining the<br />
heterogeneity of results regarding the relationship between financial <strong>liberalisation</strong><br />
<strong>and</strong> <strong>economic</strong> <strong>growth</strong> reported in the studies in our sample. In particular, we focus<br />
on a number of study-, data- <strong>and</strong> method-specific characteristics, such as the way<br />
financial <strong>liberalisation</strong> has been measured (de jure versus de facto measures),<br />
whether the study has been published as a working paper or as a peer-reviewed<br />
academic journal article, the time periods covered by the original studies (i.e.<br />
before the 1970s, <strong>and</strong> in the 1980s, 1990s <strong>and</strong> 2000s), the type of countries<br />
included in the <strong>analysis</strong> (developed countries, developing countries <strong>and</strong> a mixed set<br />
of developed <strong>and</strong> developing countries), the number of countries taken into<br />
account in the <strong>analysis</strong>, whether or not panel data are used, whether potential<br />
endogeneity problems have been treated, whether or not fixed effects are used,<br />
<strong>and</strong> whether or not a set of relevant conditioning variables has been included (i.e.<br />
measures of the development of the financial sector, the openness of the real<br />
economy, the size of the government, life expectancy, population <strong>growth</strong>,<br />
investment, inflation, property rights, law <strong>and</strong> order, human capital <strong>and</strong> financial<br />
crises).<br />
The <strong>meta</strong>-regression <strong>analysis</strong> provided the following main results. First, the<br />
unconditional mean of the t-statistic of the financial <strong>liberalisation</strong> variable equals<br />
1.42, which is highly significant. Using a chi-squared test we also have to reject the<br />
null hypothesis that the average t-statistic equals 1.96. However, we cannot reject<br />
the null hypothesis that the average t-statistic equals 1.66. Hence, we conclude<br />
that although our results indicate that, on average, there is a positive effect of<br />
financial <strong>liberalisation</strong> on <strong>growth</strong>, the significance of this effect is only weak.<br />
Second, for most of the variables that may help explaining the heterogeneity of<br />
results about the relationship between financial <strong>liberalisation</strong> <strong>and</strong> <strong>economic</strong> <strong>growth</strong><br />
we do not find any significant results. There are two exceptions. Our <strong>analysis</strong><br />
suggests that data from the 1970s generate more negative financial <strong>liberalisation</strong><br />
coefficients which suggests that financial <strong>liberalisation</strong> policies carried out during<br />
the 1970s seem to have a stronger negative relationship with <strong>growth</strong>. Moreover,<br />
our results show that studies that take into account a measure of the level of<br />
43
44<br />
5. Conclusions <strong>and</strong> final remarks<br />
development of the financial system report lower t-statistics for the relationship<br />
between <strong>liberalisation</strong> <strong>and</strong> <strong>growth</strong>. When we take publication selection bias into<br />
account, financial development still seems to lower the significance of the<br />
financial <strong>liberalisation</strong> coefficient, whereas the coefficient capturing data from the<br />
1970s flips sign. Another outcome of this last exercise is that we find several<br />
additional factors to impact on the <strong>liberalisation</strong>–<strong>growth</strong> nexus. Apart from these<br />
results we find suggestive evidence that publication bias matters in the<br />
<strong>liberalisation</strong>–<strong>growth</strong> literature.<br />
We have two reasons for being sceptical about the validity of testing for<br />
publication selection bias, at least in our sample of studies. First, the measurement<br />
<strong>and</strong> the operationalisation of the concept in statistical tests have been debated<br />
recently. Existing tests implicitly assume that selection is driven by statistical<br />
significance, but this does not need to be the case, as there may be other sources<br />
of selection bias. Second, the measurement of publication selection available in<br />
the literature seems, at least potentially, problematic in the context of the studies<br />
in our sample, since different studies used variables of financial <strong>liberalisation</strong> that<br />
may (widely) diverge in terms of their dimensions (i.e. ratios versus absolute<br />
values). This boils down to observing differences in st<strong>and</strong>ard errors, depending on<br />
the underlying type of variable used, which may be unrelated to potential<br />
publication selection bias.<br />
We would like to make some final qualifying remarks regarding the use of <strong>meta</strong>analytical<br />
methods to investigate studies on the relationship between financial<br />
<strong>liberalisation</strong> <strong>and</strong> <strong>economic</strong> <strong>growth</strong>. First of all, we point out that the quality of<br />
the <strong>meta</strong>-<strong>analysis</strong> we carry out in this study is as good as the quality of the<br />
empirical <strong>analysis</strong> of the underlying empirical literature. The studies we use in our<br />
dataset are carried out in the country <strong>growth</strong> regression tradition. This literature<br />
has received considerable criticism recently, especially with respect to potential<br />
endogeneity problems. Solving these problems in a convincing <strong>and</strong> satisfying way<br />
has proven to be very difficult in this str<strong>and</strong> of literature. Moreover, country<br />
<strong>growth</strong> regressions are often criticised for their lack of a clear theoretical<br />
framework underlying the empirical model. In the context of the relationship<br />
between financial <strong>liberalisation</strong> <strong>and</strong> <strong>economic</strong> <strong>growth</strong>, this point has been made<br />
explicit by Henry (2007).<br />
Second, the use of <strong>meta</strong>-regression <strong>analysis</strong> is complicated by the fact that, as has<br />
already been mentioned, different studies use different measures <strong>and</strong> dimensions<br />
of financial <strong>liberalisation</strong>. This renders a comparison of results across studies more<br />
difficult. Put another way, using <strong>meta</strong>-<strong>analysis</strong> works best if studies use the same<br />
measures <strong>and</strong> dimensions with respect to the variable(s) of interest. Another<br />
complicating factor is that the studies in our sample use data from a limited set of<br />
observations, i.e. countries in the world, <strong>and</strong> all data used come from similar<br />
sources, such as IMF <strong>and</strong> World Bank databases.<br />
Third, a number of interesting issues discussed in the literature on the relationship<br />
between financial <strong>liberalisation</strong> <strong>and</strong> <strong>economic</strong> <strong>growth</strong> are not taken into account in<br />
this <strong>meta</strong>-<strong>analysis</strong>. The reason for this is that the low number of studies<br />
investigating these issues does not allow for a meaningful <strong>meta</strong>-regression <strong>analysis</strong>.<br />
One example is the discussion on the short- <strong>and</strong> long-term effects of financial<br />
<strong>liberalisation</strong>. A few researchers have recently argued that opposing <strong>economic</strong><br />
forces in the short <strong>and</strong> the long run result in a non-monotonic relationship between<br />
financial <strong>liberalisation</strong> <strong>and</strong> <strong>economic</strong> <strong>growth</strong>. However, this str<strong>and</strong> of research does<br />
not produce clear results. On the one h<strong>and</strong>, there is the hypothesis of ‘short-run<br />
gain, long-run pain’ caused by financial <strong>liberalisation</strong>. Bussière <strong>and</strong> Fratzscher<br />
(2008) argue that this trade-off is attributable to the features of short-term
<strong>Financial</strong> <strong>liberalisation</strong> <strong>and</strong> <strong>economic</strong> <strong>growth</strong>: a <strong>meta</strong>-<strong>analysis</strong><br />
financial flows. In the five years following financial <strong>liberalisation</strong>, countries benefit<br />
from investment booms <strong>and</strong> debt inflows, whereas in the long run these countries<br />
will typically end up in a debt trap. Furthermore, the authors point out that<br />
appropriate institutions attenuate the adverse effects of unbounded financial<br />
flows. On the other h<strong>and</strong>, some authors find evidence of a ‘short-run pain <strong>and</strong><br />
long-run gain’ of financial <strong>liberalisation</strong>. 33 For instance, Kaminsky <strong>and</strong> Schmukler<br />
(2008) examine interdependencies between financial <strong>liberalisation</strong> <strong>and</strong> financial<br />
cycles. They suggest that, on impact, financial <strong>liberalisation</strong> provokes financial<br />
instability <strong>and</strong> crises owing to weak institutions. Over the medium to long run,<br />
however, unrestricted capital flows stimulate institutional development such that<br />
financial markets can stabilise the economy. Further research is needed to be able<br />
to draw meaningful conclusions on the different effects of the short- <strong>and</strong> long-term<br />
run <strong>growth</strong> effects of financial <strong>liberalisation</strong>, for example by employing <strong>meta</strong>regression<br />
<strong>analysis</strong>.<br />
Notwithst<strong>and</strong>ing these qualifying remarks, we do think that the <strong>meta</strong>-<strong>analysis</strong> we<br />
carry out in this paper is highly valuable, as it provides the most comprehensive<br />
overview of the literature on the relationship between financial <strong>liberalisation</strong> <strong>and</strong><br />
<strong>growth</strong> available to date. Moreover, it is the first systematic <strong>analysis</strong> of this<br />
literature. The future challenge will be to improve upon the <strong>meta</strong>-analytical<br />
techniques we may use to extend the <strong>analysis</strong> of the financial <strong>liberalisation</strong>–<strong>growth</strong><br />
nexus.<br />
33 Campos et al. (2011) investigate the links between political instability, financial<br />
development <strong>and</strong> <strong>economic</strong> <strong>growth</strong> in the case of Argentina. They find that financial<br />
development can be detrimental to <strong>growth</strong> in the short run <strong>and</strong> <strong>growth</strong> supportive in the<br />
long run. However, the negative consequences of political instability may outweigh such<br />
positive effects. The authors do not consider financial <strong>liberalisation</strong>. Nevertheless, their<br />
findings add to the literature which attempts to gauge the <strong>growth</strong> effects of finance over<br />
different time horizons.<br />
45
6. References<br />
46<br />
References<br />
Abiad A, Mody A (2005) <strong>Financial</strong> reform: what shakes it? What shapes it? American<br />
Economic Review 95(1): 66–88.<br />
Abiad A, Detragiache E, Tressel T (2010) A new database of financial reforms. IMF<br />
Staff Papers 57(2): 281–302.<br />
Abreu M, de Groot HLF, Florax RJGM. (2005) A <strong>meta</strong>-<strong>analysis</strong> of beta-convergence:<br />
the legendary two-percent. Journal of Economic Surveys 19(3): 389–420.<br />
Andersen T, Tarp F (2003) <strong>Financial</strong> liberalization, financial development <strong>and</strong><br />
<strong>economic</strong> <strong>growth</strong> in LDCs. Journal of International Development 15(2): 189–209.<br />
Bekaert G, Harvey CR, Lundblad CT (2003) Equity market liberalization in emerging<br />
markets. Journal of <strong>Financial</strong> Research 26(3): 275–299.<br />
Bekaert G, Harvey CR, Lundblad CT (2005) Does financial liberalization spur<br />
<strong>growth</strong>? Journal of <strong>Financial</strong> Economics 77(1): 3–55.<br />
Berthélemy J–C, Varoudakis A (1996) Models of financial development <strong>and</strong> <strong>growth</strong>:<br />
a survey of recent literature. In: Hermes N, Lensink R (eds) <strong>Financial</strong> development<br />
<strong>and</strong> <strong>economic</strong> <strong>growth</strong>: theory <strong>and</strong> experiences from developing countries. London:<br />
Routledge, pages 7–34.<br />
Boot AWA (2000) Relationship banking: what do we know? Journal of <strong>Financial</strong><br />
Intermediation 9(1): 7–25.<br />
Borenstein M, Hedges LV, Higgins JPT, Ruthstein HR (2009) Introduction to <strong>meta</strong><strong>analysis</strong>.<br />
Oxford: John Wiley <strong>and</strong> Sons.<br />
Brownbridge M, Kirkpatrick C (2000) <strong>Financial</strong> regulation in developing countries.<br />
Journal of Development Studies 37(1): 1–24.<br />
Bussière M, Fratzscher M (2008) <strong>Financial</strong> openness <strong>and</strong> <strong>growth</strong>: short-run gain,<br />
long-run pain? Review of International Economics 16(1): 69–95.<br />
Campos NF, Karanasos MG, Tan B (2012) Two to tangle: financial development,<br />
political instability <strong>and</strong> <strong>economic</strong> <strong>growth</strong> in Argentina, Journal of Banking <strong>and</strong><br />
Finance 36(1): 290–304 .<br />
De Dominicis L, Florax RJGM, de Groot HLF (2008) A <strong>meta</strong>-<strong>analysis</strong> on the<br />
relationship between income inequality <strong>and</strong> <strong>economic</strong> <strong>growth</strong>. Scottish Journal of<br />
Political Economy 55(5): 654–682.<br />
Demirgüç-Kunt A, Detragiache E (1998) The determinants of banking crises in<br />
developing <strong>and</strong> developed countries. IMF Staff Papers 45(1): 81-109.<br />
Diamond DW, Dybvig PH (1983) Bank runs, deposit insurance, <strong>and</strong> liquidity. Journal<br />
of Political Economy 91(3): 410–419.<br />
Diaz-Alej<strong>and</strong>ro C (1985) Goodbye financial crisis, hello financial crash. Journal of<br />
Development Economics 19(1): 1–24.<br />
Doucouliagos C (2005) Publication bias in the <strong>economic</strong> freedom <strong>and</strong> <strong>economic</strong><br />
<strong>growth</strong> literature. Journal of Economic Surveys 19(3): 367–387.<br />
Doucouliagos H, Paldam M (2007) Aid effectiveness on <strong>growth</strong>: a <strong>meta</strong> study.<br />
European Journal of Political Economy 24(1): 1–24.
<strong>Financial</strong> <strong>liberalisation</strong> <strong>and</strong> <strong>economic</strong> <strong>growth</strong>: a <strong>meta</strong>-<strong>analysis</strong><br />
Doucouliagos H, Paldam M (2009) The aid effectiveness literature: the sad results<br />
of 40 years of research. Journal of Economic Surveys 23(3): 433–461.<br />
Doucouliagos H, Stanley TD (2009) Publication selection bias in minimum-wage<br />
research: a <strong>meta</strong>-regression <strong>analysis</strong>. British Journal of Industrial Relations 47(2):<br />
406–428.<br />
Doucouliagos H, Ulubaşoğlu MA (2008) Democracy <strong>and</strong> <strong>economic</strong> <strong>growth</strong>: a <strong>meta</strong><strong>analysis</strong>.<br />
American Journal of Political Science 52(1): 61–83.<br />
Edison HJ, Levine R, Ricci L, Slok T (2002) International financial integration <strong>and</strong><br />
<strong>economic</strong> <strong>growth</strong>. Journal of International Money <strong>and</strong> Finance 21(6): 749-776.<br />
Edison HJ, Klein MW, Luca AR, Sløk T (2004) Capital account liberalization <strong>and</strong><br />
<strong>economic</strong> performance: survey <strong>and</strong> synthesis. IMF Staff Papers 51(2): 220–256.<br />
Egger M, Davey Smith G, Schneider M, Minder C (1997) Bias in <strong>meta</strong>-<strong>analysis</strong><br />
detected by a simple graphical test. British Medical Journal 316: 629–634.<br />
Eichengreen B (2001) Capital account liberalization: what do cross-country studies<br />
tell us? The World Bank Economic Review 15(3): 341–365.<br />
Florax RJGM (2001) Methodological pitfalls in <strong>meta</strong>-<strong>analysis</strong>: publication bias. VU<br />
University Amsterdam, Faculty of Economics, Business Administration <strong>and</strong><br />
Econometrics.<br />
Florax RJGM, de Groot, HLF, de Mooij RA (2002) Meta-<strong>analysis</strong>: a tool for upgrading<br />
inputs of macro<strong>economic</strong> policy models. Tinbergen Discussion Paper, 2002-041/3,<br />
Rotterdam-Amsterdam.<br />
Fry MJ (1995) Money, interest, <strong>and</strong> banking in <strong>economic</strong> development, 2nd edn.<br />
Baltimore, Maryl<strong>and</strong>: Johns Hopkins University Press.<br />
Fry MJ (1997) In favour of financial <strong>liberalisation</strong>. Economic Journal 107(442): 754-<br />
770.<br />
Gibson HD, Tsakalotos E (1994) The scope <strong>and</strong> limits of financial liberalization in<br />
developing countries: a critical survey. Journal of Development Studies 30(3): 578–<br />
628.<br />
Hellmann T, Murdock K, Stiglitz JE (1996) Deposit mobilization through financial<br />
restraint. In: Hermes N, Lensink R (eds) <strong>Financial</strong> development <strong>and</strong> <strong>economic</strong><br />
<strong>growth</strong>: theory <strong>and</strong> experiences from developing countries. London: Routledge,<br />
pages 219–246.<br />
Hellmann T, Murdock K, Stiglitz JE (1997) <strong>Financial</strong> restraint: toward a new<br />
paradigm. In: Aoki M, Kim H-K, Okuno-Fujiwara M (eds) The role of government in<br />
East Asian <strong>economic</strong> development: comparative institutional <strong>analysis</strong>. Oxford:<br />
Clarendon Press, pages 163–207.<br />
Hellmann T, Murdock K, Stiglitz JE (2000) Liberalization, moral hazard in banking<br />
<strong>and</strong> prudential regulation: are capital requirements enough? American Economic<br />
Review 90(1): 147–65.<br />
Henry PB (2003) Capital-account liberalization, the cost of capital, <strong>and</strong> <strong>economic</strong><br />
<strong>growth</strong>. The American Economic Review 93(2): 91–96.<br />
Henry PB (2007) Capital account liberalization: theory, evidence, <strong>and</strong> speculation.<br />
Journal of Economic Literature 45(4): 887–935.<br />
47
48<br />
References<br />
Hermes N, Lensink R (2008) Does financial liberalization influence saving,<br />
investment <strong>and</strong> <strong>economic</strong> <strong>growth</strong>: evidence from 25 emerging market economies,<br />
1973–1996. In: Guha-Khasnobis B, Mavrotas G (eds) <strong>Financial</strong> development,<br />
institutions, <strong>growth</strong> <strong>and</strong> poverty reduction. Basingstoke: Palgrave MacMillan, pages<br />
164–189.<br />
Huang Y (2009) The political economy of financial reform: are Abiad <strong>and</strong> Mody<br />
right? Journal of Applied Econometrics 24(7): 1207–1213.<br />
Kaminsky GL, Chmukler SL (2003) Short-run pain, long-run gain: the effects of<br />
financial liberalization. IMF Working Paper 03/34. Washington, DC: International<br />
Monetary Fund.<br />
Kaminsky GL, Schmukler SL (2008) Short-run pain, long-run gain: the effects of<br />
financial liberalization. Review of Finance 12(2): 253–292.<br />
Klomp J, de Haan J (2010) Inflation <strong>and</strong> central bank independence: a <strong>meta</strong>regression<br />
<strong>analysis</strong>. Journal of Economic Surveys 24(4): 593–621.<br />
Koetse MJ, de Groot HLF, Florax RJGM (2009) A <strong>meta</strong>-<strong>analysis</strong> of the investmentuncertainty<br />
relationship. Southern Economic Journal 76(1): 283–306.<br />
Kose MA, Prasad ES, Rogoff K, Wei S-J (2006a) <strong>Financial</strong> globalization: a<br />
reappraisal. IMF Working Paper 06/189. Washington, DC: International Monetary<br />
Fund.<br />
Kose MA, Prasad ES, Terrones, ME (2006b) How do trade <strong>and</strong> financial integration<br />
affect the relationship between <strong>growth</strong> <strong>and</strong> volatility? Journal of International<br />
Economics 69(1): 176–202.<br />
Kose MA, Prasad ES, Rogoff K, Wei S-J (2010) <strong>Financial</strong> globalization <strong>and</strong> <strong>economic</strong><br />
policies. In: Rodrik D, Rosenzweig M (eds) H<strong>and</strong>book of development <strong>economic</strong>s,<br />
Volume 5, pages 4283–4359.<br />
Lane PR, Milesi-Ferretti GM (2001) The external wealth of nations: measures of<br />
foreign assets <strong>and</strong> liabilities for industrial <strong>and</strong> developing countries. Journal of<br />
International Economics 55: 263–294.<br />
Levine R (1997) <strong>Financial</strong> development <strong>and</strong> <strong>economic</strong> <strong>growth</strong>: views <strong>and</strong> agenda.<br />
Journal of Economic Literature 35(2): 688–726.<br />
Levine R, Renelt D (1992) A sensitivity <strong>analysis</strong> of cross-country <strong>growth</strong> regressions.<br />
American Economic Review 82(4): 942–963.<br />
McKinnon RI (1973) Money <strong>and</strong> capital in <strong>economic</strong> development. Washington, DC:<br />
The Brookings Institution.<br />
Mookerjee R (2006) A <strong>meta</strong>-<strong>analysis</strong> of the export <strong>growth</strong> hypothesis. Economics<br />
Letters 91(3): 395–401.<br />
Nijkamp P, Poot J (2004) Meta-<strong>analysis</strong> of the effect of fiscal policies on long-run<br />
<strong>growth</strong>. European Journal of Political Economy 20(1): 91–124.<br />
Pang F, Drummond M, Song F (1999) The use of <strong>meta</strong>-<strong>analysis</strong> in <strong>economic</strong><br />
evaluation. University of York, Centre for Health Economics.<br />
Prasad E, Rogoff K, Wei S, Kose MA (2003) Effects of financial globalization on<br />
developing countries: some empirical evidence. IMF Occasional Paper 220.<br />
Washington, DC: International Monetary Fund.<br />
Quinn DP (1997) The correlates of change in international financial regulation.<br />
American Political Science Review 91(3): 531–551.
<strong>Financial</strong> <strong>liberalisation</strong> <strong>and</strong> <strong>economic</strong> <strong>growth</strong>: a <strong>meta</strong>-<strong>analysis</strong><br />
Quinn DP, Toyoda AM (2008) Does capital account liberalization lead to <strong>growth</strong>?<br />
The Review of <strong>Financial</strong> Studies 21(3): 1403–1449.<br />
Raudenbush SW, Bryk, AS (2002) Hierarchical linear model: applications <strong>and</strong> data<br />
<strong>analysis</strong> methods. Newbury Park, California: Sage Publications.<br />
Sala-i-Martin XX (1997) I just ran four million regressions. NBER Working Paper No.<br />
6252. Cambridge, Massachusetts: National Bureau of Economic Research.<br />
Sala-i-Martin XX, Doppelhofer G, Miller R (2004) Determinants of long-term <strong>growth</strong>:<br />
a Bayesian averaging of classical estimates (BACE) approach. American Economic<br />
Review 94(4): 813–835.<br />
Shaw ES (1973) <strong>Financial</strong> deepening in <strong>economic</strong> development. New York: Oxford<br />
University Press.<br />
Singh A (2007) <strong>Financial</strong> <strong>liberalisation</strong>, stock markets <strong>and</strong> <strong>economic</strong> development.<br />
Economic Journal 107(442) 771-782.<br />
Snijders TAB, Bosker RJ (2004) Multilevel <strong>analysis</strong>: an introduction to basic <strong>and</strong><br />
advanced multilevel modeling. London: Sage Publications.<br />
Stanley TD (2001) Wheat from chaff: <strong>meta</strong>-<strong>analysis</strong> as quantitative literature<br />
review. Journal of Economic Perspectives 15(3): 131–150.<br />
Stiglitz JE (2000) Capital market liberalization, <strong>economic</strong> <strong>growth</strong>, <strong>and</strong> instability.<br />
World Development 28(6): 1075–1086.<br />
Stiglitz JE, Weiss A (1981) Credit rationing in markets with imperfect information.<br />
American Economic Review 71(3): 393–410.<br />
Summers LH (2000) International financial crises: causes, prevention, <strong>and</strong> cures.<br />
American Economic Review 90(2): 1–16.<br />
Tornell A, Westermann F, Martinez, L (2004) The positive link between financial<br />
liberalization, <strong>growth</strong> <strong>and</strong> crises. NBER Working Paper No. 10293. Cambridge,<br />
Massachusetts: National Bureau of Economic Research.<br />
49
Appendices<br />
Appendix 1.1: Authorship of this report<br />
The authors of this report are:<br />
Silke Bumann, University of Groningen, the Netherl<strong>and</strong>s.<br />
Niels Hermes, Université Libre de Bruxelles, Belgium.<br />
Robert Lensink, Wageningen University, the Netherl<strong>and</strong>s.<br />
Review group<br />
50<br />
Appendix 1.1: Authors of this report<br />
This review group is made up of researchers from the Faculty of Economics <strong>and</strong><br />
Business, University of Groningen, the Netherl<strong>and</strong>s, namely Silke Bumann, Niels<br />
Hermes <strong>and</strong> Robert Lensink. Niels Hermes is also affiliated to the Solvay Brussels<br />
School of Economics <strong>and</strong> Management, Université Libre de Bruxelles, Belgium.<br />
Robert Lensink is also affiliated to the Development Economics Group, Wageningen<br />
University, the Netherl<strong>and</strong>s.<br />
Advisory Group<br />
We have identified Birte Snilstveit <strong>and</strong> Henri de Groot as academic peer reviewers<br />
for their expertise in systematic reviewing to advise us on this project.<br />
This report should be cited as:<br />
Bumann S, Hermes N, Lensink, R (2012) <strong>Financial</strong> <strong>liberalisation</strong> <strong>and</strong> <strong>economic</strong><br />
<strong>growth</strong>: a <strong>meta</strong>-<strong>analysis</strong>. Technical report. London: EPPI-Centre, Social Science<br />
Research Unit, Institute of Education, University of London.<br />
ISBN: 978-1-907345-40-1<br />
Contact details<br />
Niels Hermes<br />
Faculty of Economics <strong>and</strong> Business, University of Groningen,<br />
PO Box 800, 9700 AV Groningen,<br />
the Netherl<strong>and</strong>s.<br />
Tel.: +31 50 3634863 Fax: +31 50 3637356<br />
Email: c.l.m.hermes@rug.nl
<strong>Financial</strong> <strong>liberalisation</strong> <strong>and</strong> <strong>economic</strong> <strong>growth</strong>: a <strong>meta</strong>-<strong>analysis</strong><br />
Conflicts of interest<br />
None of the authors have any financial interests in this review topic.<br />
Acknowledgements<br />
We gratefully acknowledge the DFID Systematic Reviews programme for financial<br />
support to carry out this research. We would like to thank Birte Snilstveit, Henri de<br />
Groot <strong>and</strong> an anonymous reviewer from DFID for very useful comments on earlier<br />
drafts of this paper. We thank Marco Della Pia for his assistance with the data<br />
collection.<br />
51
Appendix 4.1: Studies included in the <strong>meta</strong>-sample<br />
Table A4.1: Studies included in the <strong>meta</strong>-sample<br />
# Author(s) Title Published by/in<br />
1 Achy L (2005) <strong>Financial</strong> liberalization, saving, investment <strong>and</strong><br />
<strong>growth</strong> in MENA countries<br />
2 Arteta C, Eichengreen B,<br />
Wyplosz C (2001)<br />
When does capital account liberalization help more<br />
than it hurts?<br />
3 Bailliu JN (2000) Private capital flows, financial development, <strong>and</strong><br />
<strong>economic</strong> <strong>growth</strong> in developing countries<br />
4 Bekaert G, Harvey CR,<br />
Lundblad C (2001)<br />
5 Bekaert G, Harvey CR,<br />
Lundblad C (2003)<br />
6 Bekaert G, Harvey CR,<br />
Lundblad C (2005)<br />
52<br />
Appendix 4.1: Studies included in the <strong>meta</strong>-sample<br />
EconWPA (Finance).<br />
NBER Working Papers (8414).<br />
Bank of Canada.<br />
Emerging equity markets <strong>and</strong> <strong>economic</strong> development Journal of Development Economics<br />
66(2): 465–504.<br />
Equity market liberalization in emerging markets Journal of <strong>Financial</strong> Research 2(3):<br />
275–299.<br />
Does financial liberalization spur <strong>growth</strong>? Journal of <strong>Financial</strong> Economics 77(1):<br />
3–55.<br />
7 Ben Gamra S (2009) Does financial liberalization matter for emerging East<br />
Asian economies <strong>growth</strong>?<br />
8 Ben Naceur S Ghazouani S,<br />
Omran M (2008)<br />
9 Bonfiglioli A, Mendicino C<br />
(2004)<br />
Does stock market liberalization spur financial <strong>and</strong><br />
<strong>economic</strong> development in the MENA region?<br />
<strong>Financial</strong> liberalization, bank crises <strong>and</strong> <strong>growth</strong>:<br />
assessing the links<br />
International Review of Economics<br />
<strong>and</strong> Finance 18(3): 392–403.<br />
Journal of Comparative Economics<br />
36(4): 673–693.<br />
Department of Economics <strong>and</strong><br />
Business, Universitat Pompeu Fabra.
<strong>Financial</strong> <strong>liberalisation</strong> <strong>and</strong> <strong>economic</strong> <strong>growth</strong>: a <strong>meta</strong>-<strong>analysis</strong><br />
# Author(s) Title Published by/in<br />
10 Bordo MD, Meissner C<br />
M (2007)<br />
Foreign capital <strong>and</strong> <strong>economic</strong> <strong>growth</strong> in the first era<br />
of globalization<br />
11 Bussière M, Fratzscher M (2008) <strong>Financial</strong> openness <strong>and</strong> <strong>growth</strong>: short-run gain, longrun<br />
pain?<br />
12 Butkiewicz J, Yanikkaya H<br />
(2008)<br />
13 Calderon C, Loayza N, Schmitt-<br />
Hebbel K (2005)<br />
14 Choong CK, Baharumsha AZ,<br />
Yusop Z, Habibullah MS (2010)<br />
Capital account openness, international trade, <strong>and</strong><br />
<strong>economic</strong> <strong>growth</strong>: a cross-country empirical<br />
investigation<br />
53<br />
NBER Working Papers (13577).<br />
Review of International Economics<br />
16(1): 69–95.<br />
Emerging Markets Finance <strong>and</strong> Trade<br />
44(2): 15–38.<br />
Does openness imply greater exposure? Policy Research Working Paper Series<br />
3733, The World Bank.<br />
Private capital flows, stock market <strong>and</strong> <strong>economic</strong><br />
<strong>growth</strong> in developed <strong>and</strong> developing countries: a<br />
comparative <strong>analysis</strong><br />
15 De Ávila Torrijos DR (2003) Finance <strong>and</strong> <strong>growth</strong> in the EU – new evidence from the<br />
<strong>liberalisation</strong> <strong>and</strong> harmonisation of the banking<br />
industry<br />
16 De Gregorio J (1998) <strong>Financial</strong> integration, financial development <strong>and</strong><br />
<strong>economic</strong> <strong>growth</strong><br />
17 Dreher A (2006) Does globalization affect <strong>growth</strong>? Evidence from a new<br />
index of globalization<br />
18 Durham JB (2004) Absorptive capacity <strong>and</strong> the effects of foreign direct<br />
investment <strong>and</strong> equity foreign portfolio investment on<br />
<strong>economic</strong> <strong>growth</strong><br />
Japan <strong>and</strong> the World Economy 22(2):<br />
107–117.<br />
ECB Working Paper Series 266.<br />
Estudios de Economia 26(2 Year 19):<br />
137–161.<br />
Applied Economics, 38(10): 1091–<br />
1110.<br />
European Economic Review 48(2):<br />
285–306.
# Author(s) Title Published by/in<br />
19 Edison HJ, Levine R, Ricci L,<br />
Slok T (2002)<br />
20 Edison HJ, Klein MW, Ricci LA,<br />
Slok, T (2004)<br />
International financial integration <strong>and</strong> <strong>economic</strong><br />
<strong>growth</strong><br />
Capital account liberalization <strong>and</strong> <strong>economic</strong><br />
performance: survey <strong>and</strong> synthesis<br />
21 Edwards S (2001) Capital mobility <strong>and</strong> <strong>economic</strong> performance: are<br />
emerging economies different?<br />
22 Edwards S (2004) <strong>Financial</strong> openness, sudden stops, <strong>and</strong> currentaccount<br />
reversals.<br />
23 Eichengreen B. Leblang D (2003) Capital account <strong>liberalisation</strong> <strong>and</strong> <strong>growth</strong>: was Mr.<br />
Mahathir right?<br />
24 Francois JF, Schuknecht L<br />
(1999)<br />
25 Fuchs-Schuendeln, N, Funke N<br />
(2004)<br />
Trade in financial services: procompetitive effects<br />
<strong>and</strong> <strong>growth</strong> performance<br />
Stock market <strong>liberalisation</strong>s: financial <strong>and</strong><br />
macro<strong>economic</strong> implications<br />
26 Garita G (2009) How does financial openness affect <strong>economic</strong><br />
<strong>growth</strong> <strong>and</strong> its components?<br />
27 Haveman JD, Lei V, Netz JS<br />
(2001)<br />
International integration <strong>and</strong> <strong>growth</strong>: A survey <strong>and</strong><br />
empirical investigation<br />
28 Hermes N, Lensink R (2008) Does financial <strong>liberalisation</strong> influence saving,<br />
investment <strong>and</strong> <strong>economic</strong> <strong>growth</strong>? evidence from 25<br />
emerging market economies, 1973-96<br />
54<br />
Appendix 4.1: Studies included in the <strong>meta</strong>-sample<br />
Journal of International Money <strong>and</strong><br />
Finance 21(6): 749-776<br />
IMF Staff Papers 51(2): 220–256.<br />
NBER Working Papers (8076) .<br />
NBER Working Papers (10277).<br />
International Journal of Finance <strong>and</strong><br />
Economics 8(3): 205-224.<br />
CEPR Discussion Papers No. 2144.<br />
Review of World Economics 40(3):<br />
730-761.<br />
MPRA Paper (20099).<br />
Review of Development Economics<br />
5(2): 289-311.<br />
ULB - Universite Libre de Bruxelles<br />
(2013/14403)
<strong>Financial</strong> <strong>liberalisation</strong> <strong>and</strong> <strong>economic</strong> <strong>growth</strong>: a <strong>meta</strong>-<strong>analysis</strong><br />
# Author(s) Title Published by/in<br />
29 Holl<strong>and</strong> M ,Vilela Vieira F<br />
(2005)<br />
Foreign liquidity, <strong>economic</strong> opening <strong>and</strong> <strong>growth</strong> in<br />
Latin American economies<br />
30 Honig A (2008) Addressing causality in the effect of capital account<br />
<strong>liberalisation</strong> on <strong>growth</strong><br />
55<br />
Revista Brasileira de Economia 59(2):<br />
267-289.<br />
Journal of Macro<strong>economic</strong>s 30(4),<br />
1602-1616.<br />
31 IMF (2007) Reaping the benefits of financial globalization IMF Occasional Paper 264.<br />
32 IMF (2008) Structural reforms <strong>and</strong> <strong>economic</strong> performance in<br />
advanced <strong>and</strong> developing countries<br />
33 Klein W (2003) Capital account openness <strong>and</strong> the varieties of <strong>growth</strong><br />
experience<br />
34 Klein MW (2005) Capital account <strong>liberalisation</strong>, institutional quality<br />
<strong>and</strong> <strong>economic</strong> <strong>growth</strong>: theory <strong>and</strong> evidence<br />
35 Kose MA, Prasad ES,Terrones<br />
ME (2006)<br />
36 Kose MA, Prasad ES, Taylor,<br />
AD (2011)<br />
How do trade <strong>and</strong> financial integration affect the<br />
relationship between <strong>growth</strong> <strong>and</strong> volatility?<br />
Thresholds in the process of international financial<br />
integration<br />
IMF Occasional Paper 268.<br />
National Bureau of Economic<br />
Research (9500).<br />
National Bureau of Economic<br />
Research (11112).<br />
Journal of International Economics<br />
69(1): 176-202.<br />
Journal of International Money <strong>and</strong><br />
Finance 30(1): 147-179<br />
37 Lee I, Shin JH (2008) <strong>Financial</strong> <strong>liberalisation</strong>, crises, <strong>and</strong> <strong>economic</strong> <strong>growth</strong> Asian Economic Papers 7(1): 106-115.<br />
38 Levine R, Zervos S (1998) Stock markets, banks, <strong>and</strong> <strong>economic</strong> <strong>growth</strong> American Economic Review 88(3):<br />
537-558.<br />
39 Masten AB, Coricelli F, Masten<br />
I (2008)<br />
Non-linear <strong>growth</strong> effects of financial development:<br />
does financial integration matter?<br />
Journal of International Money <strong>and</strong><br />
Finance 27(2): 295-313.
# Author(s) Title Published by/in<br />
40 McLean B, Shrestha S (2002) International financial <strong>liberalisation</strong> <strong>and</strong> <strong>economic</strong><br />
<strong>growth</strong><br />
41 Mody A, Abiad A, Leigh D<br />
(2007)<br />
International finance <strong>and</strong> income convergence: Europe<br />
is different<br />
42 Mukerji P (2009) Ready for capital account convertibility?<br />
43 Neto D, Veiga FJ (2008) <strong>Financial</strong> globalization, convergence <strong>and</strong> <strong>growth</strong><br />
44 Prasad E, Rogoff K, Wei S ,<br />
Kose MA (2003)<br />
45 Prasad E, Rajan RG,<br />
Subramanian A (2007)<br />
Effects of financial globalization on developing<br />
countries: some empirical evidence<br />
56<br />
Appendix 4.1: Studies included in the <strong>meta</strong>-sample<br />
RBA Research Discussion Papers.<br />
IMF Working Papers 07/64.<br />
Journal of International Money <strong>and</strong><br />
Finance 28(6): 1006–1021.<br />
NIPE Working Papers 07/2008.<br />
IMF Occasional Paper 220.<br />
Foreign capital <strong>and</strong> <strong>economic</strong> <strong>growth</strong> National Bureau of Economic<br />
Research (13619).<br />
46 Quinn DP (1997) The correlates of change in international financial<br />
regulation<br />
47 Quinn DP, Toyoda A (2001) How <strong>and</strong> where capital account <strong>liberalisation</strong> leads to<br />
<strong>economic</strong> <strong>growth</strong><br />
48 Quinn DP (2003) Capital account <strong>liberalisation</strong> <strong>and</strong> financial<br />
globalization, 1890-1999: a synoptic view<br />
The American Political Science<br />
Review 91(3): 531-551.<br />
Unpublished manuscript.<br />
International Journal of Finance <strong>and</strong><br />
Economics 8(3): 189–204.<br />
49 Quinn DP, Toyoda A (2008) Does Capital Account Liberalisation Lead To Growth? The Review of <strong>Financial</strong> Studies<br />
21(3): 1403-1449.
<strong>Financial</strong> <strong>liberalisation</strong> <strong>and</strong> <strong>economic</strong> <strong>growth</strong>: a <strong>meta</strong>-<strong>analysis</strong><br />
# Author(s) Title Published by/in<br />
50 Ranciere R, Tornell A,<br />
Westermann F (2006)<br />
Decomposing the effects of financial <strong>liberalisation</strong>:<br />
crises vs. <strong>growth</strong><br />
51 Razin A, Rubinstein Y (2004) Growth effects of exchange rate regimes <strong>and</strong><br />
capital account <strong>liberalisation</strong> in the presence of<br />
crises: a nuanced view<br />
52 Reisen H, Soto M (2001) Which types of capital inflows foster developingcountry<br />
<strong>growth</strong>?<br />
53 Rincon H (2007) <strong>Financial</strong> globalization, <strong>economic</strong> <strong>growth</strong>, <strong>and</strong><br />
macro<strong>economic</strong> volatility<br />
57<br />
Journal of Banking <strong>and</strong> Finance<br />
30(12): 3331-3348.<br />
NBER Working Paper (10555).<br />
International Finance 4(1): 1-14.<br />
Borradores de Economía No 430,<br />
Banco de la República Colombia.<br />
54 Rodrik D,Subramanian A (2009) Why did financial globalization disappoint? IMF Staff Papers, 56(1): 112-138.<br />
55 Romero-Avila D (2009) Liberalisation of capital controls <strong>and</strong> interest rates<br />
restrictions in the EU-15: did it affect <strong>economic</strong><br />
<strong>growth</strong>?<br />
56 Santana JR, Garcia F (2004) New evidence of the impact of capital account<br />
<strong>liberalisation</strong> on <strong>economic</strong> <strong>growth</strong><br />
57 Schularick M, Steger T (2006) Does financial integration spur <strong>economic</strong> <strong>growth</strong>? new<br />
evidence from the first era of financial globalization<br />
58 Stoianov M (2008) The impact of the trade <strong>and</strong> financial openness on the<br />
<strong>economic</strong> <strong>growth</strong> in the countries from the Eastern<br />
Europe<br />
59 Tornell A, Westermann F,<br />
Martinez L (2004)<br />
The positive link between financial <strong>liberalisation</strong>,<br />
<strong>growth</strong> <strong>and</strong> crises<br />
60 World Bank (2001) Global development finance 2001: building coalitions<br />
for effective development finance<br />
Applied <strong>Financial</strong> Economics 19(20):<br />
1625-1648.<br />
Econometric Society (86).<br />
CESifo Group Munic<br />
(1691).<br />
Advances in Economic <strong>and</strong> <strong>Financial</strong><br />
Research - DOFIN Working Paper<br />
Series 14, Bucharest University of<br />
Economics.<br />
NBER Working paper (10293).<br />
The World Bank.
Appendix 4.2: Results from additional robustness checks<br />
Table A4.2: Omission of top <strong>and</strong> bottom 5 percent of observations<br />
58<br />
Appendix 4.2: Results from additional robustness checks<br />
Variable (1) (2) a (3) b (4) c (5) d (6) (7) (8) d<br />
constant 1.40*** 1.76*** 1.54*** 1.75*** 1.08** 1.68*** 2.07*** 1.93**<br />
(0.20) (0.33) (0.30) (0.42) (0.50) (0.41) (0.4) (0.88)<br />
de jure -0.59<br />
(0.45)<br />
mixed -0.29<br />
(0.33)<br />
dc 0.16<br />
(0.33)<br />
dejure × oecd -0.47<br />
(1.11)<br />
de jure × dc -0.82<br />
(0.77)<br />
de jure × mixed -0.64<br />
(0.53)<br />
de facto × dc 0.51*<br />
(0.28)<br />
de facto × mixed -0.18<br />
(0.38)<br />
before 1970 0.67* 0.58<br />
(0.39) (0.39)
<strong>Financial</strong> <strong>liberalisation</strong> <strong>and</strong> <strong>economic</strong> <strong>growth</strong>: a <strong>meta</strong>-<strong>analysis</strong><br />
1970s -0.41* -0.50**<br />
59<br />
(0.23) (0.24)<br />
1990s 0.72 0.70<br />
(0.51) (0.58)<br />
2000s -0.63 -0.58<br />
(0.40) (0.39)<br />
working paper -0.74* -0.71*<br />
(0.39) (0.38)<br />
no. of countries -0.00 0.00<br />
(0.00) (0.00)<br />
panel data 0.27 0.32<br />
(0.45) (0.41)<br />
endogeneity -0.06 -0.14<br />
(0.21) (0.22)<br />
fixed effect -0.19 -0.02<br />
(0.44) (0.35)<br />
primary data 0.12 0.06<br />
(0.28) (0.29)<br />
financial crisis -0.38 -0.47<br />
(0.73) (0.69)<br />
inflation -0.14 -0.25<br />
(0.34) (0.29)<br />
depth -0.71*** -0.72***<br />
(0.19) (0.21)
60<br />
Appendix 4.2: Results from additional robustness checks<br />
government -0.31 -0.20<br />
(0.34) (0.32)<br />
trade 0.43 0.45<br />
(0.40) (0.35)<br />
investment -0.08 -0.06<br />
(0.26) (0.24)<br />
institutions -0.41 -0.39<br />
(0.35) (0.34)<br />
human capital -0.04 -0.02<br />
(0.27) (0.27)<br />
social indicators -0.50 -0.45<br />
� u<br />
�<br />
e<br />
(0.43) (0.38)<br />
1.44 1.44 1.47 1.49 1.33 1.41 1.43 1.28<br />
1.34 1.31 1.33 1.30 1.34 1.35 1.33 1.34<br />
R² 0.00 0.03 0.01 0.02 0.04 0.03 0.05 0.13<br />
M 399 399 399 399 399 399 399 399<br />
N 60 60 60 60 60 60 60 60<br />
Notes: St<strong>and</strong>ard error given in parentheses. ***, **, * denotes significance at the 1%, 5% <strong>and</strong>10% level, respectively.<br />
There are no observations for oecd × equity (where equity refers to studies using one of the measures of equity market<br />
<strong>liberalisation</strong>) as well as bank ×x mixed (where bank refers to studies using one of the measures of bank sector<br />
<strong>liberalisation</strong>). M refers to the total number of observations <strong>and</strong> N represents the total number of studies. � e <strong>and</strong> � u<br />
st<strong>and</strong> for the within-study <strong>and</strong> between-study st<strong>and</strong>ard deviations, respectively. In the estimations, we account for<br />
clustering of the st<strong>and</strong>ard errors.
<strong>Financial</strong> <strong>liberalisation</strong> <strong>and</strong> <strong>economic</strong> <strong>growth</strong>: a <strong>meta</strong>-<strong>analysis</strong><br />
a The de facto measure has been omitted. The constant represents the effect of the omitted variable.<br />
b The oecd variable has been omitted. The constant represents the effect of the omitted variable.<br />
c The interaction de facto × oecd has been omitted. The constant represents the effect of the omitted variable.<br />
d The 1980s indicator has been omitted.<br />
61
Table A4.3: Meta-regression <strong>analysis</strong> for the de jure measure<br />
Variable (1) (2) a (3) b (4) (5) (6) c<br />
constant 1.55*** 1.78*** 0.77 1.67*** 2.41*** 1.79**<br />
(0.30) (0.57) (0.55) (0.61) (0.65) (0.81)<br />
mixed -0.22<br />
(0.64)<br />
dc -0.40<br />
(0.53)<br />
before 1970 0.53 0.36<br />
62<br />
Appendix 4.2: Results from additional robustness checks<br />
(0.55) (0.45)<br />
1970s -0.69** -0.84***<br />
(0.32) (0.31)<br />
1990s 1.18*** 1.05***<br />
(0.35) (0.36)<br />
2000s -0.07 0.08<br />
(0.53) (0.55)<br />
working paper -1.42** -1.40**<br />
(0.61) (0.57)<br />
no. of countries 0.00 0.01<br />
(0.01) (0.01)<br />
panel data 0.20 0.25<br />
(0.54) (0.51)
<strong>Financial</strong> <strong>liberalisation</strong> <strong>and</strong> <strong>economic</strong> <strong>growth</strong>: a <strong>meta</strong>-<strong>analysis</strong><br />
Variable (1) (2) a (3) b (4) (5) (6) c<br />
endogeneity 0.31 0.27<br />
63<br />
(0.26) (0.28)<br />
fixed effect 0.41 0.67<br />
(0.49) (0.42)<br />
primary data -0.42 -0.50<br />
(0.53) (0.56)<br />
financial crisis -0.88 -1.27<br />
(1.02) (0.99)<br />
inflation -0.04 -0.13<br />
(0.39) (0.33)<br />
depth -0.64** -0.74***<br />
(0.25) (0.27)<br />
government -0.47 -0.52<br />
(0.50) (0.47)<br />
trade 0.14 0.14<br />
(0.37) (0.27)<br />
investment -0.01 0.08<br />
(0.42) (0.39)<br />
institutions -0.46 -0.44<br />
(0.47) (0.45)<br />
human capital 0.04 0.12<br />
(0.33) (0.40)
Variable (1) (2) a (3) b (4) (5) (6) c<br />
social indicators -0.56 -0.37<br />
� u<br />
� e<br />
64<br />
Appendix 4.2: Results from additional robustness checks<br />
(0.58) (0.49)<br />
1.84 1.89 1.72 1.73 1.87 1.62<br />
1.41 1.41 1.40 1.41 1.41 1.38<br />
R² 0.00 0.00 0.06 0.14 0.02 0.26<br />
M 264 264 264 264 264 264<br />
N 41 41 41 41 41 41<br />
Notes: St<strong>and</strong>ard error given in parentheses. ***, **, * denotes significance at the 1%, 5% <strong>and</strong>10% level,<br />
respectively. There are no observations for oecd × equity (where equity refers to studies using one<br />
of the measures of equity market <strong>liberalisation</strong>) <strong>and</strong> bank × mixed (where bank refers to studies<br />
using one of the measures of bank sector <strong>liberalisation</strong>). M refers to the total number of observations<br />
<strong>and</strong> N represents the total number of studies. <strong>and</strong> st<strong>and</strong> for the within-study <strong>and</strong> between-<br />
study st<strong>and</strong>ard deviations, respectively. In the estimations, we account for clustering of the<br />
st<strong>and</strong>ard errors.<br />
a The oecd variable has been omitted. The constant represents the effect of the omitted variable.<br />
b The 1980s indicator has been omitted.<br />
� �<br />
u<br />
e
<strong>Financial</strong> <strong>liberalisation</strong> <strong>and</strong> <strong>economic</strong> <strong>growth</strong>: a <strong>meta</strong>-<strong>analysis</strong><br />
Table A4.4: Omission of working papers after 2007<br />
Variable (1) (2) a (3) b (4) c (5) d (6) (7) (8) d<br />
constant 1.41*** 1.65*** 1.54*** 2.27*** 1.22** 1.52* 2.18*** 1.99*<br />
(0.32) (0.61) (0.55) (0.62) (0.59) (0.81) (0.62) (1.19)<br />
de jure -0.38<br />
(0.71)<br />
mixed -0.25<br />
(0.70)<br />
dc 0.16<br />
(0.48)<br />
dejure × oecd -1.38<br />
65<br />
(1.14)<br />
de jure × dc -1.47*<br />
(0.84)<br />
de jure × mixed -0.93<br />
(0.69)<br />
de facto × dc 0.03<br />
(0.46)<br />
de facto × mixed -0.89<br />
(0.74)<br />
before 1970 0.79* 0.61<br />
(0.41) (0.38)<br />
1970s -0.81* -0.85*
66<br />
Appendix 4.2: Results from additional robustness checks<br />
Variable (1) (2) a (3) b (4) c (5) d (6) (7) (8) d<br />
(0.44) (0.45)<br />
1990s 0.92** 0.85<br />
(0.45) (0.61)<br />
2000s -1.01* -0.93*<br />
(0.57) (0.53)<br />
working paper -0.69 -0.76<br />
(0.93) (0.82)<br />
no. of countries -0.00 -0.00<br />
(0.01) (0.01)<br />
panel data 1.11 1.15<br />
(1.44) (1.49)<br />
endogeneity -0.01 -0.10<br />
(0.33) (0.35)<br />
fixed effect -0.90 -0.67<br />
(0.82) (0.79)<br />
primary data -0.05 -0.13<br />
(0.33) (0.32)<br />
financial crisis -0.22 -0.35<br />
(0.85) (0.73)<br />
inflation -0.47 -0.63*<br />
(0.43) (0.36)<br />
depth -0.89*** -0.90***<br />
(0.26) (0.25)<br />
government -0.48 -0.39
<strong>Financial</strong> <strong>liberalisation</strong> <strong>and</strong> <strong>economic</strong> <strong>growth</strong>: a <strong>meta</strong>-<strong>analysis</strong><br />
Variable (1) (2) a (3) b (4) c (5) d (6) (7) (8) d<br />
67<br />
(0.45) (0.47)<br />
trade 0.72 0.73*<br />
(0.46) (0.42)<br />
investment -0.43 -0.30<br />
(0.49) (0.38)<br />
institutions -0.64 -0.52<br />
(0.40) (0.38)<br />
human capital -0.10 -0.05<br />
(0.45) (0.50)<br />
social indicators 0.10 0.16<br />
(0.59) (0.54)<br />
� u<br />
1.98 2.00 2.02 2.05 1.85 1.93 1.99 1.84<br />
�<br />
e<br />
2.00 1.99 2.00 1.97 2.00 2.00 2.00 2.00<br />
R² 0.00 0.02 0.02 0.01 0.07 0.07 0.09 0.20<br />
M 405 405 405 405 405 405 405 405<br />
N 54 54 54 54 54 54 54 54<br />
Notes: St<strong>and</strong>ard error given in parentheses. ***, **, * denotes significance at the 1%, 5% <strong>and</strong>10% level, respectively. There are no<br />
observations for oecd × equity (where equity refers to studies using one of the measures of equity market <strong>liberalisation</strong>) <strong>and</strong><br />
bank × mixed (where bank refers to studies using one of the measures of bank sector <strong>liberalisation</strong>). M refers to the total number<br />
of observations <strong>and</strong> N represents the total number of studies. � e <strong>and</strong> � u st<strong>and</strong> for the within-study <strong>and</strong> between-study st<strong>and</strong>ard<br />
deviations, respectively. In the estimations, we account for clustering of the st<strong>and</strong>ard errors.<br />
a The de facto measure has been omitted. The constant represents the effect of the omitted variable.<br />
b The oecd variable has been omitted. The constant represents the effect of the omitted variable.<br />
c The interaction de facto × oecd has been omitted. The constant represents the effect of the omitted variable.<br />
d The 1980s indicator has been omitted.
The authors of this report were supported by the Evidence for Policy <strong>and</strong> Practice Information <strong>and</strong><br />
Co-ordinating Centre (EPPI-Centre) <strong>and</strong> the International Initiative for Impact Evaluation (3ie).<br />
The Evidence for Policy <strong>and</strong> Practice Information <strong>and</strong> Co-ordinating Centre (EPPI-Centre) is part of the<br />
Social Science Research Unit (SSRU), Institute of Education, University of London.<br />
Since 1993, we have been at the forefront of carrying out systematic reviews <strong>and</strong> developing review<br />
methods in social science <strong>and</strong> public policy. We are dedicated to making reliable research findings<br />
accessible to the people who need them, whether they are making policy, practice or personal decisions.<br />
We engage health <strong>and</strong> education policy makers, practitioners <strong>and</strong> service users in discussions about how<br />
researchers can make their work more relevant <strong>and</strong> how to use research findings.<br />
Founded in 1990, the Social Science Research Unit (SSRU) is based at the Institute of Education,<br />
University of London. Our mission is to engage in <strong>and</strong> otherwise promote rigorous, ethical <strong>and</strong><br />
participative social research as well as to support evidence-informed public policy <strong>and</strong> practice across a<br />
range of domains including education, health <strong>and</strong> welfare, guided by a concern for human rights, social<br />
justice <strong>and</strong> the development of human potential.<br />
This material has been funded by the Department for International Development.<br />
However the views expressed do not necessarily reflect the department’s official<br />
policies. The report was first published in 2012 by:<br />
Evidence for Policy <strong>and</strong> Practice Information <strong>and</strong> Co-ordinating Centre (EPPI-Centre)<br />
Social Science Research Unit<br />
Institute of Education, University of London<br />
18 Woburn Square<br />
London WC1H 0NR<br />
Tel: +44 (0)20 7612 6397<br />
http://eppi.ioe.ac.uk<br />
http://www.ioe.ac.uk/ssru<br />
ISBN: 978-1-907345-40-1<br />
Cover image ©Reiner Barczinski, Netherl<strong>and</strong>s<br />
The International Initiative for Impact Evaluation (3ie) works to improve the lives of people in the<br />
developing world by supporting the production <strong>and</strong> use of evidence on what works, when, why <strong>and</strong> for<br />
how much. 3ie is a new initiative that responds to dem<strong>and</strong>s for better evidence, <strong>and</strong> will enhance<br />
development effectiveness by promoting better informed policies. 3ie finances high-quality impact<br />
evaluations <strong>and</strong> campaigns to inform better program <strong>and</strong> policy design in developing countries. 3ie<br />
Systematic Reviews examine the range of available evidence regarding a particular intervention.<br />
International Initiative for Impact Evaluations (3ie)<br />
Tel: + 44(0)20 7958 8351/8350<br />
http://www.3ieimpact.org<br />
The views expressed in this work are those of the authors <strong>and</strong> do not necessarily reflect the views of the<br />
EPPI-Centre, 3ie or the funder. All errors <strong>and</strong> omissions remain those of the authors.<br />
This document is available in a range of accessible formats including large print.<br />
Please contact the Institute of Education for assistance:<br />
telephone: +44 (0)20 7947 9556 email: info@ioe.ac.uk