Michael D. Bordo Christopher M. Meissner Working Paper 178
Michael D. Bordo Christopher M. Meissner Working Paper 178
Michael D. Bordo Christopher M. Meissner Working Paper 178

You also want an ePaper? Increase the reach of your titles
YUMPU automatically turns print PDFs into web optimized ePapers that Google loves.
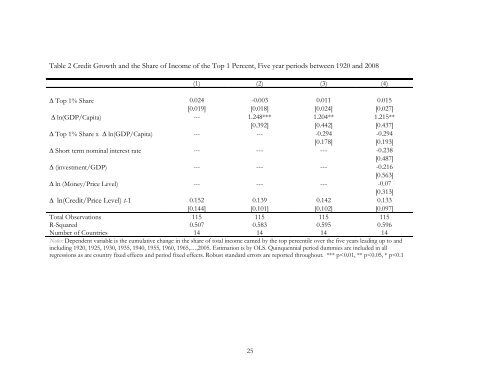
Table 2 Credit Growth and the Share of Income of the Top 1 Percent, Five year periods between 1920 and 2008<br />
(1) (2) (3) (4)<br />
� Top 1% Share 0.024 -0.003 0.011 0.015<br />
[0.019] [0.018] [0.024] [0.027]<br />
� ln(GDP/Capita) --- 1.248*** 1.204** 1.215**<br />
[0.392] [0.442] [0.437]<br />
� Top 1% Share x � ln(GDP/Capita) --- --- -0.294 -0.294<br />
[0.<strong>178</strong>] [0.193]<br />
� Short term nominal interest rate --- --- --- -0.238<br />
[0.487]<br />
� (investment/GDP) --- --- --- -0.216<br />
[0.563]<br />
� ln (Money/Price Level) --- --- --- -0.07<br />
[0.313]<br />
� ln(Credit/Price Level) t-1 0.152 0.139 0.142 0.133<br />
[0.144] [0.101] [0.102] [0.097]<br />
Total Observations 115 115 115 115<br />
R-Squared 0.507 0.583 0.595 0.596<br />
Number of Countries 14 14 14 14<br />
Notes: Dependent variable is the cumulative change in the share of total income earned by the top percentile over the five years leading up to and<br />
including 1920, 1925, 1930, 1935, 1940, 1955, 1960, 1965,…,2005. Estimation is by OLS. Quinquennial period dummies are included in all<br />
regressions as are country fixed effects and period fixed effects. Robust standard errors are reported throughout. *** p