The Ambiguity of Teaching to the Test Standards
The Ambiguity of Teaching to the Test Standards
The Ambiguity of Teaching to the Test Standards

You also want an ePaper? Increase the reach of your titles
YUMPU automatically turns print PDFs into web optimized ePapers that Google loves.
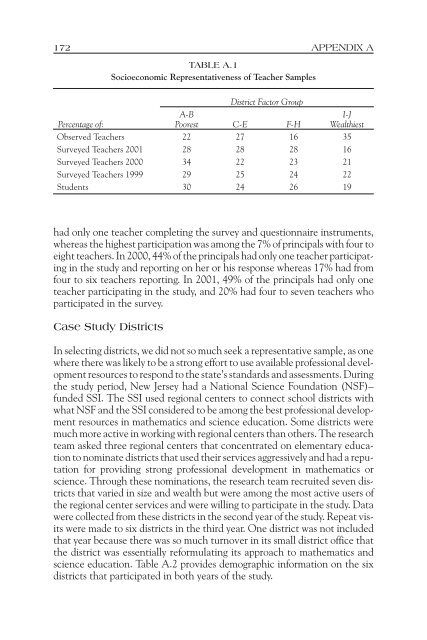
172 APPENDIX A<br />
TABLE A.1<br />
Socioeconomic Representativeness <strong>of</strong> Teacher Samples<br />
District Fac<strong>to</strong>r Group<br />
A-B<br />
I-J<br />
Percentage <strong>of</strong>: Poorest C-E F-H Wealthiest<br />
Observed Teachers 22 27 16 35<br />
Surveyed Teachers 2001 28 28 28<br />
16<br />
Surveyed Teachers 2000 34<br />
22 23 21<br />
Surveyed Teachers 1999 29<br />
25 24 22<br />
Students 30<br />
24 26 19<br />
had only one teacher completing <strong>the</strong> survey and questionnaire instruments,<br />
whereas <strong>the</strong> highest participation was among <strong>the</strong> 7% <strong>of</strong> principals with four <strong>to</strong><br />
eight teachers. In 2000, 44% <strong>of</strong> <strong>the</strong> principals had only one teacher participating<br />
in <strong>the</strong> study and reporting on her or his response whereas 17% had from<br />
four <strong>to</strong> six teachers reporting. In 2001, 49% <strong>of</strong> <strong>the</strong> principals had only one<br />
teacher participating in <strong>the</strong> study, and 20% had four <strong>to</strong> seven teachers who<br />
participated in <strong>the</strong> survey.<br />
Case Study Districts<br />
In selecting districts, we did not so much seek a representative sample, as one<br />
where <strong>the</strong>re was likely <strong>to</strong> be a strong effort <strong>to</strong> use available pr<strong>of</strong>essional development<br />
resources <strong>to</strong> respond <strong>to</strong> <strong>the</strong> state’s standards and assessments. During<br />
<strong>the</strong> study period, New Jersey had a National Science Foundation (NSF)–<br />
funded SSI. <strong>The</strong> SSI used regional centers <strong>to</strong> connect school districts with<br />
what NSF and <strong>the</strong> SSI considered <strong>to</strong> be among <strong>the</strong> best pr<strong>of</strong>essional development<br />
resources in ma<strong>the</strong>matics and science education. Some districts were<br />
much more active in working with regional centers than o<strong>the</strong>rs. <strong>The</strong> research<br />
team asked three regional centers that concentrated on elementary education<br />
<strong>to</strong> nominate districts that used <strong>the</strong>ir services aggressively and had a reputation<br />
for providing strong pr<strong>of</strong>essional development in ma<strong>the</strong>matics or<br />
science. Through <strong>the</strong>se nominations, <strong>the</strong> research team recruited seven districts<br />
that varied in size and wealth but were among <strong>the</strong> most active users <strong>of</strong><br />
<strong>the</strong> regional center services and were willing <strong>to</strong> participate in <strong>the</strong> study. Data<br />
were collected from <strong>the</strong>se districts in <strong>the</strong> second year <strong>of</strong> <strong>the</strong> study. Repeat visits<br />
were made <strong>to</strong> six districts in <strong>the</strong> third year. One district was not included<br />
that year because <strong>the</strong>re was so much turnover in its small district <strong>of</strong>fice that<br />
<strong>the</strong> district was essentially reformulating its approach <strong>to</strong> ma<strong>the</strong>matics and<br />
science education. Table A.2 provides demographic information on <strong>the</strong> six<br />
districts that participated in both years <strong>of</strong> <strong>the</strong> study.