Forecasting and Policy Making (Paper) - Center for Financial Studies
Forecasting and Policy Making (Paper) - Center for Financial Studies
Forecasting and Policy Making (Paper) - Center for Financial Studies

You also want an ePaper? Increase the reach of your titles
YUMPU automatically turns print PDFs into web optimized ePapers that Google loves.
5<br />
0<br />
−5<br />
20<br />
0<br />
−20<br />
−40<br />
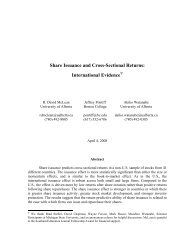
Figure 10 displays <strong>for</strong>ecasts <strong>for</strong> quarterly real output growth, consumption <strong>and</strong> investment. The<br />
Quarterly annualized real output growth<br />
2007 2008 2009 2010 2011<br />
Quarterly annualized real investment growth<br />
2007 2008 2009 2010 2011<br />
5<br />
0<br />
−5<br />
Quarterly annualized real consumption growth<br />
2007 2008 2009 2010 2011<br />
Figure 10: Data (black line) <strong>and</strong> <strong>for</strong>ecasts (blue lines) of annualized real output growth, annualized real consumption growth, annualized<br />
real investment growth <strong>and</strong> the level of external spending. The <strong>for</strong>mer three variables are observed in the data, while the latter is estimated<br />
using the Kalman Filter.<br />
output growth <strong>for</strong>ecasts are roughly similar to those computed with the small structural IMF model<br />
in the previous section. There is a strong comovement of output, consumption <strong>and</strong> investment. The<br />
fluctuations of investment growth are much larger than those of consumption growth. The model<br />
cannot predict the large recession in 2008/2009 <strong>and</strong> tends to predict a relatively quick return to the<br />
balanced growth part in 2008Q3 while the recession actually deepened. Once the turning point has<br />
been reached in 2008Q4 the recovery is predicted quite well (see Wiel<strong>and</strong> <strong>and</strong> Wolters, 2011, <strong>for</strong><br />
a detailed analysis of the predictive ability of DSGE models around turning points). Forecasts are<br />
quite accurate from 2009 onwards even though growth turned out to be somewhat lower in 2010 than<br />
predicted by the model.<br />
The <strong>for</strong>ecast <strong>for</strong> investment is extremely persistent. Investment is predicted slightly below 12<br />
percent <strong>for</strong> 2011 <strong>and</strong> decreases afterwards slowly to the much lower investment steady state growth<br />
rate. Steady-state investment growth equals the steady state output growth rate of about 2.4 percent.<br />
The high degree of persistence can be explained by the discrepancy between the average output growth<br />
rate <strong>and</strong> the much higher observed average investment growth rate in the data. The model en<strong>for</strong>ces<br />
that both time series have the same steady state value leading to a very high persistence in investment<br />
to fit the actual data series.<br />
Figure 11 displays <strong>for</strong>ecasts <strong>for</strong> annualized quarterly inflation <strong>and</strong> the federal funds rate. 34 The<br />
model cannot predict the spikes in inflation in 2008 <strong>and</strong> overpredicts inflation from 2009 to the end of<br />
two-sided filter uses in<strong>for</strong>mation about data points in the future.<br />
34 The inflation rate is not directly comparable to the IMF model because the IMF model uses the CPI inflation rate, while<br />
48