Engineering Lab Report Template - file format - University of Nicosia
Engineering Lab Report Template - file format - University of Nicosia
Engineering Lab Report Template - file format - University of Nicosia

Create successful ePaper yourself
Turn your PDF publications into a flip-book with our unique Google optimized e-Paper software.
Data discussion<br />
Discuss the obtained results. For example you can compare experimental and theoretical<br />
(expected) results and provide first comments on any discrepancies (discuss possible<br />
sources <strong>of</strong> error, including the human factor, instrument error, limitations <strong>of</strong><br />
theoretical/experimental models).<br />
Graphs<br />
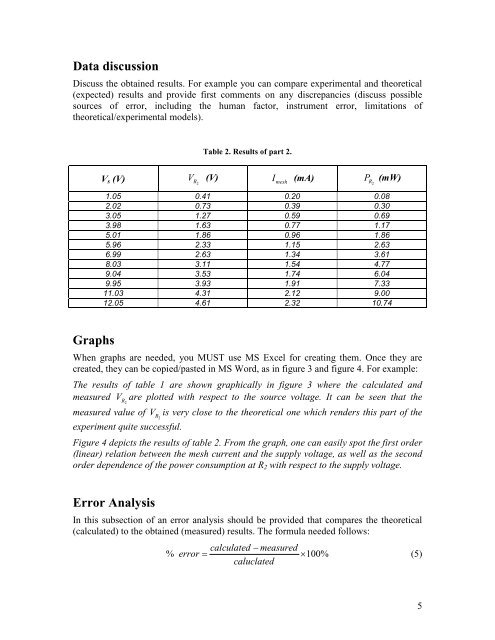
Table 2. Results <strong>of</strong> part 2.<br />
Vs (V) 2 R V (V) mesh<br />
I (mA) 2 R<br />
P (mW)<br />
1.05 0.41 0.20 0.08<br />
2.02 0.73 0.39 0.30<br />
3.05 1.27 0.59 0.69<br />
3.98 1.63 0.77 1.17<br />
5.01 1.86 0.96 1.86<br />
5.96 2.33 1.15 2.63<br />
6.99 2.63 1.34 3.61<br />
8.03 3.11 1.54 4.77<br />
9.04 3.53 1.74 6.04<br />
9.95 3.93 1.91 7.33<br />
11.03 4.31 2.12 9.00<br />
12.05 4.61 2.32 10.74<br />
When graphs are needed, you MUST use MS Excel for creating them. Once they are<br />
created, they can be copied/pasted in MS Word, as in figure 3 and figure 4. For example:<br />
The results <strong>of</strong> table 1 are shown graphically in figure 3 where the calculated and<br />
measured V are plotted with respect to the source voltage. It can be seen that the<br />
R2<br />
measured value <strong>of</strong> VR is very close to the theoretical one which renders this part <strong>of</strong> the<br />
2<br />
experiment quite successful.<br />
Figure 4 depicts the results <strong>of</strong> table 2. From the graph, one can easily spot the first order<br />
(linear) relation between the mesh current and the supply voltage, as well as the second<br />
order dependence <strong>of</strong> the power consumption at R2 with respect to the supply voltage.<br />
Error Analysis<br />
In this subsection <strong>of</strong> an error analysis should be provided that compares the theoretical<br />
(calculated) to the obtained (measured) results. The formula needed follows:<br />
calculated − measured<br />
% error = × 100%<br />
(5)<br />
caluclated<br />
5