Precht, Elimar, and Markus Huettel, Advective pore-water ... - ASLO
Precht, Elimar, and Markus Huettel, Advective pore-water ... - ASLO
Precht, Elimar, and Markus Huettel, Advective pore-water ... - ASLO

Create successful ePaper yourself
Turn your PDF publications into a flip-book with our unique Google optimized e-Paper software.
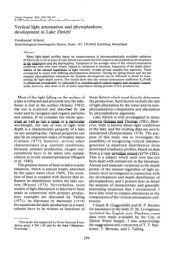
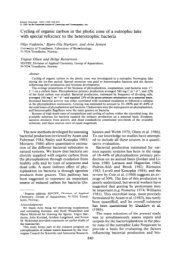
Fig. 3. Tracer release (solid circles) <strong>and</strong> derived filtering rates<br />
(crosses) during Exp 2.<br />
nant <strong>water</strong> columns during the first hour of the experiments<br />
corresponded to a fluid exchange of �12 <strong>and</strong> 10 L m �2 d �1<br />
for Diffs 1 <strong>and</strong> 2. All experiments are summarized in Fig.<br />
4, which gives a picture of the sediment depths that theoretically<br />
had to be completely flushed of tracer to explain its<br />
concentration increase in the <strong>water</strong> column over time during<br />
the different experiments. This normalized tracer release for<br />
<strong>water</strong> volume, sediment surface area, <strong>and</strong> porosity, such that<br />
all experiments became directly comparable. Figure 4 demonstrates<br />
that the four wave-tank experiments showed a<br />
much stronger initial tracer release pulse from the sediment<br />
than the diffusion experiments under stagnant conditions. In<br />
all experiments, the high initial fluxes leveled out after a few<br />
hours <strong>and</strong> approached values on the order of the diffusive<br />
release because most of the tracer was then flushed from the<br />
upper sediment layer. Consequently, total tracer release rates<br />
at the end of all flume runs were similar. After 24 h, the<br />
total release of tracer from the sediment under waves still<br />
Fig. 4. Dye release during the wave experiments (Exps 1–4)<br />
<strong>and</strong> the control diffusion chambers (Diff 1, Brilliant Blue; Diff 2,<br />
Rhodamine WT) into the <strong>water</strong>, expressed as theoretical sediment<br />
depths completely flushed free of dye—this form of presentation is<br />
independent of initial tracer concentrations, sediment surface area,<br />
<strong>and</strong> experimental <strong>water</strong> volume. In reality, washout affected larger<br />
depths than this theoretical depth. The calculation assumed complete<br />
washout; however, observed horizontal dye concentration gradients<br />
in the sediment demonstrated that washout depths varied locally.<br />
Wave-driven advection<br />
1679<br />
Fig. 5. Average sediment <strong>pore</strong>-<strong>water</strong> dye concentration distributions<br />
over depth before <strong>and</strong> after Exps 3 <strong>and</strong> 4 (same wave settings)<br />
<strong>and</strong> Diff 2: (left) before the experiment <strong>and</strong> (right) after the<br />
experiment. Error bars show the st<strong>and</strong>ard deviation.<br />
was four to six times higher than that under stagnant conditions,<br />
<strong>and</strong> the final theoretical depth of complete flushing<br />
during all wave experiments was �3 cm.<br />
The analyses of the <strong>pore</strong> <strong>water</strong> from the sediment cores<br />
taken before <strong>and</strong> after the experiments quantified the vertical<br />
concentration gradients that had developed in the sediment.<br />
These gradients confirmed the theoretical washout depths inferred<br />
from the <strong>water</strong> samples, because both methods yielded<br />
the same results. The initial tracer distributions showed homogeneous<br />
concentrations over all depths with little scatter<br />
(Fig. 5). The cores taken after Exps 3 <strong>and</strong> 4 revealed that<br />
the averaged release of tracer affected the sediment down to<br />
�4 cm depth. This was four times higher than in the diffusive<br />
cores, where reduced tracer concentrations were detectable<br />
only down to 1 cm. The error bars reflect the horizontal<br />
variations of tracer concentration that characterized<br />
the washout zone between 1 <strong>and</strong> 3 cm sediment depth.<br />
Hydrodynamics—The wavelengths (�) of the propagating<br />
waves ranged from 60 to 80 cm <strong>and</strong> the <strong>water</strong> depths (d)