Precht, Elimar, and Markus Huettel, Advective pore-water ... - ASLO
Precht, Elimar, and Markus Huettel, Advective pore-water ... - ASLO
Precht, Elimar, and Markus Huettel, Advective pore-water ... - ASLO

Create successful ePaper yourself
Turn your PDF publications into a flip-book with our unique Google optimized e-Paper software.
Limnol. Oceanogr., 48(4), 2003, 1674–1684<br />
� 2003, by the American Society of Limnology <strong>and</strong> Oceanography, Inc.<br />
<strong>Advective</strong> <strong>pore</strong>-<strong>water</strong> exchange driven by surface gravity waves <strong>and</strong> its ecological<br />
implications<br />
<strong>Elimar</strong> <strong>Precht</strong> 1 <strong>and</strong> <strong>Markus</strong> <strong>Huettel</strong><br />
Max Planck Institute for Marine Microbiology, Celsiusstrasse 1, D-28359 Bremen, Germany<br />
Abstract<br />
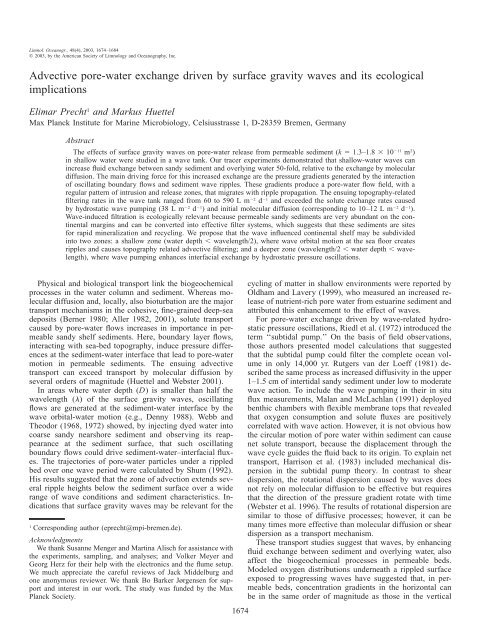
The effects of surface gravity waves on <strong>pore</strong>-<strong>water</strong> release from permeable sediment (k � 1.3–1.8 � 10�11 m2 )<br />
in shallow <strong>water</strong> were studied in a wave tank. Our tracer experiments demonstrated that shallow-<strong>water</strong> waves can<br />
increase fluid exchange between s<strong>and</strong>y sediment <strong>and</strong> overlying <strong>water</strong> 50-fold, relative to the exchange by molecular<br />
diffusion. The main driving force for this increased exchange are the pressure gradients generated by the interaction<br />
of oscillating boundary flows <strong>and</strong> sediment wave ripples. These gradients produce a <strong>pore</strong>-<strong>water</strong> flow field, with a<br />
regular pattern of intrusion <strong>and</strong> release zones, that migrates with ripple propagation. The ensuing topography-related<br />
filtering rates in the wave tank ranged from 60 to 590 L m�2 d�1 <strong>and</strong> exceeded the solute exchange rates caused<br />
by hydrostatic wave pumping (38 L m�2 d�1 ) <strong>and</strong> initial molecular diffusion (corresponding to 10–12 L m�2 d�1 ).<br />
Wave-induced filtration is ecologically relevant because permeable s<strong>and</strong>y sediments are very abundant on the continental<br />
margins <strong>and</strong> can be converted into effective filter systems, which suggests that these sediments are sites<br />
for rapid mineralization <strong>and</strong> recycling. We propose that the wave influenced continental shelf may be subdivided<br />
into two zones: a shallow zone (<strong>water</strong> depth � wavelength/2), where wave orbital motion at the sea floor creates<br />
ripples <strong>and</strong> causes topography related advective filtering; <strong>and</strong> a deeper zone (wavelength/2 � <strong>water</strong> depth � wavelength),<br />
where wave pumping enhances interfacial exchange by hydrostatic pressure oscillations.<br />
Physical <strong>and</strong> biological transport link the biogeochemical<br />
processes in the <strong>water</strong> column <strong>and</strong> sediment. Whereas molecular<br />
diffusion <strong>and</strong>, locally, also bioturbation are the major<br />
transport mechanisms in the cohesive, fine-grained deep-sea<br />
deposits (Berner 1980; Aller 1982, 2001), solute transport<br />
caused by <strong>pore</strong>-<strong>water</strong> flows increases in importance in permeable<br />
s<strong>and</strong>y shelf sediments. Here, boundary layer flows,<br />
interacting with sea-bed topography, induce pressure differences<br />
at the sediment-<strong>water</strong> interface that lead to <strong>pore</strong>-<strong>water</strong><br />
motion in permeable sediments. The ensuing advective<br />
transport can exceed transport by molecular diffusion by<br />
several orders of magnitude (<strong>Huettel</strong> <strong>and</strong> Webster 2001).<br />
In areas where <strong>water</strong> depth (D) is smaller than half the<br />
wavelength (�) of the surface gravity waves, oscillating<br />
flows are generated at the sediment-<strong>water</strong> interface by the<br />
wave orbital-<strong>water</strong> motion (e.g., Denny 1988). Webb <strong>and</strong><br />
Theodor (1968, 1972) showed, by injecting dyed <strong>water</strong> into<br />
coarse s<strong>and</strong>y nearshore sediment <strong>and</strong> observing its reappearance<br />
at the sediment surface, that such oscillating<br />
boundary flows could drive sediment-<strong>water</strong>–interfacial fluxes.<br />
The trajectories of <strong>pore</strong>-<strong>water</strong> particles under a rippled<br />
bed over one wave period were calculated by Shum (1992).<br />
His results suggested that the zone of advection extends several<br />
ripple heights below the sediment surface over a wide<br />
range of wave conditions <strong>and</strong> sediment characteristics. Indications<br />
that surface gravity waves may be relevant for the<br />
1 Corresponding author (eprecht@mpi-bremen.de).<br />
Acknowledgments<br />
We thank Susanne Menger <strong>and</strong> Martina Alisch for assistance with<br />
the experiments, sampling, <strong>and</strong> analyses; <strong>and</strong> Volker Meyer <strong>and</strong><br />
Georg Herz for their help with the electronics <strong>and</strong> the flume setup.<br />
We much appreciate the careful reviews of Jack Middelburg <strong>and</strong><br />
one anonymous reviewer. We thank Bo Barker Jørgensen for support<br />
<strong>and</strong> interest in our work. The study was funded by the Max<br />
Planck Society.<br />
1674<br />
cycling of matter in shallow environments were reported by<br />
Oldham <strong>and</strong> Lavery (1999), who measured an increased release<br />
of nutrient-rich <strong>pore</strong> <strong>water</strong> from estuarine sediment <strong>and</strong><br />
attributed this enhancement to the effect of waves.<br />
For <strong>pore</strong>-<strong>water</strong> exchange driven by wave-related hydrostatic<br />
pressure oscillations, Riedl et al. (1972) introduced the<br />
term ‘‘subtidal pump.’’ On the basis of field observations,<br />
those authors presented model calculations that suggested<br />
that the subtidal pump could filter the complete ocean volume<br />
in only 14,000 yr. Rutgers van der Loeff (1981) described<br />
the same process as increased diffusivity in the upper<br />
1–1.5 cm of intertidal s<strong>and</strong>y sediment under low to moderate<br />
wave action. To include the wave pumping in their in situ<br />
flux measurements, Malan <strong>and</strong> McLachlan (1991) deployed<br />
benthic chambers with flexible membrane tops that revealed<br />
that oxygen consumption <strong>and</strong> solute fluxes are positively<br />
correlated with wave action. However, it is not obvious how<br />
the circular motion of <strong>pore</strong> <strong>water</strong> within sediment can cause<br />
net solute transport, because the displacement through the<br />
wave cycle guides the fluid back to its origin. To explain net<br />
transport, Harrison et al. (1983) included mechanical dispersion<br />
in the subtidal pump theory. In contrast to shear<br />
dispersion, the rotational dispersion caused by waves does<br />
not rely on molecular diffusion to be effective but requires<br />
that the direction of the pressure gradient rotate with time<br />
(Webster et al. 1996). The results of rotational dispersion are<br />
similar to those of diffusive processes; however, it can be<br />
many times more effective than molecular diffusion or shear<br />
dispersion as a transport mechanism.<br />
These transport studies suggest that waves, by enhancing<br />
fluid exchange between sediment <strong>and</strong> overlying <strong>water</strong>, also<br />
affect the biogeochemical processes in permeable beds.<br />
Modeled oxygen distributions underneath a rippled surface<br />
exposed to progressing waves have suggested that, in permeable<br />
beds, concentration gradients in the horizontal can<br />
be in the same order of magnitude as those in the vertical
Wave-driven advection<br />
Fig. 1. The laboratory wave tank (light gray, sealed off <strong>water</strong> volume; dark gray, experimental<br />
<strong>water</strong> volume; WP, wave paddle; AB, artificial beach).<br />
(Shum 1993). These findings demonstrate that the classical<br />
one-dimensional approach frequently used to describe the<br />
distribution of <strong>pore</strong>-<strong>water</strong> constituents <strong>and</strong> to assess the related<br />
fluxes across the sediment-<strong>water</strong> interface is inadequate<br />
for s<strong>and</strong>y, permeable sea beds (Shum <strong>and</strong> Sundby 1996).<br />
The potential relevance of wave-induced advective <strong>pore</strong><strong>water</strong><br />
exchange for metabolic processes in permeable shelf<br />
s<strong>and</strong>s may be inferred from results obtained in flume studies<br />
that have addressed advective <strong>pore</strong>-<strong>water</strong> exchange driven<br />
by unidirectional flows. Those studies showed that advective<br />
interfacial fluid transport provides a rapid pathway for suspended<br />
organic particles <strong>and</strong> phytoplankton cells into permeable<br />
sediments (<strong>Huettel</strong> et al. 1996; <strong>Huettel</strong> <strong>and</strong> Rusch<br />
2000). Simultaneously, oxygen can be transported advectively<br />
deep into the bed (Shum 1993; Ziebis et al. 1996),<br />
which enhances the mineralization of this material (Forster<br />
et al. 1996). The advectively induced <strong>pore</strong>-<strong>water</strong> flow field<br />
in sediment generates a complex biogeochemical zonation<br />
with areas of enhanced nitrification or iron precipitation <strong>and</strong><br />
vertical channels through which ammonium <strong>and</strong> reduced<br />
metals are transported to the sediment surface (<strong>Huettel</strong> et al.<br />
1998).<br />
The aim of the present study was to characterize <strong>and</strong> quantify<br />
the effects of surface gravity waves on fluid exchange<br />
between a s<strong>and</strong>y bed <strong>and</strong> the overlying <strong>water</strong> column <strong>and</strong> to<br />
investigate the mechanisms leading to wave-induced interfacial<br />
exchanges. To achieve this, a set of laboratory wavetank<br />
experiments was conducted with s<strong>and</strong>y sediment<br />
stained with the conservative soluble tracer Rhodamine WT.<br />
The use of Rhodamine WT allowed the synchronous quantification<br />
of the interfacial flux <strong>and</strong> visualization of the<br />
evolving <strong>pore</strong>-<strong>water</strong> flow pattern.<br />
Materials <strong>and</strong> methods<br />
Wave-tank setup—Four experiments (experiments [Exp]<br />
1–4) were carried out in a laboratory wave tank. The wave<br />
tank was made of clear acrylic <strong>and</strong> had an open channel<br />
section of 520 cm length with rectangular cross-section (50<br />
cm high � 47 cm wide). Two acrylic boxes (‘‘upstream’’<br />
box, 240 cm long <strong>and</strong> ‘‘downstream’’ box, 120 cm long;<br />
both 19 cm high <strong>and</strong> spanning the width of the channel)<br />
were placed into the open channel section, such that the<br />
opening between the two boxes enclosed a section of 120<br />
cm length that could be filled with sediment (Fig. 1). Waves<br />
were generated at the upstream end of the wave tank with a<br />
1675<br />
paddle driven by an electric motor. The wave amplitude was<br />
controlled by the stroke of the eccentric, <strong>and</strong> the wave frequency<br />
could be adjusted via the motor speed. This setup<br />
permitted the reproducible generation of sinusoidal waves of<br />
selected amplitude <strong>and</strong> frequency. At the downstream end of<br />
the wave tank, the dissipation of the waves was achieved by<br />
an artificial beach made of an acrylic wedge of 1 m length<br />
that caused the waves to run up <strong>and</strong> break. In Exps 3 <strong>and</strong><br />
4, this wedge was additionally covered by a 10-cm-thick mat<br />
of highly permeable plastic foam, to maximize the dissipation<br />
of the wave energy. The open channel section was<br />
sealed from the other parts of the wave tank <strong>and</strong> from the<br />
two inset acrylic boxes, to prevent loss of the tracer into<br />
those sections.<br />
All experiments were conducted with propagating waves.<br />
Amplitudes, wavelengths, <strong>and</strong> frequencies are listed in Table<br />
1. The hydrodynamic conditions in Exps 3 <strong>and</strong> 4 were identical.<br />
Sediment preparation <strong>and</strong> sampling—The experimental<br />
sediment was cleaned, <strong>and</strong> sieved, dry quartz s<strong>and</strong> originating<br />
from the Weser river estuary (in northern Germany) with<br />
a grain size distribution of 100–300 �m <strong>and</strong> was mixed with<br />
Rhodamine WT tracer solution, which gave it a pink appearance.<br />
The initial tracer concentrations for the respective<br />
experiments are listed in Table 1. The saturated pink sediment<br />
was inserted into the trough enclosed by the two acrylic<br />
boxes, to produce a sediment layer of 25 (Exp 1) or 22<br />
(Exps 2–4) cm depth with 141 <strong>and</strong> 124 dm 3 volume, respectively.<br />
The two boxes in the open channel section were<br />
covered with 6 (Exp 1) or 3 (Exps 2–4) cm of unstained<br />
s<strong>and</strong> of identical grain size. The sediment was compacted<br />
by the application of low-frequency vibration, <strong>and</strong> the surface<br />
was carefully smoothed before each experiment, to create<br />
an overall even surface with uniform roughness in the<br />
open channel section. Ripple evolution occurred as a response<br />
of the bed to the applied wave action.<br />
The use of Rhodamine WT as a tracer to stain the sediments<br />
had two functions. First, sequential <strong>water</strong> sampling<br />
during the experiments <strong>and</strong> subsequent analysis of the tracer<br />
content of the samples allowed the assessment of the flux of<br />
<strong>pore</strong> <strong>water</strong> from the sediment over time. Second, the red<br />
color of Rhodamine WT allowed direct observation of the<br />
evolving <strong>pore</strong>-<strong>water</strong> flow patterns in the sediment.<br />
Directly before <strong>and</strong> after each wave-tank experiment, sediment<br />
subcores of 2.6 cm diameter <strong>and</strong> 10 cm length were
1676 <strong>Precht</strong> <strong>and</strong> <strong>Huettel</strong><br />
Table 1. Summary of experimental parameters. Permeabilities, porosities, <strong>and</strong> tracer concentrations are initial values. Variability in initial<br />
permeability <strong>and</strong> porosity values are due to different degrees of compaction of the sediment.<br />
Start<br />
End<br />
Duration (h)<br />
Sediment*<br />
Permeability (m2 )<br />
Porosity (vol%)<br />
Sediment depth (cm)<br />
Experiment Exp 1 Exp 2 Exp 3 Exp 4 Diff 1 Diff 2<br />
14 Sep 1999<br />
15 Sep 1999<br />
14.75<br />
1.32�10�11 36.6<br />
22<br />
16 Sep 1999<br />
17 Sep 1999<br />
19.4<br />
1.32�10�11 36.9<br />
21.5<br />
11 Jul 2000<br />
12 Jul 2000<br />
24<br />
1.79�10�11 37.3<br />
22<br />
Water Fresh, 19�C<br />
14 Nov 2000<br />
15 Nov 2000<br />
24<br />
1.82�10�11 38.1<br />
22<br />
22 Jun 1999<br />
24 Jun 1999<br />
72<br />
2.02�10 �11<br />
38.25<br />
22<br />
Tracer Rhodamine WT Brilliant<br />
Blue<br />
Tracer concentration (�mol L �1 )<br />
Water depth (cm)<br />
40<br />
15<br />
39<br />
20<br />
Wave Propagating None<br />
Amplitude (cm)<br />
Length (cm)<br />
Frequency (Hz)<br />
* Quartz s<strong>and</strong>, 100–300 �m.<br />
8<br />
60<br />
1.56<br />
9<br />
80<br />
1.2<br />
taken from the experimental sediment volume for porosity,<br />
permeability, <strong>and</strong> tracer distribution analyses. Additionally,<br />
several surface sediment samples (1 cm in diameter � 2.5<br />
cm long) were taken after Exps 3 <strong>and</strong> 4 using cutoff syringes.<br />
After carefully replacing the retrieved sediment volumes<br />
with equally stained sediment, the wave tank was filled with<br />
�1,750 liters of fresh<strong>water</strong>. The <strong>water</strong> level in the channel<br />
was raised very slowly, to minimize tracer release from the<br />
sediment. The <strong>water</strong> volume in the channel that could exchange<br />
with the sediment <strong>pore</strong> <strong>water</strong> amounted to 360 liters<br />
in Exps 1 <strong>and</strong> 2 <strong>and</strong> 410 liters in Exps 3 <strong>and</strong> 4. Table 1<br />
gives an overview of the experimental parameters.<br />
Diffusion experiments—Two sets of diffusion experiments<br />
(diffusion [Diff] 1 <strong>and</strong> 2) were set up in three acrylic cylindrical<br />
chambers (19 cm inner diameter � 40 cm high) with<br />
stained sediment, to assess the diffusive release of tracer<br />
from the sediment. The experimental parameters are presented<br />
in Table 1. After compaction, sediment subcores were<br />
taken from each chamber <strong>and</strong> prepared for analysis of tracer<br />
content, permeability, <strong>and</strong> porosity, as described above for<br />
the subcores from the wave tank. After the extracted sediment<br />
volumes had been replaced by stained sediment, the<br />
sediment surfaces were covered with a plastic film, <strong>and</strong> 4.25<br />
liters of fresh<strong>water</strong> were added to each chamber without<br />
mixing with the stained <strong>pore</strong> <strong>water</strong>. Then the plastic films<br />
were removed, <strong>and</strong> the chambers were kept under stagnant<br />
conditions for the duration of the experiments. At regular<br />
time intervals, the <strong>water</strong> column of each chamber was gently<br />
mixed by five horizontal strokes with a spatula to homogenize<br />
tracer distribution, <strong>and</strong> <strong>water</strong> samples (3 � 2cm 3 ) were<br />
taken <strong>and</strong> stored for later analysis of their Rhodamine WT<br />
content. After the experiments, the chambers were carefully<br />
drained, <strong>and</strong> a second set of sediment subcores was taken<br />
for analyses of tracer gradient over depth, permeability, <strong>and</strong><br />
porosity.<br />
21<br />
17<br />
6<br />
60<br />
1.3<br />
5<br />
17<br />
6<br />
60<br />
1.3<br />
47<br />
17<br />
—<br />
—<br />
—<br />
11 Jul 2000<br />
12 Jul 2000<br />
24<br />
1.75�10 �11<br />
37.7<br />
20.5<br />
Rhodamine<br />
WT<br />
19<br />
17<br />
—<br />
—<br />
—<br />
Analyses—The sediment subcores taken from the laboratory<br />
wave tank, <strong>and</strong> the diffusion chambers were sectioned<br />
into 1-cm-thick horizontal slices for <strong>pore</strong>-<strong>water</strong> <strong>and</strong> porosity<br />
analysis. The porosity of the sediment samples of the respective<br />
cores was calculated from the wet <strong>and</strong> dry (after 48<br />
h drying at 60�C) weights of the sediment slices.<br />
Pore-<strong>water</strong> extraction was achieved by centrifugation at<br />
2,900 � g for 10 min at 10�C. The extracted <strong>pore</strong> <strong>water</strong> was<br />
analyzed for its Rhodamine content by spectrophotometry<br />
(absorption, 556 nm) or fluorescence spectrophotometry (excitation,<br />
570 nm <strong>and</strong> emission, 556 nm). The absolute tracer<br />
concentrations of the analyzed samples were calculated from<br />
the extinction coefficient for Rhodamine WT.<br />
The sediment subcores used to assess the permeability<br />
were sealed after sampling <strong>and</strong> stored at 4�C until the measurements<br />
were carried out, usually within a few days. Permeability<br />
was assessed using a constant head permeameter<br />
(Klute <strong>and</strong> Dirksen 1986), <strong>and</strong> values for the dynamic viscosity<br />
(�) were calculated according to the method of Krögel<br />
(1997).<br />
During all experiments, <strong>water</strong> samples were collected at<br />
preset time intervals, with the shortest intervals during the<br />
initial phase of the experiments. After starting the wave experiments,<br />
a tracer cloud developed over the stained sediment<br />
that then dispersed over the entire volume of the open<br />
channel section. Our flux calculations, therefore, are based<br />
on the integrated dye content of the entire channel. Samples<br />
(3 � 5 ml) were taken at six representative positions from<br />
the experimental <strong>water</strong> volume <strong>and</strong> also from the sealed off<br />
sections of the wave tank, to assess tracer loss due to possible<br />
leakages into the sealed sections. The <strong>water</strong> samples<br />
were stored at 10�C <strong>and</strong> subsequently analyzed for their tracer<br />
content, to determine the flux of tracer between sediment<br />
<strong>and</strong> <strong>water</strong>.<br />
Hydrodynamics were measured using a three-beam DAN-<br />
TEC laser Doppler anemometer (LDA) system in the back-
Table 2. Summary of the experimental results.<br />
Wave-driven advection<br />
Experiment Exp 1 Exp 2 Exp 3 Exp 4 Diff 1 Diff 2<br />
Ripple length (cm)<br />
Ripple height (cm)<br />
Ripple height/length<br />
ratio<br />
First ripples evolved<br />
3<br />
0.7<br />
0.23<br />
3<br />
0.7<br />
0.23<br />
(min) 15 5 10 20 — —<br />
Initial ripple evolution<br />
Calculated washout depth<br />
Complete Complete Half of the<br />
sediment<br />
surface<br />
Patchy — —<br />
(cm)/after (h)<br />
Calculated washout<br />
2.6/14 3.0/17 3.1/24 3.2/24 0.8/24 0.7/24<br />
depth after 2 h (cm) 2.6 2.2 0.9 1 0.2 0.3<br />
Tracer exchange rate<br />
(L m�2 d�1 12<br />
10<br />
) 222 590 60 93<br />
(1st h) (1st h)<br />
scatter mode during all experiments except Exp 4. This LDA<br />
technique allows three-dimensional measurements of the<br />
flow velocity in a spheroidal measuring volume as small as<br />
70 �m in diameter. During Exp 3, two vertical profiles (100–<br />
2 mm above the sediment) of the horizontal (u) <strong>and</strong> vertical<br />
(v) velocities were measured 150 min after the start of the<br />
experiment above an unrippled section of the experimental<br />
sediment surface. In the <strong>water</strong> layer closer than 6 mm to the<br />
sediment-<strong>water</strong> interface, the LDA setup only allowed the<br />
measurement of the u velocity component.<br />
Results<br />
Pore-<strong>water</strong> flow pattern—The waves caused advective<br />
<strong>pore</strong>-<strong>water</strong> exchange in the wave tank that exceeded the<br />
maximum diffusive exchange (based on exchange rate in the<br />
first hour) in the stagnant control tank by factor 8–54. This<br />
flux enhancement was mainly caused by <strong>pore</strong>-<strong>water</strong> flows<br />
driven by oscillating boundary flows interacting with the<br />
wave-generated sediment ripples. The small flux enhancements<br />
prior to the development of the ripple topography revealed<br />
that the sinusoidal hydrostatic pressure oscillations<br />
due to the passage of the surface gravity waves (‘‘wave<br />
pumping’’) had relatively little influence on the <strong>pore</strong>-<strong>water</strong><br />
exchange. Table 2 summarizes the results of the wave-tank<br />
<strong>and</strong> diffusion experiments.<br />
In the wave-tank experiments, four phases could be distinguished<br />
after the initiation of the waves:<br />
1. The initial phase was characterized by a smooth sediment<br />
surface <strong>and</strong> moderate tracer release from the sediment.<br />
During this phase, diffusion, wave pumping (sensu Riedl<br />
et al. 1972), <strong>and</strong> some advective release linked to smallscale<br />
topography elements remaining on the smoothed<br />
sediment surface drove the interfacial solute flux.<br />
2. The transitional phase started with the onset of ripple formation<br />
<strong>and</strong> ended when the entire sediment surface was<br />
covered with ripples. Within this period, the contribution<br />
of advective interfacial tracer exchange caused by rippleflow<br />
interaction increased rapidly. At the end of this<br />
phase, solute release rates reached their maxima.<br />
2.5<br />
0.5<br />
0.2<br />
2.5<br />
0.5<br />
0.2<br />
—<br />
—<br />
—<br />
—<br />
—<br />
—<br />
1677<br />
3. The flushing phase occurred when the tracer was advectively<br />
washed from the upper sediment layer mainly because<br />
of oscillating flow–ripple interaction. Because of<br />
rapid tracer removal, its release rates decreased during<br />
this phase.<br />
4. The final equilibrium phase occurred when the tracer release<br />
was limited by the diffusion of tracer from deeper<br />
sediment layers into the flushed layer, with the concentration<br />
gradient not situated at the sediment-<strong>water</strong> interface<br />
but at the lower limit of the washout zones.<br />
Figure 2a–c shows the initial (Fig. 2a) tracer distribution<br />
in the sediment <strong>and</strong> the distribution after 20 min (Fig. 2b)<br />
<strong>and</strong> 24 h (Fig. 2c) during Exp 3. Ripple formation started<br />
10 min into the experiment.<br />
During the initial phase, wave action removed the red dye<br />
from the upper 1–2 mm of the sediment, producing a thin,<br />
uniform washout layer. During ripple formation, light-colored<br />
washout zones free of tracer formed rapidly in the ripple<br />
troughs, where <strong>water</strong> was forced into the sediment. This<br />
fluid intrusion was balanced by the release of <strong>pore</strong> <strong>water</strong><br />
from confined upwelling zones at the ripple crests (Fig.<br />
2b,d,e). This <strong>pore</strong>-<strong>water</strong> flow pattern was firmly linked to<br />
the sediment ripples (Fig. 2d,f) <strong>and</strong> propagated with ripple<br />
migration. Later during the experiment, sediment bars (Rey<br />
et al. 1995) formed with wavelengths of �30 cm <strong>and</strong> amplitudes<br />
of �1 cm. Such bars are formed by resonance effects<br />
that exist in wave tanks because of partial wave reflection.<br />
Ripples were larger on the bar crests <strong>and</strong> smaller in<br />
the bar troughs. Intrusion <strong>and</strong> release zones linked to ripple<br />
<strong>and</strong> bar topographies combined to form larger irregular areas<br />
of down- <strong>and</strong> upwelling (Fig. 2c).<br />
Figure 2f shows an area of sediment surface that displayed<br />
no ripples until 23 h after the start of Exp 3. This section<br />
permitted the direct comparison of tracer washout caused by<br />
hydrostatic wave pumping <strong>and</strong> topography-flow interaction.<br />
Whereas areas with ripples were characterized by washout<br />
zones <strong>and</strong> <strong>pore</strong>-<strong>water</strong> upwelling zones reaching the sediment<br />
surface, this smooth area displayed only a very thin uninterrupted<br />
surface layer depleted in tracer comparable to that<br />
observed during the initial phase of the experiment. This
1678 <strong>Precht</strong> <strong>and</strong> <strong>Huettel</strong><br />
Fig. 2. Evolution of the washout pattern during Exp 3. Dark areas of the sediment indicate a<br />
high Rhodamine content; red <strong>and</strong> contrast were digitally enhanced before the figure was changed<br />
to grayscale. (a) Before the experiment, when there was a smooth sediment surface; (b) after 20<br />
min (boxes indicate the sectors magnified in panels d <strong>and</strong> f); (c) after 24 h; (d) magnified from<br />
panel b, after 20 min; (e) sketch of the <strong>pore</strong>-<strong>water</strong> flow pattern <strong>and</strong> the current-induced pressure<br />
field; (f) magnified from panel b, after 20 min; (g) exceptional area, where ripples had not formed<br />
by 23 h.<br />
contrast reveals the dominance of the topography-related<br />
<strong>pore</strong>-<strong>water</strong> release.<br />
Because ripple formation did not take place in the same<br />
manner in all experiments, the release of tracer varied as<br />
well. In Exps 1 <strong>and</strong> 2, ripples covered the complete experimental<br />
sediment surface after 45 min. This resulted in a<br />
pronounced peak of tracer release. In Exp 2, tracer release<br />
increased sharply after 50 min <strong>and</strong> started to level out after<br />
105 min (Fig. 3). The first derivative of tracer concentration<br />
over time yielded the filtration rate (Fig. 3), which in Exp 2<br />
peaked at 590 L m �2 d �1 . During the other experiments, the<br />
filtration rates ranged from 222 (Exp 1) to 60 <strong>and</strong> 93 (Exps<br />
3 <strong>and</strong> 4, respectively) L m �2 d �1 . In comparison, the tracer<br />
volume released by diffusion from the sediments under stag-
Fig. 3. Tracer release (solid circles) <strong>and</strong> derived filtering rates<br />
(crosses) during Exp 2.<br />
nant <strong>water</strong> columns during the first hour of the experiments<br />
corresponded to a fluid exchange of �12 <strong>and</strong> 10 L m �2 d �1<br />
for Diffs 1 <strong>and</strong> 2. All experiments are summarized in Fig.<br />
4, which gives a picture of the sediment depths that theoretically<br />
had to be completely flushed of tracer to explain its<br />
concentration increase in the <strong>water</strong> column over time during<br />
the different experiments. This normalized tracer release for<br />
<strong>water</strong> volume, sediment surface area, <strong>and</strong> porosity, such that<br />
all experiments became directly comparable. Figure 4 demonstrates<br />
that the four wave-tank experiments showed a<br />
much stronger initial tracer release pulse from the sediment<br />
than the diffusion experiments under stagnant conditions. In<br />
all experiments, the high initial fluxes leveled out after a few<br />
hours <strong>and</strong> approached values on the order of the diffusive<br />
release because most of the tracer was then flushed from the<br />
upper sediment layer. Consequently, total tracer release rates<br />
at the end of all flume runs were similar. After 24 h, the<br />
total release of tracer from the sediment under waves still<br />
Fig. 4. Dye release during the wave experiments (Exps 1–4)<br />
<strong>and</strong> the control diffusion chambers (Diff 1, Brilliant Blue; Diff 2,<br />
Rhodamine WT) into the <strong>water</strong>, expressed as theoretical sediment<br />
depths completely flushed free of dye—this form of presentation is<br />
independent of initial tracer concentrations, sediment surface area,<br />
<strong>and</strong> experimental <strong>water</strong> volume. In reality, washout affected larger<br />
depths than this theoretical depth. The calculation assumed complete<br />
washout; however, observed horizontal dye concentration gradients<br />
in the sediment demonstrated that washout depths varied locally.<br />
Wave-driven advection<br />
1679<br />
Fig. 5. Average sediment <strong>pore</strong>-<strong>water</strong> dye concentration distributions<br />
over depth before <strong>and</strong> after Exps 3 <strong>and</strong> 4 (same wave settings)<br />
<strong>and</strong> Diff 2: (left) before the experiment <strong>and</strong> (right) after the<br />
experiment. Error bars show the st<strong>and</strong>ard deviation.<br />
was four to six times higher than that under stagnant conditions,<br />
<strong>and</strong> the final theoretical depth of complete flushing<br />
during all wave experiments was �3 cm.<br />
The analyses of the <strong>pore</strong> <strong>water</strong> from the sediment cores<br />
taken before <strong>and</strong> after the experiments quantified the vertical<br />
concentration gradients that had developed in the sediment.<br />
These gradients confirmed the theoretical washout depths inferred<br />
from the <strong>water</strong> samples, because both methods yielded<br />
the same results. The initial tracer distributions showed homogeneous<br />
concentrations over all depths with little scatter<br />
(Fig. 5). The cores taken after Exps 3 <strong>and</strong> 4 revealed that<br />
the averaged release of tracer affected the sediment down to<br />
�4 cm depth. This was four times higher than in the diffusive<br />
cores, where reduced tracer concentrations were detectable<br />
only down to 1 cm. The error bars reflect the horizontal<br />
variations of tracer concentration that characterized<br />
the washout zone between 1 <strong>and</strong> 3 cm sediment depth.<br />
Hydrodynamics—The wavelengths (�) of the propagating<br />
waves ranged from 60 to 80 cm <strong>and</strong> the <strong>water</strong> depths (d)
1680 <strong>Precht</strong> <strong>and</strong> <strong>Huettel</strong><br />
Fig. 6. Profiles of maximum orbital velocities measured with<br />
the LDA at the beginning of Exp 3 above unrippled experimental<br />
sediment surface; solid circles indicate maximum horizontal velocity<br />
(u) <strong>and</strong> solid triangles indicate maximum vertical velocities (v).<br />
Values of v decreased linearly <strong>and</strong> values of u decreased nonlinearly.<br />
Between 0 <strong>and</strong> 0.6 cm above the sediment surface, the LDA<br />
setup only allowed for the measurement of u.<br />
from 15 to 20 cm. With d � �/2, oscillating <strong>water</strong> motion<br />
was present at the sediment-<strong>water</strong> interface.<br />
Figure 6 shows the mean maximal orbital velocities umax <strong>and</strong> vmax for each depth, measured over the smooth sediment<br />
surface at the beginning of Exp 3. The maximum boundary<br />
shear stress can be calculated using the velocity gradient in<br />
the viscous sublayer:<br />
�0m � ��(�u/�z) (1)<br />
with density �, dynamic viscosity �, velocity in x-direction<br />
u, <strong>and</strong> height over sediment z (Caldwell <strong>and</strong> Chriss 1979).<br />
With an averaged maximum value of 0.1 m s �1 for �u for a<br />
�z of 0.1 cm, directly over the sediment surface, this results<br />
in � 0m � 0.107 N m �2 . Inferred from<br />
u* max � (� 0m/�) 1/2 (2)<br />
the maximum shear velocity u* max � 0.01 m s �1 . Assessing<br />
u* max from a log velocity profile yields a similar result, with<br />
u* max � 0.012 m s �1 , which results in � 0m � 0.148 N m �2 .<br />
Ripple formation—The shear velocity required to move a<br />
sediment particle of our sediment (calculated according to<br />
u* � 0.06�(� s � � f)gD, where � s is the density of the s<strong>and</strong><br />
grains, � f is the density of the fluid, g is gravitational acceleration,<br />
<strong>and</strong> D is the grain diameter; Hsü 1989) was smaller<br />
<strong>and</strong> ranged 0.0024–0.0042 m s �1 . Consequently, ripples<br />
started forming on parts of the sediment surface within the<br />
initial 20 min of all wave experiments (Table 2). Even<br />
though the sediment surface was carefully leveled <strong>and</strong><br />
smoothed before the experiments started, a few small roughness<br />
elements of up to 1 mm height were still existent, <strong>and</strong><br />
ripple formation started at these areas. From the zones of<br />
initial ripple formation, the ripples spread over the entire<br />
experimental sediment area, which took 60 <strong>and</strong> 15 min in<br />
Exps 1 <strong>and</strong> 2, respectively, <strong>and</strong> 8–10 h in Exps 3 <strong>and</strong> 4. The<br />
ripples migrated in the same direction as the waves propa-<br />
gated, <strong>and</strong> their initial migration speed ranged between 2 <strong>and</strong><br />
3cmh �1 .<br />
Discussion<br />
Advection <strong>and</strong> wave pumping—Our experiments show<br />
that wave-induced oscillating flows interacting with sediment<br />
topography drive advective processes in a manner similar<br />
to that of unidirectional flow, as described by, for example,<br />
Savant et al. (1987), Thibodeaux <strong>and</strong> Boyle (1987),<br />
or <strong>Huettel</strong> <strong>and</strong> Gust (1992). Under oscillating flow, <strong>water</strong> is<br />
forced into the sediment at the ripple troughs <strong>and</strong> flanks, <strong>and</strong><br />
<strong>pore</strong> <strong>water</strong> emerges centered at the ripple crest, as predicted<br />
by Shum’s (1992) model calculations. According to Rutherford<br />
et al. (1995), the pressure perturbation along a sediment<br />
dune (ripple) surface is sinusoid, with a wavelength<br />
equal to the dune wavelength. This could be confirmed in<br />
our experiments for the flow fields that developed under oscillating<br />
flows, because washout was closely linked to ripple<br />
(<strong>and</strong> bar) wavelength. Likewise, applying mathematical<br />
models developed for the estimation of filtration rates caused<br />
by unidirectional flows to our settings produced exchange<br />
rates that were close to those we measured in the wave experiments.<br />
If we assumed that oscillating flows produce pressure<br />
gradients at protruding topography in a manner similar<br />
to unidirectional flows, the pressure perturbation at each ripple<br />
was estimated by<br />
p � 0.14�u2 (�/0.34d) 3/8 (3)<br />
for �/H � 0.34 with ripple height �, <strong>water</strong> depth d, density<br />
�, <strong>and</strong> mean current velocity u (Elliott 1990; <strong>Huettel</strong> <strong>and</strong><br />
Webster 2001). For u we used a root-mean square value of<br />
the oscillating horizontal velocity component that was 0.112<br />
ms�1 at 10-cm <strong>water</strong> depth in Exp 3. From this pressure<br />
perturbation, the fluid exchange rate w0 could be calculated<br />
according to<br />
w0 � (2k/��LD)p (4)<br />
with k, �, <strong>and</strong> LD denoting permeability, kinematic viscosity,<br />
<strong>and</strong> decay length (the length scale of the ripple), respectively<br />
(<strong>Huettel</strong> <strong>and</strong> Webster 2001). Using the parameters <strong>and</strong> ripple<br />
dimensions of Exp 3, this gives a mean pressure perturbation<br />
of 1.11 Pa, which yields a theoretical flushing rate of 116 L<br />
m�2 d�1 . The bars of 30-cm amplitude <strong>and</strong> 1-cm height<br />
would additionally contribute 12 L m�2 d�1 of filtration. The<br />
resulting total flushing rate of 128 L m�2 d�1 is in the same<br />
order of magnitude as the ones measured in our experiments.<br />
It is clear that the wave-generated flow–topography interaction<br />
addressed in the present study only can cause filtration<br />
where the orbital motion reaches the sea bed (depth � wavelength/2).<br />
However, surface gravity waves cause filtration<br />
beyond that depth as well, because of the hydrostatic pressure<br />
oscillations they produce.<br />
Riedl et al. (1972) estimated that, averaged over the global<br />
continental margin, wave pumping filters �33 L m�2 d�1 through s<strong>and</strong>y shelf sediments. Mu et al. (1999) calculated<br />
a seepage of 15 L m�2 d�1 into <strong>and</strong> out of a flat s<strong>and</strong>y (md<br />
� 164 �m) seabed at 15 m <strong>water</strong> depth caused by waveinduced<br />
hydrostatic pressure oscillations (wave height � 1.5<br />
m; length � 10 m, period � 6 s), which suggests a sub-
stantially smaller filtration rate than that proposed by Riedl<br />
et al. (1972).<br />
Our experimental setup was not designed to quantify wave<br />
pumping. Nevertheless, the initial phase of Exp 2, when a<br />
rippled surface topography had not yet developed, may have<br />
indicated the magnitude of the effect of hydrostatic pressure<br />
oscillations on <strong>pore</strong>-<strong>water</strong> release (Fig. 2). During this phase,<br />
we recorded a filtration rate of 38 L m �2 d �1 . This rate must<br />
be treated as a maximum estimate, because, in our flume<br />
experiments, the ratio between sediment permeability <strong>and</strong><br />
<strong>water</strong> depth was large relative to most areas in the shelf.<br />
However, because this rate is in the range of the findings of<br />
Mu et al. (1999) <strong>and</strong> Riedl et al. (1972), we used this value<br />
as an approximation for the effects of wave pumping. The<br />
comparison of this rate <strong>and</strong> the filtration rate caused by oscillating<br />
flow–topography interaction suggests that, where<br />
wave orbital motion reaches the seabed, oscillating flow–<br />
topography interaction is more effective for <strong>pore</strong>-<strong>water</strong> exchange<br />
than wave pumping.<br />
In our wave tank, exchange rates caused by oscillating<br />
flow–topography interaction reached up to 590 L m �2 d �1 .<br />
Because our calculations were based on the maximum observable<br />
pulse of tracer release from the sediment, the resulting<br />
estimates of the <strong>water</strong> volume filtered through the<br />
sediment by wave action are minimum values. This is because<br />
the pulse maximum depends on how fast the ripples<br />
are formed, as shown by the delayed release of tracer during<br />
Exps 3 <strong>and</strong> 4, during which ripples initially formed on half<br />
the sediment surface (Exp 3) or were patchy over the duration<br />
of several hours (Exp 4). It is likely that, in these two<br />
experiments, the final filtration rates with fully developed<br />
sediment topography were higher, but by that time an assessment<br />
of the effective filtration was impossible because<br />
most of the tracer had already been washed from the upper<br />
sediment layers.<br />
Oscillating flow–topography interaction caused a clear in-<br />
Wave-driven advection<br />
Fig. 7. Schematic overview of the different sediment-<strong>water</strong> interaction processes due to surface<br />
gravity waves in coastal <strong>and</strong> shelf environments (� � wavelength). (I) In the beach zone, beach<br />
percolation can lead to very high filtering rates in a zone of limited lateral extension. In lower parts<br />
of the beach, resuspension <strong>and</strong> high sediment mobility can lead to <strong>pore</strong>-<strong>water</strong> release <strong>and</strong> particulate<br />
organic matter burial. (II) In the permanent advection zone (<strong>water</strong> depth � �/2), surface gravity<br />
waves permanently induce oscillating boundary flow that, by interacting with sediment ripples, lead<br />
to constant advective solute exchange. This advective flushing of the upper sediment layers leads<br />
to a relatively thick oxygenated sediment layer <strong>and</strong> particle transport into the bed. (III) In the<br />
episodic advection zone (<strong>water</strong> depth � � max/2), episodic advection is due to oscillating flow-sediment<br />
topography interaction (see Fig. 8). (IV) In the wave pumping zone (�/2 � <strong>water</strong> depth �<br />
�), waves are only effective for the interfacial exchange due to pumping caused by hydrostatic<br />
pressure oscillations. In deeper areas, interfacial transport is governed by diffusion <strong>and</strong> bioirrigation.<br />
1681<br />
crease of the interfacial tracer flux relative to the controls<br />
with stagnant <strong>water</strong>, but how applicable are these results to<br />
natural environments? In shallow littoral regions, hydrodynamic<br />
settings almost identical to our flume settings may be<br />
found, <strong>and</strong> in such environments we can expect effects on<br />
<strong>pore</strong>-<strong>water</strong> exchange similar to those we observed in the<br />
laboratory. In situ measurements by <strong>Precht</strong> <strong>and</strong> <strong>Huettel</strong> (unpubl.<br />
data) in a littoral zone (70 cm <strong>water</strong> depth) with s<strong>and</strong>s<br />
of comparable permeability revealed filtration rates very<br />
similar to those recorded in the wave tank. The visual observations<br />
of dye transport by Webb <strong>and</strong> Theodor (1968)<br />
confirm this transport process for a permeable rippled bed<br />
at 3 m depth. Similar observations could be made in a rippled<br />
carbonate s<strong>and</strong> bed at 18 m <strong>water</strong> depth off the East<br />
coast of Oahu (M.H. unpubl. data). Wave ripples on the seabed<br />
are frequently found in areas with <strong>water</strong> depths �100<br />
m (e.g., Cacchione et al. 1999; Ogston <strong>and</strong> Sternberg 1999).<br />
These ripples disclose that surface gravity waves generated<br />
substantial oscillating flows at these depths that were capable<br />
of moving sediment. Where the sediment is permeable<br />
enough, such flows will generate advective <strong>pore</strong>-<strong>water</strong> exchange.<br />
Natural environments—Large sections of the world’s shelf<br />
areas display conditions that allow advective processes to<br />
occur: they are covered by permeable s<strong>and</strong>y sediments, display<br />
sediment topography in form of ripples, <strong>and</strong> are permanently<br />
or episodically reached by oscillating currents.<br />
Waves dominate sediment dynamics in large shelf areas,<br />
with the majority of sediment-transport occurring during<br />
times of energetic long period waves (e.g., Wiberg <strong>and</strong> Harris<br />
1994; Harris <strong>and</strong> Wiberg 1997). The extension of the<br />
shelf areas affected by waves was numerically assessed by<br />
Harris <strong>and</strong> Coleman (1998) with the result that, for example,<br />
in the North Atlantic, wave climate was such that quartz<br />
s<strong>and</strong>s of 100 �m diameter would be mobilized down to a
1682 <strong>Precht</strong> <strong>and</strong> <strong>Huettel</strong><br />
Fig. 8. Schematic overview of sediment <strong>water</strong>–interface processes in areas episodically affected by wave events. (a, calm phase) In the<br />
absence of effective interfacial transport mechanisms, permeable s<strong>and</strong>y sediments may accumulate solutes (e.g., silicate) <strong>and</strong> small particles<br />
in their <strong>pore</strong> space. (b, wave phase) At the beginning of a wave event, the exchange between the permeable sediment <strong>and</strong> the overlying<br />
<strong>water</strong> may be driven by advection linked to oscillating flow interacting with sediment topography (e.g., bioroughness; <strong>Huettel</strong> <strong>and</strong> Gust<br />
1992; Oldham <strong>and</strong> Lavery 1999) or existing relict ripples. (c, wave phase) With continuing wave action, oscillating bottom currents generate<br />
sediment ripples. Boundary flow–ripple interaction causes advective filtering that exchanges the <strong>pore</strong> <strong>water</strong> of the upper sediment layer;<br />
therefore, a maximum advective solute release takes place. (d, wave phase) With continuing wave action <strong>and</strong> after the maximum solute<br />
flux, oxygen-rich <strong>water</strong> is being filtered through the sediment, <strong>and</strong> mobile horizontal oxygen concentration gradients may develop (Shum<br />
1993). Ensuing alternating exposure to variable redox conditions may result in more complete <strong>and</strong> rapid decomposition of organic material<br />
trapped in the upper sediment layer (Aller 1994). An equilibrium solute flux develops, <strong>and</strong> constant intrusion of oxygen-rich <strong>water</strong> into the<br />
sediment may increase overall oxygen penetration depth into the sediment. (e, calm phase) After the wave event, the <strong>water</strong> exchange across<br />
the interface is reduced to its original low value, filtering is reduced, solute concentrations increase in the sediment, <strong>and</strong> the former oxygen<br />
penetration depth is reinstated.<br />
depth of 234 m at least once over a 3-yr period. Wiberg <strong>and</strong><br />
Harris (1994) showed the effects of <strong>water</strong> depth, wave<br />
height, wave period, <strong>and</strong> sediment grain size on ripple formation.<br />
They calculated that orbital ripples could form at a<br />
<strong>water</strong> depth of 100 m with a wave period of 12 s, 4 m wave<br />
height, <strong>and</strong> a sediment grain size of 250 �m.<br />
On the basis of literature cited throughout the present article<br />
<strong>and</strong> our results, we suggest that the coastal <strong>and</strong> shelf<br />
seas can be divided into four depth zones that show different<br />
sediment-<strong>water</strong> interaction processes due to surface gravity<br />
waves (Fig. 7). The first <strong>and</strong> uppermost zone (not addressed<br />
in the present study) is the beach, where the run-up of waves<br />
may cause filtering rates of up to 85 m 3 m �1 d �1 (McLachlan<br />
1989), which equals, dependent on the lateral extension of<br />
the filtering zone, �1,000 L m �2 d �1 . The second zone is<br />
made up of those shallow areas where the sediment is nearly<br />
permanently exposed to oscillating currents that cause filtration<br />
when they interact with bed topography. In the third<br />
zone, wave orbital motion reaches the seafloor only episodically,<br />
<strong>and</strong> in the fourth zone it never does. In the latter zone,<br />
wave-induced hydrostatic pressure oscillations may enhance<br />
sediment-<strong>water</strong> fluid exchange. The lateral extension of these<br />
zones varies, depending on the shelf slope <strong>and</strong> wave regime.<br />
With filtering rates of �1,000 L m �2 d �1 in beaches, 100 L<br />
m �2 d �1 caused by ripple-flow interaction, �30Lm �2 d �1<br />
by wave pumping (Riedl et al. 1972; Mu et al. 1999), <strong>and</strong><br />
molecular diffusion equivalent to a fluid exchange rate of<br />
�10 L m �2 d �1 , the ratio among the average rates caused by<br />
the four transport processes may be roughly 100 : 10 : 3 : 1.<br />
The wave-induced filtering, thus, generally increases with<br />
decreasing <strong>water</strong> depth, <strong>and</strong> our study suggests that this increase<br />
is not steady but displays stepwise changes in its increase<br />
rates because of the dominance of different wavedriven<br />
exchange processes in the four depth zones (Fig. 7).<br />
This is most obvious at the interface of the sublittoral zone<br />
<strong>and</strong> the adjacent beach. However, the boundary between<br />
zones with <strong>and</strong> without wave ripples can be abrupt <strong>and</strong><br />
sharp, <strong>and</strong> we can expect a jump in the filtration rate between<br />
those areas, as indicated by the sudden increase of flushing<br />
rate with evolving topography in our flume experiments. The<br />
changing magnitude of the filtration rate with depth may<br />
have ecological consequences that are linked to the associated<br />
changes in transport rates of metabolites into <strong>and</strong> out<br />
of the sediment.<br />
In the second zone, where waves have the strongest impact<br />
on the submerged seafloor, ripples are permanent features<br />
of the sediment surface, <strong>and</strong> steady advection leads to<br />
a complete <strong>and</strong> permanent flushing of the upper sediment<br />
layers, which therefore may be relatively rich in oxygen.<br />
Permanent advective transport of fine particles into the sed-
iment <strong>and</strong> steady flushing of decomposition products from<br />
the bed may convert these areas into efficient biocatalytic<br />
filters (<strong>Huettel</strong> et al. 1998).<br />
In our experiments, we measured strong initial pulses of<br />
solute release from the s<strong>and</strong>y sediment when ripples were<br />
formed. Such a scenario may take place in the third zone,<br />
where surface gravity waves reach the seafloor only episodically.<br />
The nutrient pulses Oldham <strong>and</strong> Lavery (1999) measured<br />
in such an environment could be attributed to this effect.<br />
Figure 8 proposes a sequence describing the solute<br />
fluxes across the sediment-<strong>water</strong> interface during an episodical<br />
storm event in the shallow, s<strong>and</strong>y shelf environment.<br />
Applicability of experiments—Our experimental sediment<br />
had a grain size distribution of 100–300 �m, which may be<br />
representative for the most common grain size on the continental<br />
shelves. Cacchione et al. (1999) <strong>and</strong> Ogston <strong>and</strong><br />
Sternberg (1999), for example, described shelf s<strong>and</strong>s with a<br />
grain size distribution of 125 <strong>and</strong> 250 �m <strong>and</strong> ripples with<br />
9 cm wavelength at 60 m <strong>water</strong> depth. Additionally, large<br />
areas of the shelves are covered by coarser, more permeable<br />
sediments (e.g., Emery 1968; Marinelli et al. 1998; Black<br />
<strong>and</strong> Oldman 1999), where advective processes may be much<br />
stronger than those observed in our flume experiments. The<br />
advective flux we observed during our experiments was<br />
mainly caused by the interaction of sediment topography <strong>and</strong><br />
boundary layer flow. All topography evolved as the response<br />
of the bed to the hydrodynamic conditions during the respective<br />
experiments. No artificial roughness elements were<br />
placed or built on the sediment surface. Thus, the bed roughness<br />
was in equilibrium with the surface gravity waves, <strong>and</strong><br />
the observed solute flux was not exaggerated by, for example,<br />
oversized sediment topography.<br />
However, under laboratory conditions, wave ripples may<br />
form that are different to those common in nature. Wiberg<br />
<strong>and</strong> Harris (1994) showed that most laboratory experiments<br />
produce orbital ripples, with ripple spacing proportional to<br />
the wave orbital diameter, <strong>and</strong> this was also the case in our<br />
experiments. In nature, nearly all wave ripples are of the<br />
anorbital or suborbital type, <strong>and</strong> their wavelengths are proportional<br />
to sediment grain size rather than to wave properties.<br />
For a natural environment, Wiberg <strong>and</strong> Harris (1994)<br />
predicted a ripple spacing of �10 cm for s<strong>and</strong> with a median<br />
grain size of 200 �m, which results in about one third of<br />
the ripples per unit area as in our experiments. Even with<br />
only one third of ripples per unit surface area <strong>and</strong> on the<br />
basis of the maximum but conservative filtering rate of 590<br />
Lm �2 d �1 we recorded, this would result in a filtering rate<br />
of �200Lm �2 d �1 .<br />
We suggest that the numerical approaches developed to<br />
calculate advective filtering under unidirectional flow can be<br />
used to obtain conservative estimates of wave-induced advective<br />
exchange. We can estimate the magnitude <strong>and</strong> importance<br />
of these processes by applying these relationships<br />
to field data from previous studies. Cacchione et al. (1999)<br />
presented data from the Eel continental shelf, situated at �50<br />
m <strong>water</strong> depth. Using values of 40 cm s �1 for u (120 cm<br />
over sediment), 9 cm ripple amplitude, 1.1 cm ripple height<br />
(calculated with a ripple steepness of 0.12; Wiberg <strong>and</strong> Harris<br />
1994), <strong>and</strong> 1.5 � 10 �11 m 2 permeability (assumed to be<br />
Wave-driven advection<br />
1683<br />
similar to that in the present study because of the similar<br />
grain size), we obtained a filtering rate of 103 L m �2 d �1 .Li<br />
<strong>and</strong> Amos (1999) conducted a field study on the Nova Scotia<br />
shelf at 56 m <strong>water</strong> depth. With a maximal wave-induced u<br />
� 25 cm s �1 (50 cm over sediment), ripple amplitude L D �<br />
9 cm; (calculated) ripple height � � 1.1 cm, <strong>and</strong> an assumed<br />
permeability of 1.5 � 10 �11 m 2 , we calculated 68 L m �2 d �1<br />
of advective filtering during single events, whereas, during<br />
calmer periods with bottom currents below 10 cm s �1 , calculated<br />
filtering was reduced to 11 L m �2 d �1 . On the basis<br />
of these calculations <strong>and</strong> our experimental findings, we conclude<br />
that 50–100 L m �2 d �1 is a moderate value for advective<br />
filtering in permeable shelf sediments exposed to oscillating<br />
flow. Sediments only episodically reached by waves<br />
may display similar filtering rates but only during storm<br />
events. In these beds, however, wave pumping by hydrostatic<br />
pressure oscillations may constantly enhance solute release.<br />
The ecological relevance of wave-induced filtration is<br />
linked to the high load of organic matter commonly present<br />
in nearshore <strong>water</strong>s. In contrast to continuous <strong>pore</strong>-<strong>water</strong> advection<br />
caused by constant unidirectional flow, wave-induced<br />
<strong>pore</strong>-<strong>water</strong> exchange is characterized by pulsing flow<br />
due to the constant acceleration <strong>and</strong> deceleration of the<br />
boundary current. These pulsing flows can transport particulate<br />
matter efficiently through the <strong>pore</strong> space, thereby enhancing<br />
the filtration capacity of the bed. Surface gravity<br />
waves convert the s<strong>and</strong> sediments ubiquitous in the shallow<br />
shelf into effective filter systems, which suggests that these<br />
beds are sites for rapid mineralization <strong>and</strong> recycling.<br />
References<br />
ALLER, R. C. 1982. The effects of macrobenthos on chemical properties<br />
of marine sediment <strong>and</strong> overlying <strong>water</strong>, p. 53–102. In<br />
P. L. McCall <strong>and</strong> M. J. S. Tevesz [eds.], Animal-sediment relations.<br />
Plenum.<br />
. 1994. Bioturbation <strong>and</strong> remineralization of sedimentary organic<br />
matter: effects of redox oscillation. Chem. Geol. 114:<br />
331–345.<br />
. 2001. Transport <strong>and</strong> reactions in the bioirrgated zone, p.<br />
269–301. In B. P. Boudreau <strong>and</strong> B. B. Jørgensen [eds.], The<br />
benthic boundary layer. Oxford Univ. Press.<br />
BERNER, R. A. 1980. Early diagenesis—a theoretical approach.<br />
Princeton Univ. Press.<br />
BLACK, K.P., AND J. W. OLDMAN. 1999. Wave mechanisms responsible<br />
for grain sorting <strong>and</strong> non-uniform ripple distribution<br />
across two moderate-energy, s<strong>and</strong>y continental shelves. Mar.<br />
Geol. 162: 121–132.<br />
CACCHIONE, D. A., P. L. WIBERG, J.LYNCH, J.IRISH, AND P. TRAY-<br />
KOVSKI. 1999. Estimates of suspended-sediment flux <strong>and</strong> bedform<br />
activity on the inner portion of the Eel continental shelf.<br />
Mar. Geol. 154: 83–97.<br />
CALDWELL, D.R.,AND T. M. CHRISS. 1979. The viscous sublayer<br />
at the sea floor. Science 205: 1131–1132.<br />
DENNY, M. W. 1988. Biology <strong>and</strong> the mechanics of the wave-swept<br />
environment. Princeton Univ. Press.<br />
ELLIOTT, A. H. 1990. Transfer of solutes into <strong>and</strong> out of streambeds.<br />
Ph.D. thesis, California Institute of Technology.<br />
EMERY, K. O. 1968. Relict sediments on continental shelves of the<br />
world. Am. Assoc. Pet. Geol. Bull. 52: 445–464.<br />
FORSTER, S., M. HUETTEL, AND W. ZIEBIS. 1996. Impact of boundary<br />
layer flow velocity on oxygen utilisation in coastal sediments.<br />
Mar. Ecol. Prog. Ser. 143: 173–185.
1684 <strong>Precht</strong> <strong>and</strong> <strong>Huettel</strong><br />
HARRIS, C.K.,AND P. L. WIBERG. 1997. Approaches to quantifying<br />
long-term continental shelf sediment transport with an example<br />
from the Northern California STRESS mid-shelf site. Cont.<br />
Shelf Res. 17: 1389–1418.<br />
HARRIS, P.T.,AND R. COLEMAN. 1998. Estimating global shelf sediment<br />
mobility due to swell waves. Mar. Geol. 150: 171–177.<br />
HARRISON, W. D., D. MUSGRAVE, AND W. S. REEBURGH. 1983. A<br />
wave-induced transport process in marine sediments. J. Geophys.<br />
Res. 88: 7617–7622.<br />
HSÜ, K. J. 1989. Physical principles of sedimentology. Springer<br />
Verlag.<br />
HUETTEL, M., AND G. GUST. 1992. Impact of bioroughness on interfacial<br />
solute exchange in permeable sediments. Mar. Ecol.<br />
Prog. Ser. 89: 253–267.<br />
, AND A. RUSCH. 2000. Transport <strong>and</strong> degradation of phytoplankton<br />
in permeable sediment. Limnol. Oceanogr. 45: 534–<br />
549.<br />
, AND I. T. WEBSTER. 2001. Pore<strong>water</strong> flow in permeable<br />
sediments, p. 144–179. In B. P. Boudreau <strong>and</strong> B. B. Jørgensen<br />
[eds.], The benthic boundary layer. Oxford Univ. Press.<br />
,W.ZIEBIS, AND S. FORSTER. 1996. Flow-induced uptake of<br />
particulate matter in permeable sediments. Limnol. Oceanogr.<br />
41: 309–322.<br />
, , , AND G. I. LUTHER. 1998. <strong>Advective</strong> transport<br />
affecting metal <strong>and</strong> nutrient distribution <strong>and</strong> interfacial<br />
fluxes in permeable sediments. Geochim. Cosmochim. Acta<br />
62: 613–631.<br />
KLUTE, A., AND C. DIRKSEN. 1986. Hydraulic conductivity <strong>and</strong> diffusivity:<br />
Laboratory methods, p. 687–734. In A. Klute [ed.],<br />
Methods of soil analysis. Part 1, Physical <strong>and</strong> mineralogical<br />
methods. American Society of Agronomy.<br />
KRÖGEL, F. 1997. Einfluß von Viskosität und Dichte des Seewassers<br />
auf Transport und Ablagerung von Wattsedimenten (Langeooger<br />
Rückseitenwatt, südliche Nordsee). Berichte aus dem<br />
Fachbereich Geowissenschaften der Universität Bremen. 102.<br />
LI, M.Z.,AND C. L. AMOS. 1999. Field observations of bedforms<br />
<strong>and</strong> sediment transport thresholds of fine s<strong>and</strong> under combined<br />
waves <strong>and</strong> currents. Mar. Geol. 158: 147–160.<br />
MALAN, D.E.,AND A. MCLACHLAN. 1991. In situ benthic oxygen<br />
fluxes in a nearshore coastal marine system: A new approach<br />
to quantify the effect of wave action. Mar. Ecol. Prog. Ser. 73:<br />
69–81.<br />
MARINELLI, R. L., R. A. JAHNKE, D.B.CRAVEN, J.R.NELSON, AND<br />
J. E. ECKMAN. 1998. Sediment nutrient dynamics on the South<br />
Atlantic Bight continental shelf. Limnol. Oceanogr. 43: 1305–<br />
1320.<br />
MCLACHLAN, A. 1989. Water filtration by dissipative beaches. Limnol.<br />
Oceanogr. 34: 774–780.<br />
MU, Y. K., A. H. D. CHENG, M.BADIEY, AND R. BENNETT. 1999.<br />
Water wave driven seepage in sediment <strong>and</strong> parameter inversion<br />
based on <strong>pore</strong> pressure data. Int. J. Num. Anal. Methods<br />
Geomech. 23: 1655–1674.<br />
OGSTON, A.S., AND R. W. STERNBERG. 1999. Sediment-transport<br />
events on the northern California continental shelf. Mar. Geol.<br />
154: 69–82.<br />
OLDHAM, C. E., AND P. S. LAVERY. 1999. Pore<strong>water</strong> nutrient fluxes<br />
in a shallow fetch-limited estuary. Mar. Ecol. Prog. Ser. 183:<br />
39–47.<br />
REY, V., A. G. DAVIES, AND M. BELZONS. 1995. On the formation<br />
of bars by the action of waves on an erodible bed—a laboratory<br />
study. J. Coast. Res. 11: 1180–1194.<br />
RIEDL, R. J., N. HUANG, AND R. MACHAN. 1972. The subtidal<br />
pump: A mechanism of interstitial <strong>water</strong> exchange by wave<br />
action. Mar. Biol. 13: 210–221.<br />
RUTGERS VAN DER LOEFF, M. M. 1981. Wave effects on sediment<br />
<strong>water</strong> exchange in a submerged s<strong>and</strong> bed. Neth. J. Sea Res.<br />
15: 100–112.<br />
RUTHERFORD, J. C., J. D. BOYLE, A.H.ELLIOTT, T.V.J.HATH-<br />
ERELL, AND T. W. CHIU. 1995. Modeling benthic oxygen-uptake<br />
by pumping. J. Environ. Eng. ASCE 121: 84–95.<br />
SAVANT, S. A., D. D. REIBLE, AND L. J. THIBODEAUX. 1987. Convective<br />
transport within stable river sediments. Water Resour.<br />
Res. 23: 1763–1768.<br />
SHUM, K. T. 1992. Wave-induced advective transport below a rippled<br />
<strong>water</strong>-sediment interface. J. Geophys. Res. 97: 789–808.<br />
. 1993. The effects of wave-induced <strong>pore</strong> <strong>water</strong> circulation<br />
on the transport of reactive solutes below a rippled sediment<br />
bed. J. Geophys. Res. 98: 10289–10301.<br />
, AND B. SUNDBY. 1996. Organic matter processing in continental<br />
shelf sediments—the subtidal pump revisited. Mar.<br />
Chem. 53: 81–87.<br />
THIBODEAUX, L.J., AND J. D. BOYLE. 1987. Bedform-generated<br />
convective transport in bottom sediment. Nature 325: 341–343.<br />
WEBB, J.E., AND J. L. THEODOR. 1968. Irrigation of submerged<br />
marine s<strong>and</strong>s through wave action. Nature 220: 682–683.<br />
, AND . 1972. Wave-induced circulation in submerged<br />
s<strong>and</strong>s. J. Mar. Biol. Assoc. U.K. 52: 903–914.<br />
WEBSTER, I. T., S. J. NORQUAY, F.C.ROSS, AND R. A. WOODING.<br />
1996. Solute exchange by convection within estuarine sediments.<br />
Estuar. Coast. Shelf Sci. 42: 171–183.<br />
WIBERG, P. L., AND C. K. HARRIS. 1994. Ripple geometry in wavedominated<br />
environments. J. Geophys. Res. 99: 775–789.<br />
ZIEBIS, W., M. HUETTEL, AND S. FORSTER. 1996. Impact of biogenic<br />
sediment topography on oxygen fluxes in permeable seabeds.<br />
Mar. Ecol. Prog. Ser. 140: 227–237.<br />
Received: 27 September 2002<br />
Accepted: 19 January 2003<br />
Amended: 21 February 2003