Correspondence/Amendment 5 Comments - New England Fishery ...
Correspondence/Amendment 5 Comments - New England Fishery ...
Correspondence/Amendment 5 Comments - New England Fishery ...

Create successful ePaper yourself
Turn your PDF publications into a flip-book with our unique Google optimized e-Paper software.
zt<br />
ã¡<br />
,, r:.cl<br />
::' {<br />
_,.,i<br />
locations benthic eggs are spawned in large masses that are<br />
neither buried nor guarded. Numerous egg predators have been<br />
documented, although consistently haddock (Melanogrammus<br />
aeglefinus) are identified as the overwhelmingly dominant predator<br />
(Mateials and Methods, Background). We hypothesize that<br />
egg predation by haddock causes alternate stable population<br />
levels in the Georges Bank spawning subpopulation of herring;<br />
this subpopulation is estimated to account lor -90Vo of the Gulf<br />
of Maine/Georges Bank population.<br />
Results<br />
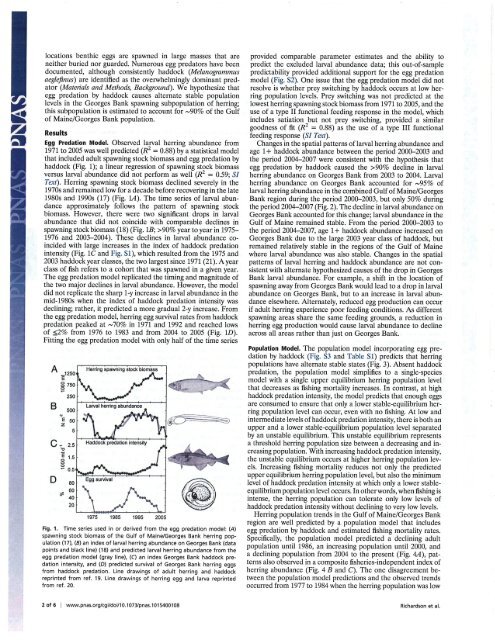
Egg Predation Model. Observed larval herring abundance from<br />
I97l to 2005 was well predicted (R' = 0.88) by a statistical model<br />
that included adult spawning stock biomass and egg predation by<br />
haddock (Fig. 1); a linear regression of spawning stock biomass<br />
versus lawal abundance did not perform-as wef (R2 = 0.59; 51<br />
Zert). Herring spawning stock biomass declined severely in the<br />
1970s and remained low for a decade before recovering in the late<br />
1980s and 1990s (17) (Fig. La). The time series of larval abundance<br />
approxirnately follows the pattern of spawning stock<br />
biomass, However, there were two sþificant drops in lawal<br />
abundance that did not coincide with comparable declines in<br />
spawning stock biomass (18) (Fig. lB; >90Vo year to year in 1975-<br />
1976 and 2003¿004). These declines in larval abundance coincided<br />
with large increases in the index of haddock predation<br />
intensity (Fig. 1C and Fig. 5L), which resulted from the 1975 and<br />
2003 haddock year classes, the two largest since 1971 (2L). Ayear<br />
class offish refers to a cohort that was spawned in a given year.<br />
The egg predation model replicated the timing and magnitude of<br />
the two major declines in larval abundance. However, the model<br />
did not replicate the sharp 1-y increase in larval abundance in the<br />
mid-1980s when the index of haddock predation intensity was<br />
declining; rather, it predicted a more gradual 2-y increase. From<br />
the egg predation model, herring egg survival rates from haddock<br />
predation peaked at -70Vo n 1971, and 1992 and reached lows<br />
of 90Vo decltne in larval<br />
herring abundance on Georges Bank from 2003 to 2004. Larval<br />
herring abundance on Georges Bank accounted ûor -95Vo of<br />
lawal herring abundance in the combined Gulf of Maine/Georges<br />
Bank region during the period 2000-2003, but only 50% during<br />
the period 2004-2007 (Fig.2). The decline in larval abundance on<br />
Georges Bank accounted for this change; larval abundance in the<br />
Gulf of Maine remained stable. From the period 2000-2003 to<br />
the period 2004-2007, age 1* haddock abundance increased on<br />
Georges Bank due to the large 2003 year class of haddock, but<br />
remained relatively stable in the regions of the Gulf of Maine<br />
where larval abundance was also stable. Changes in the spatial<br />
patterns of larval herring and haddock abundance are not consistent<br />
with alternate hypothesized causes of the drop in Georges<br />
Bank larval abundance. For example, a shift in the location of<br />
spawning away from Georges Bank would lead to a drop in larval<br />
abundance on Georges Bank, but to an increase in larval abundance<br />
elsewhere. Alternately, reduced egg production can occur<br />
if adult herring experience poor feeding conditions. As different<br />
spawning areas share the same feeding grounds, a reduction in<br />
herring egg production would cause larval abundance to decline<br />
across all areas rather than just on Georges Bank.<br />
Population Model. The population model incorporating egg predation<br />
by haddock (Fig. 53 and Table 51) predicts that herring<br />
populations have altemate stable states (Fig. 3). Absent haddock<br />
predation, the population model simplifies to a single-species<br />
model with a single upper equilibrium herring population level<br />
that decreases as fishing mortality increases. In contrast, at high<br />
haddock predation intensity, the model predicts that enough eggs<br />
are consumed to ensure that only a lower stable-equilibrium herring<br />
population level can occur, even with no fishing. At low and<br />
intermediate levels ofhaddock predation intensity, there is both an<br />
upper and a lower stable-equilibrium population level separated<br />
by an unstable equilibrium. This unstable equilibrium represents<br />
a threshold herring population size between a decreasing and increasing<br />
population. With increasing haddock predation intensity,<br />
the unstable equilibrium occurs at higher herring population levels.<br />
Increasing fishing mortality reduces not only the predicted<br />
upper equilibrium herring population level, but also the minimum<br />
level of haddock predation intensity at which only a lower stableequilibrium<br />
population level occurs. In otherwords, when fishing is<br />
intense, the herring population can tolerate only low levels of<br />
haddock predation intensity without declining to very low levels.<br />
Herring population trends in the Gulf of Maine/Georges Bank<br />
region are well predicted by a population model that includes<br />
egg predation by haddock and estimated fishing mortality rates.<br />
Specifically, the population model predicted a declining adult<br />
population until 1986, an increasing population until 2000, and<br />
a declining population from 2004 to the present (Fig.4A), patterns<br />
also obsewed in a composite fisheries-independent index of<br />
herring abundance (Fig. 4 B and C). The one disagreement between<br />
the population model predictions and the observed trends<br />
occurred from1977 to 1984 when the herring population was low<br />
Richardson et al