

Gastrointestinal Oncology - World Journal of Gastroenterology
Gastrointestinal Oncology - World Journal of Gastroenterology
Gastrointestinal Oncology - World Journal of Gastroenterology

You also want an ePaper? Increase the reach of your titles
YUMPU automatically turns print PDFs into web optimized ePapers that Google loves.
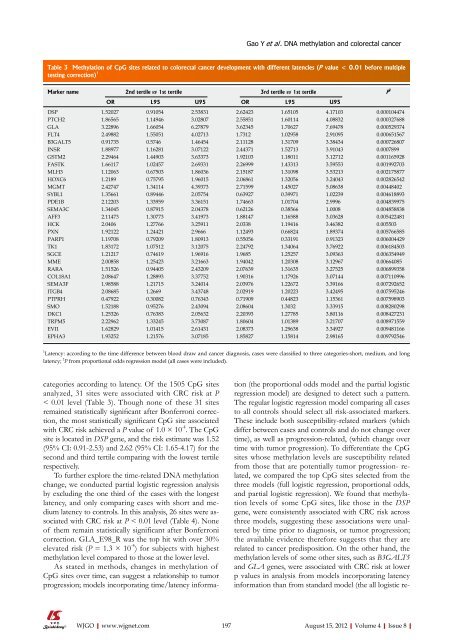
Table 3 Methylation <strong>of</strong> CpG sites related to colorectal cancer development with different latencies (P value < 0.01 before multiple<br />
testing correction) 1<br />
Marker name 2nd tertile vs 1st tertile 3rd tertile vs 1st tertile P 2<br />
OR L95 U95 OR L95 U95<br />
DSP 1.52027 0.91054 2.53831 2.62423 1.65105 4.17103 0.000104474<br />
PTCH2 1.86565 1.14946 3.02807 2.55851 1.60114 4.08832 0.000327688<br />
GLA 3.22896 1.66054 6.27879 3.62345 1.70627 7.69478 0.000529374<br />
FLT4 2.49882 1.55051 4.02713 1.7312 1.02958 2.91095 0.000651567<br />
B3GALT5 0.91735 0.5746 1.46454 2.11128 1.31709 3.38434 0.000726807<br />
INSR 1.88977 1.16281 3.07122 2.44371 1.52713 3.91043 0.0007899<br />
GSTM2 2.29464 1.44903 3.63373 1.92103 1.18011 3.12712 0.001165928<br />
FASTK 1.66117 1.02457 2.69331 2.26999 1.43313 3.59553 0.001992703<br />
MLH3 1.12063 0.67503 1.86036 2.15187 1.31098 3.53213 0.002175877<br />
HOXC6 1.2189 0.75795 1.96015 2.06861 1.32056 3.24043 0.002826542<br />
MGMT 2.42747 1.34114 4.39373 2.71599 1.45027 5.08638 0.00448402<br />
SYBL1 1.35661 0.89446 2.05754 0.63927 0.39971 1.02239 0.004618893<br />
PDE1B 2.12203 1.33959 3.36151 1.74663 1.01704 2.9996 0.004839975<br />
SEMA3C 1.34045 0.87915 2.04378 0.62126 0.38566 1.0008 0.004858838<br />
AFF3 2.11473 1.30773 3.41973 1.88147 1.16588 3.03628 0.005422481<br />
HCK 2.0406 1.27766 3.25911 2.0338 1.19416 3.46382 0.005503<br />
PXN 1.92122 1.24421 2.9666 1.12493 0.66824 1.89374 0.005766585<br />
PARP1 1.19708 0.79209 1.80913 0.55056 0.33191 0.91323 0.006004429<br />
TK1 1.83172 1.07512 3.12075 2.24792 1.34064 3.76922 0.006184503<br />
SGCE 1.21217 0.74619 1.96916 1.9685 1.25257 3.09363 0.006354949<br />
MME 2.00858 1.25423 3.21663 1.94042 1.20308 3.12967 0.00664085<br />
RARA 1.51526 0.94405 2.43209 2.07639 1.31635 3.27525 0.006899358<br />
COL18A1 2.08647 1.28893 3.37752 1.90316 1.17926 3.07144 0.007110996<br />
SEMA3F 1.98588 1.21715 3.24014 2.03976 1.22672 3.39166 0.007292652<br />
ITGB4 2.08685 1.2669 3.43748 2.02919 1.20223 3.42495 0.007595246<br />
PTPRH 0.47922 0.30082 0.76343 0.71909 0.44823 1.15361 0.007598903<br />
SMO 1.52188 0.95276 2.43094 2.08604 1.3032 3.33915 0.008280298<br />
DKC1 1.25326 0.76383 2.05632 2.20393 1.27785 3.80116 0.008427231<br />
TRPM5 2.22962 1.33245 3.73087 1.80604 1.01389 3.21707 0.008971559<br />
EVI1 1.62829 1.01415 2.61431 2.08373 1.29638 3.34927 0.009481166<br />
EPHA3 1.93252 1.21576 3.07185 1.85827 1.15814 2.98165 0.009792546<br />
1 Latency: according to the time difference between blood draw and cancer diagnosis, cases were classified to three categories-short, medium, and long<br />
latency; 2 P from proportional odds regression model (all cases were included).<br />
categories according to latency. Of the 1505 CpG sites<br />
analyzed, 31 sites were associated with CRC risk at P<br />
< 0.01 level (Table 3). Though none <strong>of</strong> these 31 sites<br />
remained statistically significant after Bonferroni correction,<br />
the most statistically significant CpG site associated<br />
with CRC risk achieved a P value <strong>of</strong> 1.0 × 10 -4 . The CpG<br />
site is located in DSP gene, and the risk estimate was 1.52<br />
(95% CI: 0.91-2.53) and 2.62 (95% CI: 1.65-4.17) for the<br />
second and third tertile comparing with the lowest tertile<br />
respectively.<br />
To further explore the time-related DNA methylation<br />
change, we conducted partial logistic regression analysis<br />
by excluding the one third <strong>of</strong> the cases with the longest<br />
latency, and only comparing cases with short and medium<br />
latency to controls. In this analysis, 26 sites were associated<br />
with CRC risk at P < 0.01 level (Table 4). None<br />
<strong>of</strong> them remain statistically significant after Bonferroni<br />
correction. GLA_E98_R was the top hit with over 30%<br />
elevated risk (P = 1.3 × 10 -4 ) for subjects with highest<br />
methylation level compared to those at the lower level.<br />
As stated in methods, changes in methylation <strong>of</strong><br />
CpG sites over time, can suggest a relationship to tumor<br />
progression; models incorporating time/latency informa-<br />
Gao Y et al . DNA methylation and colorectal cancer<br />
tion (the proportional odds model and the partial logistic<br />
regression model) are designed to detect such a pattern.<br />
The regular logistic regression model comparing all cases<br />
to all controls should select all risk-associated markers.<br />
These include both susceptibility-related markers (which<br />
differ between cases and controls and do not change over<br />
time), as well as progression-related, (which change over<br />
time with tumor progression). To differentiate the CpG<br />
sites whose methylation levels are susceptibility related<br />
from those that are potentially tumor progression- related,<br />
we compared the top CpG sites selected from the<br />
three models (full logistic regression, proportional odds,<br />
and partial logistic regression). We found that methylation<br />
levels <strong>of</strong> some CpG sites, like those in the DSP<br />
gene, were consistently associated with CRC risk across<br />
three models, suggesting these associations were unaltered<br />
by time prior to diagnosis, or tumor progression;<br />
the available evidence therefore suggests that they are<br />
related to cancer predisposition. On the other hand, the<br />
methylation levels <strong>of</strong> some other sites, such as B3GALT5<br />
and GLA genes, were associated with CRC risk at lower<br />
p values in analysis from models incorporating latency<br />
information than from standard model (the all logistic re-<br />
WJGO|www.wjgnet.com 197<br />
August 15, 2012|Volume 4|Issue 8|


