DRAFT IMECE2007-43427 - Czech Technical University in Prague
DRAFT IMECE2007-43427 - Czech Technical University in Prague
DRAFT IMECE2007-43427 - Czech Technical University in Prague

You also want an ePaper? Increase the reach of your titles
YUMPU automatically turns print PDFs into web optimized ePapers that Google loves.
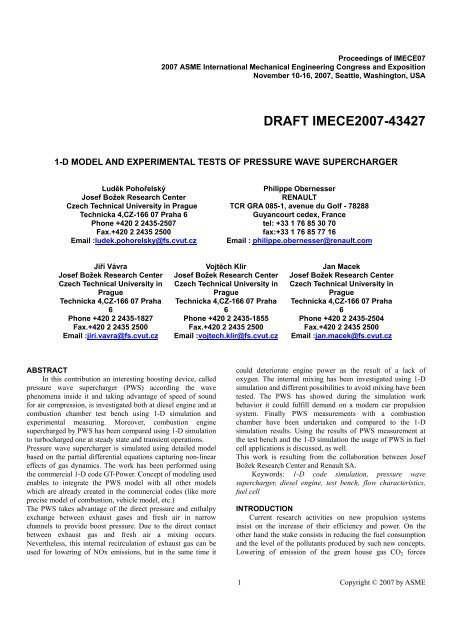
Proceed<strong>in</strong>gs of IMECE07<br />
2007 ASME International Mechanical Eng<strong>in</strong>eer<strong>in</strong>g Congress and Exposition<br />
November 10-16, 2007, Seattle, Wash<strong>in</strong>gton, USA<br />
<strong>DRAFT</strong> <strong>IMECE2007</strong>-<strong>43427</strong><br />
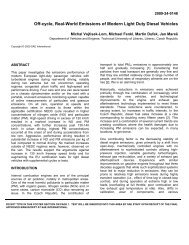
1-D MODEL AND EXPERIMENTAL TESTS OF PRESSURE WAVE SUPERCHARGER<br />
Luděk Pohořelský<br />
Josef Božek Research Center<br />
<strong>Czech</strong> <strong>Technical</strong> <strong>University</strong> <strong>in</strong> <strong>Prague</strong><br />
Technicka 4,CZ-166 07 Praha 6<br />
Phone +420 2 2435-2507<br />
Fax.+420 2 2435 2500<br />
Email :ludek.pohorelsky@fs.cvut.cz<br />
Jiří Vávra<br />
Josef Božek Research Center<br />
<strong>Czech</strong> <strong>Technical</strong> <strong>University</strong> <strong>in</strong><br />
<strong>Prague</strong><br />
Technicka 4,CZ-166 07 Praha<br />
6<br />
Phone +420 2 2435-1827<br />
Fax.+420 2 2435 2500<br />
Email :jiri.vavra@fs.cvut.cz<br />
ABSTRACT<br />
In this contribution an <strong>in</strong>terest<strong>in</strong>g boost<strong>in</strong>g device, called<br />
pressure wave supercharger (PWS) accord<strong>in</strong>g the wave<br />
phenomena <strong>in</strong>side it and tak<strong>in</strong>g advantage of speed of sound<br />
for air compression, is <strong>in</strong>vestigated both at diesel eng<strong>in</strong>e and at<br />
combustion chamber test bench us<strong>in</strong>g 1-D simulation and<br />
experimental measur<strong>in</strong>g. Moreover, combustion eng<strong>in</strong>e<br />
supercharged by PWS has been compared us<strong>in</strong>g 1-D simulation<br />
to turbocharged one at steady state and transient operations.<br />
Pressure wave supercharger is simulated us<strong>in</strong>g detailed model<br />
based on the partial differential equations captur<strong>in</strong>g non-l<strong>in</strong>ear<br />
effects of gas dynamics. The work has been performed us<strong>in</strong>g<br />
the commercial 1-D code GT-Power. Concept of model<strong>in</strong>g used<br />
enables to <strong>in</strong>tegrate the PWS model with all other models<br />
which are already created <strong>in</strong> the commercial codes (like more<br />
precise model of combustion, vehicle model, etc.)<br />
The PWS takes advantage of the direct pressure and enthalpy<br />
exchange between exhaust gases and fresh air <strong>in</strong> narrow<br />
channels to provide boost pressure. Due to the direct contact<br />
between exhaust gas and fresh air a mix<strong>in</strong>g occurs.<br />
Nevertheless, this <strong>in</strong>ternal recirculation of exhaust gas can be<br />
used for lower<strong>in</strong>g of NOx emissions, but <strong>in</strong> the same time it<br />
Philippe Obernesser<br />
RENAULT<br />
TCR GRA 085-1, avenue du Golf - 78288<br />
Guyancourt cedex, France<br />
tel: +33 1 76 85 30 70<br />
fax:+33 1 76 85 77 16<br />
Email : philippe.obernesser@renault.com<br />
Vojtěch Klír<br />
Josef Božek Research Center<br />
<strong>Czech</strong> <strong>Technical</strong> <strong>University</strong> <strong>in</strong><br />
<strong>Prague</strong><br />
Technicka 4,CZ-166 07 Praha<br />
6<br />
Phone +420 2 2435-1855<br />
Fax.+420 2 2435 2500<br />
Email :vojtech.klir@fs.cvut.cz<br />
Jan Macek<br />
Josef Božek Research Center<br />
<strong>Czech</strong> <strong>Technical</strong> <strong>University</strong> <strong>in</strong><br />
<strong>Prague</strong><br />
Technicka 4,CZ-166 07 Praha<br />
6<br />
Phone +420 2 2435-2504<br />
Fax.+420 2 2435 2500<br />
Email :jan.macek@fs.cvut.cz<br />
could deteriorate eng<strong>in</strong>e power as the result of a lack of<br />
oxygen. The <strong>in</strong>ternal mix<strong>in</strong>g has been <strong>in</strong>vestigated us<strong>in</strong>g 1-D<br />
simulation and different possibilities to avoid mix<strong>in</strong>g have been<br />
tested. The PWS has showed dur<strong>in</strong>g the simulation work<br />
behavior it could fulfill demand on a modern car propulsion<br />
system. F<strong>in</strong>ally PWS measurements with a combustion<br />
chamber have been undertaken and compared to the 1-D<br />
simulation results. Us<strong>in</strong>g the results of PWS measurement at<br />
the test bench and the 1-D simulation the usage of PWS <strong>in</strong> fuel<br />
cell applications is discussed, as well.<br />
This work is result<strong>in</strong>g from the collaboration between Josef<br />
Božek Research Center and Renault SA.<br />
Keywords: 1-D code simulation, pressure wave<br />
supercharger, diesel eng<strong>in</strong>e, test bench, flow characteristics,<br />
fuel cell<br />
INTRODUCTION<br />
Current research activities on new propulsion systems<br />
<strong>in</strong>sist on the <strong>in</strong>crease of their efficiency and power. On the<br />
other hand the stake consists <strong>in</strong> reduc<strong>in</strong>g the fuel consumption<br />
and the level of the pollutants produced by such new concepts.<br />
Lower<strong>in</strong>g of emission of the green house gas CO2 forces<br />
1 Copyright © 2007 by ASME
manufactures to develop more economical vehicle and<br />
therefore more efficient eng<strong>in</strong>es. Moreover, <strong>in</strong> case of car<br />
propulsion systems the satisfactory driveability to satisfy<br />
driver’s demands dur<strong>in</strong>g the accelerations has to be provided at<br />
the same time. An approach of utilization of downsized<br />
propulsion systems may lead successfully up to these aims. The<br />
ma<strong>in</strong> idea of downsiz<strong>in</strong>g is the reduction of the swept volume<br />
of the eng<strong>in</strong>e without lower<strong>in</strong>g the orig<strong>in</strong>al output power. The<br />
performance <strong>in</strong>crease of the downsized eng<strong>in</strong>e to the same<br />
power level of the orig<strong>in</strong>al one is achieved by boost<strong>in</strong>g devices.<br />
Eng<strong>in</strong>e researchers and developers are nowadays wonder<strong>in</strong>g,<br />
which boost<strong>in</strong>g devices are the most suitable and so are try<strong>in</strong>g<br />
to f<strong>in</strong>d compromises with regards to costs, packag<strong>in</strong>g, eng<strong>in</strong>e<br />
behavior and emission regulations. In addition to commonly<br />
utilized turbocharger mechanical superchargers as for <strong>in</strong>stance<br />
Roots-type supercharger are more and more placed on the<br />
market. In comparison with these boost<strong>in</strong>g devices the pressure<br />
wave supercharger (PWS) with usage of today’s control<br />
possibilities represents ma<strong>in</strong>ly <strong>in</strong> transient and low-end torque<br />
behavior an extraord<strong>in</strong>ary possibility. The PWS takes<br />
advantages of a unique pr<strong>in</strong>ciple of direct pressure energy<br />
exchange between the exhaust gas and the fresh air <strong>in</strong> a narrow<br />
channel us<strong>in</strong>g nearly 1-D unsteady flow with a dist<strong>in</strong>ctive<br />
contact surface between the both gases.<br />
The idea of the energy exchange between two mediums without<br />
any separation goes down to the beg<strong>in</strong>n<strong>in</strong>g of the 20 th century.<br />
Namely <strong>in</strong> its second decade, along the longitud<strong>in</strong>al axis<br />
perforated drum, a channeled rotor, has been patented by the<br />
German eng<strong>in</strong>eer Burghard - [24] - a mach<strong>in</strong>e deliver<strong>in</strong>g an<br />
un<strong>in</strong>terrupted mass flow of the pressurized air. As the unsteady<br />
flow theory, a necessity for the development of a usable<br />
mach<strong>in</strong>e has not been developed until the 1920’s and 1930’s,<br />
the Burghard’s <strong>in</strong>vention did not succeed to an available<br />
device.<br />
In the 1940’s, the Brown Boveri (BBC, today ABB)<br />
turbocharger eng<strong>in</strong>eer Seippel designed a pressure exchanger<br />
as an air compressor of a gas turb<strong>in</strong>e used as the propulsion of<br />
an experimental locomotive - [28]. He started to call this<br />
exchanger COMPREX accord<strong>in</strong>g to the processes <strong>in</strong> the rotor –<br />
“compression-expansion”.<br />
In the 1950’s took place first experimental attempts <strong>in</strong> us<strong>in</strong>g<br />
COMPREX for supercharg<strong>in</strong>g of truck diesel eng<strong>in</strong>es - [12],<br />
[26], <strong>in</strong> framework of partnership among the ETH Zürich, the<br />
I-T-E Circuit Breaker Company, the BBC and the Saurer<br />
Company.<br />
In the 1970‘s, first experiments of COMPREX supercharged<br />
car diesel eng<strong>in</strong>es followed (partnership between BBC and<br />
Mercedes-Benz) – [30]. In 1979 BBC developed a race version<br />
of PWS for supercharg<strong>in</strong>g of F1 eng<strong>in</strong>e [10], which has been<br />
used only for the practice runs. In 1995, the Swissauto Wenko<br />
Company, which is deal<strong>in</strong>g with development of pressure wave<br />
supercharger up to now - [19], designed for the environmental<br />
organization Greenpeace a so-called SmiLE car with SI eng<strong>in</strong>e<br />
with displacement of 360cm 3 and PWS supercharg<strong>in</strong>g – [20].<br />
Moreover, <strong>in</strong> 1980’s many companies tested the COMPREX -<br />
supercharged diesel eng<strong>in</strong>es, but only two started the serial<br />
production. The Opel Company sold <strong>in</strong> a special Opel Senator<br />
set of about 700 units with 2.3l diesel eng<strong>in</strong>e and pressure<br />
wave supercharg<strong>in</strong>g – [31] whereas Mazda sold about 150 000<br />
COMPREX diesel passenger cars – [4].<br />
Recently, several Universities (ETH Zürich, Indiana <strong>University</strong><br />
Purdue <strong>University</strong> Indianapolis, Michigan State <strong>University</strong>,<br />
<strong>University</strong> of Tokyo, Warsaw <strong>University</strong> and Beij<strong>in</strong>g<br />
<strong>University</strong> of Technology), companies (Swissauto Eng<strong>in</strong>eer<strong>in</strong>g<br />
S.A., Rolls Royce Alison) and governmental research centers<br />
(NASA) <strong>in</strong>vestigate pressure wave process <strong>in</strong>tensively for<br />
various thermal applications. In [4] a comprehensive review of<br />
past and current research <strong>in</strong> develop<strong>in</strong>g of wave rotor<br />
technology is expla<strong>in</strong>ed <strong>in</strong> more details and <strong>in</strong> a well arranged<br />
way.<br />
In framework of our study the PWS has been <strong>in</strong>vestigated and<br />
analyzed at first us<strong>in</strong>g 1-D diesel eng<strong>in</strong>e simulation. Then by<br />
means of experimental tests at the test bench to f<strong>in</strong>d out<br />
whether the pressure wave supercharg<strong>in</strong>g with regard to<br />
today’s state of art <strong>in</strong> control, actuation, materials and<br />
technology could fulfill requirements on a modern and<br />
perspective car propulsion system and become a serious<br />
competitor to current boost<strong>in</strong>g systems.<br />
1-D SIMULATION OF PWS SUPERCHARGED DIESEL<br />
ENGINE<br />
For the study the Renault 1.5 diesel eng<strong>in</strong>e has been used<br />
for 1-D <strong>in</strong>vestigations to compare PWS supercharged eng<strong>in</strong>e to<br />
the turbocharged one.<br />
Stroke 80.5 mm<br />
Bore 76 mm<br />
Total swept volume 1461 cm3<br />
Number of cyl<strong>in</strong>ders 4<br />
Compression ratio 16:1<br />
Combustion system 2valves/cyl<strong>in</strong>der<br />
Direct <strong>in</strong>jection<br />
Table 1: Diesel eng<strong>in</strong>e parameters<br />
1-D model of PWS used, whose qualitative reaction to changes<br />
<strong>in</strong> design are <strong>in</strong> good agreement with published sources [1],[2]<br />
and with a simple model based on the theory of adiabatic shock<br />
waves and on the l<strong>in</strong>ear gas dynamics pr<strong>in</strong>ciples, has been<br />
created <strong>in</strong> commercial code GT-Power and is <strong>in</strong>troduced and<br />
described <strong>in</strong> detail <strong>in</strong> [37].<br />
Simulation of Full Load of Eng<strong>in</strong>e with PWS<br />
Diagrams <strong>in</strong> Figure 1-Figure 7 po<strong>in</strong>t out comparisons of<br />
PWS supercharged eng<strong>in</strong>es with turbocharged one. PWSs with<br />
unity length-to-diameter ratio of rotor (quadratic design) have<br />
been simulated. The PWS sucks more air <strong>in</strong>to its channeled<br />
rotor than it compresses and delivers to the eng<strong>in</strong>e cyl<strong>in</strong>der<br />
[25]. This fresh air scavenges and cools down the rotor and<br />
2 Copyright © 2007 by ASME
flows direct to the low pressure part of exhaust manifold PWS<br />
downstream. Therefore, the diameter of fresh air pip<strong>in</strong>gs and<br />
diameter of exhaust pip<strong>in</strong>gs PWS downstream have been<br />
enlarged <strong>in</strong> comparison to turbocharged eng<strong>in</strong>e. (In this study<br />
the diameter of particular pip<strong>in</strong>gs equals to 75% of PWS rotor<br />
diameter.)<br />
Air fuel ratio for PWS supercharged eng<strong>in</strong>es has been kept the<br />
same as for turbocharged eng<strong>in</strong>e.<br />
Proper function of PWS depends on the control geometry (i.e.<br />
location of <strong>in</strong>let and outlet orifices at the air and exhaust<br />
flanges of PWS).Two different types of control geometry have<br />
been simulated: control geometry previously optimized by<br />
method of characteristics based on the l<strong>in</strong>ear gas dynamics [37]<br />
and patented geometry from Swissauto Eng<strong>in</strong>eer<strong>in</strong>g S.A. [7]<br />
The PWS speed has been optimized to reach maximum eng<strong>in</strong>e<br />
torque at each operation po<strong>in</strong>t.<br />
Boost pressure behavior is presented <strong>in</strong> Figure 1. The smaller<br />
the PWS the higher boost pressure can be achieved. The<br />
PWS70 (i.e. with rotor diameter and rotor length of 70 mm)<br />
achieves the highest boost pressure. The usage of the control<br />
geometry from Swissauto Company at PWS83 and PWS95<br />
<strong>in</strong>creased the boost pressure significantly.<br />
Boost pressure [bar]<br />
3.2<br />
3<br />
2.8<br />
2.6<br />
2.4<br />
2.2<br />
2<br />
1.8<br />
1.6<br />
1.4<br />
1.2<br />
Boost pressure comparison<br />
PWS83<br />
PWS83_patented_Swissauto_geometry<br />
PWS70<br />
PWS95<br />
Turbo<br />
PWS95_patented_Swissauto_geometry<br />
1<br />
1000 1500 2000 2500 3000 3500 4000 4500<br />
Eng<strong>in</strong>e speed [1/m<strong>in</strong>]<br />
Figure 1: Comparison of PWS and turbocharger boost pressure<br />
In comparison to boost pressure, the eng<strong>in</strong>e torque (Figure 2)<br />
of PWS supercharged eng<strong>in</strong>es falls down at highest eng<strong>in</strong>e<br />
speeds. This is caused by <strong>in</strong>ternal exhaust gas recirculation<br />
(Figure 3) over the channeled rotor of PWS, which deteriorates<br />
the eng<strong>in</strong>e torque. Due to the direct contact of exhaust gas and<br />
fresh air, the exhaust gas can be delivered direct to the eng<strong>in</strong>e<br />
cyl<strong>in</strong>der together with the compressed air. The smaller PWS the<br />
higher <strong>in</strong>ternal exhaust gas recirculation.<br />
Torque [N.m]<br />
260<br />
240<br />
220<br />
200<br />
180<br />
160<br />
Eng<strong>in</strong>e torque comparison<br />
140<br />
PWS83<br />
PWS83_patented_Swissauto_geometry<br />
120<br />
PWS70<br />
PWS95<br />
100<br />
Turbo<br />
80<br />
PWS95_patented_Swissauto_geometry<br />
1000 1500 2000 2500 3000 3500 4000 4500<br />
Eng<strong>in</strong>e speed [1/m<strong>in</strong>]<br />
Figure 2: Comparison of eng<strong>in</strong>e torque<br />
Figure 4 presents the <strong>in</strong>dicated specific fuel consumption. As<br />
the computation model of combustion for PWS supercharged<br />
eng<strong>in</strong>es was the same as <strong>in</strong> case of turbocharged eng<strong>in</strong>e (i.e. it<br />
did not take <strong>in</strong>to account the <strong>in</strong>creased amount of exhaust gas<br />
<strong>in</strong> the eng<strong>in</strong>e cyl<strong>in</strong>der) the differences <strong>in</strong> <strong>in</strong>dicated specific fuel<br />
consumption are given only by pump<strong>in</strong>g work dur<strong>in</strong>g the<br />
cyl<strong>in</strong>der exchange. Figure 4 and Figure 5 demonstrate<br />
favorable behavior of the exhaust back pressure of the PWS<br />
supercharged eng<strong>in</strong>es. Up to the middle eng<strong>in</strong>e speed the boost<br />
pressure is dist<strong>in</strong>ctly higher than the back pressure.<br />
EGR [%]<br />
60<br />
50<br />
40<br />
30<br />
20<br />
10<br />
Exhaust gas recirculation <strong>in</strong>to eng<strong>in</strong>e cyl<strong>in</strong>der<br />
PWS83<br />
PWS83_patented_Swissauto_geometry<br />
PWS70<br />
PWS95<br />
PWS95_patented_Swissauto_geometry<br />
0<br />
1000 1500 2000 2500 3000 3500 4000 4500<br />
Eng<strong>in</strong>e speed [1/m<strong>in</strong>]<br />
Figure 3: Exhaust gas recirculation <strong>in</strong>to eng<strong>in</strong>e cyl<strong>in</strong>der of<br />
PWS eng<strong>in</strong>es<br />
ISFC [g/kW/h]<br />
240<br />
230<br />
220<br />
210<br />
200<br />
190<br />
Idicated specific fuel consumption<br />
PWS83<br />
PWS83_patented_Swissauto_geometry<br />
PWS70<br />
PWS95<br />
Turbo<br />
PWS95_patented_Swissauto_geometry<br />
180<br />
1000 1500 2000 2500 3000 3500 4000 4500<br />
Eng<strong>in</strong>e speed [1/m<strong>in</strong>]<br />
Figure 4: Comparison of <strong>in</strong>dicated specific fuel consumption<br />
3 Copyright © 2007 by ASME
Pressure [bar]<br />
3.4<br />
3.2<br />
3<br />
2.8<br />
2.6<br />
2.4<br />
2.2<br />
2<br />
1.8<br />
1.6<br />
1.4<br />
1.2<br />
Boost pressure and exhaust back pressure<br />
Turbo-boost pressure<br />
PWS95_patented_Swissauto_geometry-boost pressure<br />
Turbo-back pressure<br />
PWS95_patented_Swissauto_geometry-back pressure<br />
1<br />
1000 1500 2000 2500 3000 3500 4000 4500<br />
Eng<strong>in</strong>e speed [1/m<strong>in</strong>]<br />
Figure 5: Boost pressure and back pressure behavior<br />
PWS Speed<br />
Figure 6 shows the PWS speed characteristics. As the time<br />
of pressure wave propagation from exhaust to air side<br />
decreases with the reduction of the PWS size, the smallest<br />
PWS achieves the highest speeds.<br />
Diagrams on Figure 7 present dependences of the eng<strong>in</strong>e toque,<br />
boost pressure, <strong>in</strong>dicated specific fuel consumption and the<br />
exhaust gas recirculation on the PWS speed. Each observed<br />
quantity achieves its optimum at a certa<strong>in</strong> PWS speed. The<br />
<strong>in</strong>crease of the PWS speed contributes to the lower<strong>in</strong>g of the<br />
exhaust gas recirculation.<br />
PWS speed [1/m<strong>in</strong>]<br />
15000<br />
14000<br />
13000<br />
12000<br />
11000<br />
10000<br />
9000<br />
PWS speed optimized for maximum eng<strong>in</strong>e torque<br />
PWS83<br />
PWS70<br />
PWS95<br />
8000<br />
1000 1500 2000 2500 3000 3500 4000 4500<br />
Eng<strong>in</strong>e speed [1/m<strong>in</strong>]<br />
Figure 6: PWS speed characteristics<br />
Influence of PWS speed on eng<strong>in</strong>e parameters<br />
200<br />
1.9<br />
1.8<br />
1.7<br />
1.6<br />
1.5<br />
150<br />
1.4<br />
PWS83-eng<strong>in</strong>e torque<br />
1.3<br />
PWS83-boost pressure<br />
1.2<br />
1.1<br />
100<br />
1<br />
10000 11000 12000 13000 14000 15000 16000<br />
PWS speed [1/m<strong>in</strong>]<br />
Eng<strong>in</strong>e torque [N.m]<br />
Boost pressure [bar]<br />
ISFC [g/kW/h]<br />
230<br />
225<br />
220<br />
215<br />
Influence of PWS speed on eng<strong>in</strong>e parameters<br />
PWS83-ISFC<br />
PWS83-EGR<br />
10000 11000 12000 13000 14000 15000 16000<br />
PWS speed [1/m<strong>in</strong>]<br />
Figure 7: Dependence of eng<strong>in</strong>e parameters on PWS speed for<br />
eng<strong>in</strong>e speed of 1500rpm<br />
Variable Gas Pocket<br />
In order to extend the operat<strong>in</strong>g range of the PWS, so<br />
called pocket <strong>in</strong> the <strong>in</strong>ner face of air and exhaust flanges have<br />
been patented by BBC <strong>in</strong> the 1960’s. Compression pocket,<br />
expansion pocket and gas pocket (Figure 8) by pass the gas<br />
between the channels and the control orifices and thus improve<br />
13<br />
11<br />
9<br />
7<br />
5<br />
3<br />
1<br />
EGR [%]<br />
the operation of the supercharger away from the optimum<br />
(tuned) po<strong>in</strong>t. Moreover, the gas pocket can be used <strong>in</strong> function<br />
of the waste-gate for control of the boost pressure.<br />
Variable Gas Pocket<br />
Exhaust <strong>in</strong>let orifice<br />
Exhaust outlet orifice<br />
Exhaust<br />
Flange<br />
Channel<br />
Low-Pressure<br />
part<br />
Air <strong>in</strong>let orifice<br />
Expansion Pocket<br />
Air outlet orifice<br />
High-Pressure<br />
part<br />
Compression<br />
Pocket<br />
Air Flange<br />
Figure 8: Pressure wave diagram and variable gas pocket <strong>in</strong><br />
function of waste gate<br />
The variable gas pocket bypasses pressurized exhaust gas to the<br />
exhaust outlet via the rotor channel. The bypassed exhaust gas<br />
amplifies the expansion wave <strong>in</strong> the low-pressure part, which<br />
provides better fresh air suction <strong>in</strong>to channeled rotor.<br />
The function and efficiency of the variable gas pocket have<br />
been confirmed by means of the simulation. Simulation results<br />
presented <strong>in</strong> Figure 1-Figure 7 show turbocharger controlled by<br />
the variable turb<strong>in</strong>e geometry, whereas the boost pressure of<br />
PWS has not been controlled.<br />
Diagrams on Figure 9 show results of boost pressure control<br />
for PWS95 with the variable gas pocket at highest eng<strong>in</strong>e<br />
speeds (Figure 9 left). Moreover, utilization of the variable gas<br />
pocket for boost pressure control contributes to the lower<strong>in</strong>g of<br />
the <strong>in</strong>ternal exhaust gas recirculation (Figure 9 right).<br />
Boost pressure [bar]<br />
2.9<br />
2.8<br />
2.7<br />
2.6<br />
2.5<br />
Boost pressure control by variable gas pocket<br />
PWS95 w/o VGP control<br />
PWS with VGP<br />
2.4<br />
3500 3600 3700 3800 3900 4000 4100 4200 4300 4400 4500<br />
Eng<strong>in</strong>e speed [1/m<strong>in</strong>]<br />
Influence of gas pocket control on the <strong>in</strong>ternal gas<br />
recirculation<br />
20<br />
19<br />
18<br />
17<br />
16<br />
PWS95 w/o VGP control<br />
15<br />
14<br />
13<br />
12<br />
PWS with VGP<br />
3500 3600 3700 3800 3900 4000 4100 4200 4300 4400 4500<br />
EGR [%]<br />
Eng<strong>in</strong>e speed [1/m<strong>in</strong>]<br />
Figure 9: Influence of variable gas pocket control (VGP) on<br />
the boost pressure and <strong>in</strong>ternal exhaust gas recirculation<br />
Influence of Flow Losses<br />
Figure 10 describes <strong>in</strong>fluence of flow losses on the PWS<br />
behavior. Flow losses have been <strong>in</strong>creased by chang<strong>in</strong>g <strong>in</strong>let<br />
(Air <strong>in</strong>let orifice upstream -Figure 8) and outlet (Exhaust outlet<br />
orifice downstream -Figure 8) pip<strong>in</strong>gs diameters from 75% to<br />
40% of PWS rotor diameter.<br />
From the 1-D simulation follows that to throttle the air <strong>in</strong>let and<br />
exhaust outlet of PWS deteriorates scaveng<strong>in</strong>g of the PWS<br />
4 Copyright © 2007 by ASME
otor by <strong>in</strong>creas<strong>in</strong>g <strong>in</strong>ternal exhaust gas recirculation, and<br />
consequently lowers eng<strong>in</strong>e torque considerably.<br />
Torque [N.m]<br />
230<br />
210<br />
190<br />
170<br />
150<br />
130<br />
110<br />
90<br />
Eng<strong>in</strong>e torque comparison<br />
70<br />
PWS83_pip<strong>in</strong>gs with diameter of 75% of PWS rotor diameter<br />
50 PWS83_pip<strong>in</strong>gs with diameter of 50% of PWS rotor diameter<br />
30<br />
PWS83_pip<strong>in</strong>gs with diameter of 40% of PWS rotor diameter<br />
1000 1500 2000 2500 3000 3500 4000 4500<br />
Eng<strong>in</strong>e speed [1/m<strong>in</strong>]<br />
Figure 10: Influence of flow losses on the PWS eng<strong>in</strong>e torque<br />
Transient Simulation of Eng<strong>in</strong>e with PWS<br />
To <strong>in</strong>vestigate the transient response of PWS<br />
supercharged eng<strong>in</strong>e the eng<strong>in</strong>e torque vary from the low load<br />
to full load at a constant eng<strong>in</strong>e speed. The load of eng<strong>in</strong>e was<br />
def<strong>in</strong>ed to be equal to the <strong>in</strong>stantaneous eng<strong>in</strong>e torque, which<br />
prevents speed changes. S<strong>in</strong>ce the eng<strong>in</strong>e torque rises dur<strong>in</strong>g<br />
the load step faster than the eng<strong>in</strong>e speed, this test of dynamic<br />
behavior corresponds to the first <strong>in</strong>stant of vehicle acceleration.<br />
Boost pressure [bar]<br />
1.8<br />
1.7<br />
1.6<br />
1.5<br />
1.4<br />
1.3<br />
1.2<br />
1.1<br />
Boost pressure response<br />
PWS83<br />
Turbo<br />
1<br />
1.5 2.0 2.5 3.0 3.5 4.0 4.5 5.0<br />
Time [sec]<br />
Figure 11: Boost pressure response for 1.5 diesel eng<strong>in</strong>e with<br />
PWS83 at eng<strong>in</strong>e speed of 1250 rpm<br />
The PWS boost pressure <strong>in</strong>creases steeper than the<br />
turbocharger one (Figure 11). Dur<strong>in</strong>g the load step an <strong>in</strong>creased<br />
<strong>in</strong>ternal exhaust gas recirculation appears (Figure 13), this is<br />
the reason of the decreas<strong>in</strong>g delay at the middle of the load step<br />
between the PWS supercharged and turbocharged eng<strong>in</strong>e<br />
(Figure 12).<br />
Eng<strong>in</strong>e torque [N.m]<br />
200<br />
180<br />
160<br />
140<br />
120<br />
100<br />
80<br />
60<br />
40<br />
20<br />
Eng<strong>in</strong>e torque response<br />
PWS83<br />
Turbo<br />
0<br />
1.5 2.0 2.5 3.0 3.5 4.0 4.5 5.0<br />
Time [sec]<br />
Figure 12: Torque response for 1.5 diesel eng<strong>in</strong>e with PWS83<br />
at eng<strong>in</strong>e speed of 1250 rpm<br />
EGR [%]<br />
26<br />
21<br />
16<br />
11<br />
6<br />
Internal exhasut gas recirculation dur<strong>in</strong>g transient<br />
PWS83<br />
1<br />
1.5 2.0 2.5 3.0 3.5 4.0<br />
Time [sec]<br />
Figure 13: Internal exhaust gas recirculation <strong>in</strong> transient<br />
operation<br />
Dur<strong>in</strong>g the simulation of spark-ignited eng<strong>in</strong>e, presented <strong>in</strong><br />
[38], more considerable deterioration of eng<strong>in</strong>e torque appeared<br />
than <strong>in</strong> case of 1.5 diesel eng<strong>in</strong>e. Change of PWS speed<br />
(Figure 14 right) dur<strong>in</strong>g the transient operation was an efficient<br />
remedy to improve eng<strong>in</strong>e torque behavior (Figure 14 left) and<br />
to decrease the <strong>in</strong>ternal exhaust gas recirculation <strong>in</strong> transient<br />
operation.<br />
Eng<strong>in</strong>e torque [N.m]<br />
200<br />
150<br />
100<br />
50<br />
0<br />
1.2 SI Eng<strong>in</strong>e torque response<br />
PWS83_constant_speed<br />
Turbo<br />
PWS83_with_speed_control<br />
1 1.5 2 2.5 3 3.5 4 4.5 5<br />
Time [s]<br />
PWS speed [rpm]<br />
PWS speed control dur<strong>in</strong>g the load step<br />
19000<br />
18000<br />
17000<br />
16000<br />
15000<br />
14000<br />
13000<br />
12000<br />
1 1.5 2 2.5 3 3.5 4 4.5 5<br />
Time [s]<br />
Figure 14: Eng<strong>in</strong>e torque and its remedy dur<strong>in</strong>g the load step<br />
of spark ignited 1.2l eng<strong>in</strong>e at eng<strong>in</strong>e speed of 2000rpm from<br />
[38]<br />
EXPERIMENTAL TESTS ON PWS<br />
For the eng<strong>in</strong>e 1-D simulation, presented <strong>in</strong> this paper, a<br />
PWS model has been used, whose physical behavior was<br />
representative enough. From the 1-D eng<strong>in</strong>e simulation a<br />
favorable PWS low end torque behavior and transient response<br />
arise. Moreover, the PWS could be with advantage used for<br />
control of quantity of recycled exhaust gas to combustion<br />
eng<strong>in</strong>e. However, the <strong>in</strong>ternal exhaust gas recirculation, boost<br />
pressure and mass flow value should be checked and settled to<br />
enable the model. Therefore, to keep develop<strong>in</strong>g 1-D model of<br />
supercharg<strong>in</strong>g system with PWS the PWS operat<strong>in</strong>g po<strong>in</strong>ts<br />
have been tested and measured at the combustion chamber test<br />
bench with open circuit (Figure 15). The specimen of tested<br />
PWS was model CX93 used by Mazda Company for<br />
supercharg<strong>in</strong>g of 2.0l diesel eng<strong>in</strong>e [27].<br />
In framework of experimental test<strong>in</strong>g of PWS the mass flow<br />
range at PWS air <strong>in</strong>let (AI), air outlet (AO) and exhaust <strong>in</strong>let<br />
(EI), the PWS speed range and range of the PWS exhaust <strong>in</strong>let<br />
(EI) temperature have been largely explored.<br />
5 Copyright © 2007 by ASME
Electrical motor<br />
Mass flow control<br />
m2<br />
(0 to 200g/s)<br />
p2<br />
T2<br />
(RPMc from 0 to 20000)<br />
p1<br />
m2, C<br />
AO<br />
AI<br />
m1<br />
p1 pressure control (1 to 3b)<br />
Tatm<br />
Noise<br />
Figure 15: Scheme of the test bed<br />
p3 T3<br />
EI<br />
EO<br />
Mass flow control<br />
m3<br />
(0 to 200g/s)<br />
p4<br />
m3, C<br />
Backpressure<br />
floodgate<br />
p4 pressure control (1 to 3 b)<br />
The PWS test bench has been created us<strong>in</strong>g the exist<strong>in</strong>g<br />
turbocharger test bench (equipped with the combustion<br />
chamber and the external source of constant boost air pressure<br />
of 350 kPa and mass flow up to approximately 1000 kg/h) and<br />
its adopt<strong>in</strong>g for PWS tests at Josef Božek Research Center<br />
(JBRC) - Figure 16.<br />
AI<br />
Figure 16: PWS at the combustion chamber test bed<br />
Mass flow and temperature have been enforced at the exhaust<br />
<strong>in</strong>let (EI). EI mass flow was cont<strong>in</strong>uous and has been varied<br />
between 0-200 g/s. Air outlet (AO) and exhaust <strong>in</strong>let (EI) mass<br />
flows have been controlled separately by means of remotely<br />
controlled slide valves enabl<strong>in</strong>g precise tun<strong>in</strong>g of flows. Mass<br />
flow at air outlet (AO) has been controlled at the same value as<br />
that of exhaust <strong>in</strong>let (EI). The temperature has been scanned<br />
from 800K to 1050K at exhaust <strong>in</strong>let.<br />
Measur<strong>in</strong>g of EI and AO mass flows has been performed us<strong>in</strong>g<br />
meter<strong>in</strong>g orifices <strong>in</strong> pipel<strong>in</strong>es. AI mass flow has been measured<br />
us<strong>in</strong>g <strong>in</strong>take nozzle.<br />
EI<br />
AO<br />
EO<br />
All temperature measurements have been carried out by<br />
electrically isolated thermocouples. The most problematic<br />
temperature measurement was the temperature T3 at EI after the<br />
combustion chamber. Therefore, five thermocouples have been<br />
utilized to obta<strong>in</strong> the temperature distribution with<strong>in</strong> the<br />
manifold.<br />
To estimate the <strong>in</strong>ternal exhaust gas recirculation of PWS molar<br />
fractions of CO2 at EI and AO have been measured by means of<br />
exhaust gas analyzer.<br />
The PWS has been driven directly by electrical motor, whose<br />
speed has been controlled by frequency converter and could<br />
vary between 0-20000 rpm. The PWS speed has been measured<br />
us<strong>in</strong>g optical sensor. As the PWS had to be braked <strong>in</strong> specific<br />
operation regimes, the brake resistors had to be additionally<br />
connected to the frequency converter.<br />
In framework of this project a new automated data acquisition<br />
system has been developed under the Testpo<strong>in</strong>t development<br />
environment, which enabled to display all <strong>in</strong>stant measured<br />
values and control panel with diagrams show<strong>in</strong>g their trends<br />
(Figure 17).<br />
DAQ Control Panel<br />
with time history<br />
diagram for settl<strong>in</strong>g<br />
identification<br />
Gas analyzer<br />
display<br />
Figure 17: Displays of measured values and DAQ software<br />
control panel with time history diagrams.<br />
Performance maps of measured PWS<br />
Diagrams on Figure 18-Figure 23 show performance maps for<br />
exhaust <strong>in</strong>let temperature of 900K. The total PWS efficiency,<br />
AO temperature, <strong>in</strong>ternal exhaust gas recirculation, air <strong>in</strong>let<br />
mass flow and electrical <strong>in</strong>put to PWS are depicted legible <strong>in</strong><br />
form commonly used for turbochargers, so these maps can be<br />
with advantage used for direct comparison to turbochargers<br />
maps.<br />
From the flow characteristics diagram on Figure 18 the<br />
<strong>in</strong>fluence of PWS speed on boost pressure ratio is clearly<br />
visible. For PWS speed from 14000 rpm to 18000 rpm the<br />
highest PWS total efficiencies are achieved (Figure 19).<br />
Lower<strong>in</strong>g of the PWS speed decreases the PWS efficiency and<br />
<strong>in</strong>creases the boost pressure (Figure 18). From a certa<strong>in</strong> mass<br />
flow, here for mass flow higher than 550kg/h, the PWS boost<br />
pressure ratio falls abruptly down.<br />
6 Copyright © 2007 by ASME
Figure 18: PWS performance map of PWS speed for EI<br />
temperature of 900K<br />
Internal exhaust gas recirculation over the channeled rotor is<br />
presented <strong>in</strong> Figure 20. In the PWS speed range from<br />
10000rpm to 20000rpm no recirculation appears up to the mass<br />
flow of 400kg/h.<br />
The AO temperatures traces are shown <strong>in</strong> Figure 21. Up to the<br />
PWS speed of 16000 rpm the <strong>in</strong>crease of PWS speed decreases<br />
the AO temperature. AO temperature starts to rise significantly<br />
bellow the PWS speed of 10000 rpm.<br />
The PWS sucks <strong>in</strong> AI much more fresh air than it delivers to<br />
the air outlet. Amount of sucked fresh air <strong>in</strong>creases with the<br />
<strong>in</strong>crease of the AO mass flow (Figure 22) whereas for the EI<br />
mass flows from 400 to 650 kg/h there is no considerable<br />
difference between the sucked amounts of fresh air <strong>in</strong>to PWS.<br />
The diagram on Figure 23 presents power <strong>in</strong>put to the electrical<br />
motor, which drives the PWS. The negative sign of the power<br />
<strong>in</strong>put means that the PWS drives the el. motor.<br />
Figure 19: PWS performance map of PWS total efficiency for<br />
EI temperature of 900K<br />
Figure 20: PWS performance map of <strong>in</strong>ternal exhaust gas<br />
recirculation for EI temperature of 900K<br />
Figure 21: PWS performance map of air outlet (AO)<br />
temperature for EI temperature of 900K<br />
Figure 22: PWS performance map for air <strong>in</strong>let mass flow for<br />
EI temperature of 900K<br />
7 Copyright © 2007 by ASME
Figure 23: PWS performance map for electrical power<br />
<strong>in</strong>put/output of PWS for temperature of 900K<br />
Influence of the temperature at PWS exhaust <strong>in</strong>let<br />
Diagrams <strong>in</strong> Figure 24-Figure 27 present <strong>in</strong>fluence of the<br />
EI temperature for four different levels of EI pressure p3 (1.5,<br />
2, 2.5 and 3 bar - absolute). The PWS operation po<strong>in</strong>ts have<br />
been measured for EI temperature of 800K, 900K and 1050K.<br />
The <strong>in</strong>crease of the EI temperature <strong>in</strong>creases the boost pressure.<br />
The highest EI temperature of 1050K extended the range where<br />
the boost pressure is higher than the back pressure p3 (Figure<br />
24).<br />
p2 [kPa]<br />
200<br />
150<br />
100<br />
50<br />
Relative pressures<br />
0<br />
0 5000 10000 15000 20000 25000<br />
PWS speed [rpm]<br />
p3=50kPa T3=800K p3=100kPa T3=800K p3=150kPa T3=800K p3=200kPa T3=800K<br />
p3=50kPa T3=900K p3=100kPa T3=900K p3=150kPa T3=900K p3=200kPa T3=900K<br />
p3=50kPa T3=1050K p3=100kPa T3=1050K p3=150kPa T3=1050K p3=200kPa T3=1050K<br />
Figure 24: Boost pressure <strong>in</strong> dependence on the EI temperature<br />
m3 [kg/h]<br />
700<br />
600<br />
500<br />
400<br />
300<br />
200<br />
100<br />
0<br />
0 5000 10000 15000 20000 25000<br />
PWS speed [rpm]<br />
p3=50kPa T3=800K p3=100kPa T3=800K p3=150kPa T3=800K p3=200kPa T3=800K<br />
p3=50kPa T3=900K p3=100kPa T3=900K p3=150kPa T3=900K p3=200kPa T3=900K<br />
p3=50kPa T3=1050K p3=100kPa T3=1050K p3=150kPa T3=1050K p3=200kPa T3=1050K<br />
Figure 25: EI mass flow <strong>in</strong> dependence on the EI temperature<br />
A lower EI mass flow is necessary with EI temperature <strong>in</strong>crease<br />
to achieve the same EI pressure (Figure 25). The <strong>in</strong>crease <strong>in</strong> EI<br />
temperature decreases the <strong>in</strong>ternal exhaust gas recirculation<br />
(Figure 26) and deteriorates the PWS efficiency (Figure 27).<br />
egr [1]<br />
0.5<br />
0.4<br />
0.3<br />
0.2<br />
0.1<br />
0<br />
0 5000 10000 15000 20000 25000<br />
PWS speed [rpm]<br />
p3=50kPa T3=800K p3=100kPa T3=800K p3=150kPa T3=800K p3=200kPa T3=800K<br />
p3=50kPa T3=900K p3=100kPa T3=900K p3=150kPa T3=900K p3=200kPa T3=900K<br />
p3=50kPa T3=1050K p3=100kPa T3=1050K p3=150kPa T3=1050K p3=200kPa T3=1050K<br />
Figure 26: Internal exhaust gas recirculation <strong>in</strong> dependence on<br />
EI temperature<br />
etaPWS [1]<br />
0.5<br />
0.4<br />
0.3<br />
0.2<br />
0 5000 10000 15000 20000 25000<br />
PWS speed [rpm]<br />
p3=100kPa T3=800K p3=100kPa T3=900K p3=100kPa T3=1050K<br />
Figure 27: Total efficiency of PWS <strong>in</strong> dependence on EI<br />
temperature<br />
Influence of Flow Losses <strong>in</strong> Air Inlet<br />
The <strong>in</strong>fluence of the flow losses <strong>in</strong> AI has been<br />
<strong>in</strong>vestigated at EI temperature of 900K and PWS speed of<br />
15000 rpm for two orifice plates with diameters of 35 mm and<br />
50 mm (orig<strong>in</strong> AI manifold diameter of 100 mm).<br />
The orifice with diameter 35 mm deteriorates the boost<br />
pressure significantly above the mass flow of 400 kg/h. The<br />
throttl<strong>in</strong>g of the AI mass flow <strong>in</strong>creases the AO and EO<br />
temperatures and the <strong>in</strong>ternal exhaust gas recirculation. On the<br />
other hand, the reduction of the AI mass flow improves the<br />
PWS efficiency at low EI mass flow rates (Figure 29 left).<br />
All diagrams described <strong>in</strong> above paragraphs have been<br />
measured without boost pressure control us<strong>in</strong>g waste gate<br />
(WG). Diagrams <strong>in</strong> Figure 28 and Figure 29 show <strong>in</strong>fluence of<br />
waste gate control on PWS operation, as well. The waste gate<br />
trims the boost pressure and tries to keep it approx. constant<br />
(Figure 28 left). The waste gate does not <strong>in</strong>fluence the <strong>in</strong>ternal<br />
exhaust gas recirculation (Figure 29 right).<br />
8 Copyright © 2007 by ASME
πC [1]<br />
2.60<br />
2.40<br />
2.20<br />
2.00<br />
1.80<br />
1.60<br />
1.40<br />
1.20<br />
1.00<br />
dia 35 mm<br />
dia 50 mm<br />
WG<br />
w / o Loss<br />
0 100 200 300 400 500 600 700<br />
m 2red [kg/h]<br />
p1 [kPa]<br />
9<br />
8<br />
7<br />
6<br />
5<br />
4<br />
dia 35 mm<br />
3<br />
2<br />
1<br />
dia 50 mm<br />
0 100 200 300 400<br />
m3 [kg/h]<br />
500 600 700<br />
Figure 28: Influence of pressure losses (right) and waste gate<br />
on pressure ratio <strong>in</strong> dependence on reduced AO mass flow<br />
etaPWS [1]<br />
0.50<br />
0.45<br />
0.40<br />
0.35<br />
0.30<br />
0.25<br />
0.20<br />
dia 35 mm<br />
0.15<br />
dia 50 mm<br />
0.10<br />
0.05<br />
0.00<br />
WG<br />
w / o Loss<br />
0 100 200 300 400 500 600 700<br />
m2, m3 [kg/h]<br />
egr [1]<br />
0.35<br />
0.30<br />
0.25<br />
0.20<br />
0.15<br />
0.10<br />
0.05<br />
0.00<br />
dia 35 mm<br />
dia 50 mm<br />
WG<br />
w / o Loss<br />
0 100 200 300 400 500 600 700<br />
m2, m3 [kg/h]<br />
Figure 29: Influence of pressure losses <strong>in</strong> AI manifold on PWS<br />
efficiency and <strong>in</strong>ternal egr<br />
Influence of Flow Losses <strong>in</strong> Exhaust Outlet<br />
The EO pressure has been <strong>in</strong>creased us<strong>in</strong>g throttle which has<br />
been controlled by stepper electric motor. A snail gear box has<br />
been placed between the throttle and the electrical motor to<br />
prevent throttle flapp<strong>in</strong>g by EO flow.<br />
PWS<br />
EO<br />
Flow losses<br />
Figure 30: EO throttle controlled by stepper electrical motor<br />
with snail box<br />
Diagrams <strong>in</strong> Figure 31 and Figure 32 present the sensitivity of<br />
the PWS on the EO pressure for EI mass flows of (100,300,400<br />
and 500) kg/h and for EI temperature of 900K. The PWS speed<br />
has been kept at 15 000rpm. The change <strong>in</strong> EO pressure by<br />
2kPa deteriorates the boost pressure significantly (Figure 31).<br />
The <strong>in</strong>creased EO pressure lowers the amount of sucked AI<br />
mass flow and <strong>in</strong>creases the <strong>in</strong>ternal exhaust gas recirculation<br />
rises (Figure 32).<br />
Moreover, <strong>in</strong>creased EO pressure may cause the back flow of<br />
the exhaust gas to the AI.<br />
Relative pressure p2 [kPa]<br />
140<br />
120<br />
100<br />
80<br />
60<br />
40<br />
20<br />
100kg/h 300kg/h 400kg/h 500kg/h<br />
0<br />
95.5 96 96.5 97 97.5 98 98.5 99 99.5<br />
Absolute pressure p4 [kPa]<br />
Figure 31: Influence of the EO pressure on the boost pressure<br />
egr [1]<br />
0.45<br />
0.4<br />
0.35<br />
0.3<br />
0.25<br />
0.2<br />
0.15<br />
0.1<br />
0.05<br />
100kg/h 300kg/h 400kg/h 500kg/h<br />
0<br />
95.5 96 96.5 97 97.5 98 98.5 99 99.5<br />
Absolute pressure p4 [kPa]<br />
Figure 32: Influence of the EO pressure on the AI mass flow<br />
Supercharg<strong>in</strong>g of the PWS<br />
In framework of the measurement the feasibility of the<br />
PWS for the two stage supercharg<strong>in</strong>g has been <strong>in</strong>vestigated.<br />
To enable pressure <strong>in</strong>crease <strong>in</strong> AI the test bench has been<br />
equipped with <strong>in</strong>let pipel<strong>in</strong>e of pressurized air (Figure 33).<br />
External source could deliver constant boost air pressure of<br />
350kPa and mass flow approx. of 1000kg/h <strong>in</strong>to AI. AI mass<br />
flow has been controlled us<strong>in</strong>g slide valve, which has been<br />
actuated by an electric stepper motor. Moreover, meter<strong>in</strong>g<br />
orifice has been placed <strong>in</strong>to the AI pipel<strong>in</strong>e.<br />
The measurement has been performed for EI mass flow of 300<br />
kg/h and for two different PWS speeds of 15000 rpm (Figure<br />
34) and 10000 rpm (Figure 35). As <strong>in</strong> the all previous<br />
paragraphs the mass flow at air outlet (AO) has been controlled<br />
at the same value as that of exhaust <strong>in</strong>let (EI). The EI<br />
temperature has been kept at 900K. For the fully opened EO<br />
throttle (Figure 30) the air <strong>in</strong>let mass flow has been set to be<br />
the same as the naturally aspirated mass flow for this PWS<br />
operation po<strong>in</strong>t. By adjust<strong>in</strong>g of the EO throttle the EO and AI<br />
pressures have been <strong>in</strong>creased.<br />
9 Copyright © 2007 by ASME
Figure 33: Supercharg<strong>in</strong>g of PWS<br />
The boost pressure and EI pressure rise with the AI pressure<br />
<strong>in</strong>crease both for 10000 rpm and 15000rpm (Figure 34 and<br />
Figure 35 left).The boost pressure <strong>in</strong>creases by the same value<br />
as that set at AI.<br />
The AI mass flow did not change with the AI pressure <strong>in</strong>crease<br />
(Figure 34 and Figure 35 right). No <strong>in</strong>ternal exhaust gas<br />
recirculation appeared at both cases.<br />
180<br />
160<br />
140<br />
120<br />
100<br />
80<br />
60<br />
40<br />
20<br />
0<br />
Relative pressures [kPa]<br />
PWS Supercharg<strong>in</strong>g<br />
15 000 rpm, m2=m3=300 kg/h, T3=900K<br />
p2_300<br />
p3_300<br />
p4_300<br />
0 10 20 30 40 50 60 70<br />
Relative pressure p1 [kPa]<br />
m1, m2, m3 [kg/h]<br />
580<br />
530<br />
480<br />
430<br />
380<br />
330<br />
280<br />
230<br />
180<br />
Mass flows<br />
m1<br />
m2<br />
m3<br />
0 10 20 30 40 50 60 70<br />
Relative pressure p1 [kPa]<br />
Figure 34: Influence of AI pressure on AO, EI and EO<br />
pressures and on AI mass flow for PWS speed of 15000 rpm<br />
Relative pressures [kPa]<br />
250<br />
200<br />
150<br />
100<br />
50<br />
0<br />
Pipel<strong>in</strong>e of pressurized<br />
air to PWS air <strong>in</strong>let<br />
PWS Supercharg<strong>in</strong>g<br />
10 000 rpm, m2=m3=300 kg/h, T3=900K<br />
p2_300<br />
p3_300<br />
p4_300<br />
0 20 40 60 80 100 120<br />
Relative pressure p1 [kPa]<br />
m1, m2, m3 [kg/h]<br />
580<br />
530<br />
480<br />
430<br />
380<br />
330<br />
280<br />
230<br />
180<br />
Mass flows<br />
m1<br />
m2<br />
m3<br />
0 20 40 60 80 100 120<br />
Relative pressure p1 [kPa]<br />
Figure 35: Influence of AI pressure on AO, EI and EO<br />
pressures and on AI mass flow for PWS speed of 10000 rpm<br />
COMPARISON OF 1-D MODEL SIMULATION TO<br />
MEASUREMENT<br />
To compare the simulation results to measurements a 1-D<br />
model of the tested PWS at the test bench has been developped<br />
<strong>in</strong> GT-Power, whereas the PWS without pockets has been<br />
simulated. Analogous to experiment the mass flow at air outlet<br />
(AO <strong>in</strong> Figure 15) has been controlled at the same value as that<br />
of exhaust <strong>in</strong>let (EI).<br />
Diagrams on Figure 36 and Figure 37 present comparison of<br />
boost pressure p2, back pressure p3, air <strong>in</strong>let mass flow and<br />
<strong>in</strong>ternal exhaust gas recirculation for constant exhaust <strong>in</strong>let<br />
mass flow of 300kg/h. (In Annex A the same comparison is<br />
shown for EI mass flows of 100kg/h, 400kg/h and 500kg/h.)<br />
The 1-D model predicts maximal boost pressure higher than the<br />
measured one (Figure 36). The simulated difference between<br />
boost pressure and back pressure is higher and <strong>in</strong> larger PWS<br />
speed range than measured one. 1-D PWS model recirculates<br />
more exhaust gas than the real PWS (Figure 37 right).<br />
Boost and back pressure comparison<br />
2.50<br />
2.40<br />
2.30<br />
2.20<br />
2.10<br />
2.00<br />
1.90<br />
1.80<br />
1.70<br />
1.60<br />
1.50<br />
1.40<br />
1.30<br />
1.20<br />
1.10<br />
1.00<br />
0 5000 10000 15000 20000<br />
PWS speed [rpm]<br />
p2-300kg/h-measured p3-300kg/h measured<br />
p2-300kg/h 1-D model without pockets p3-300kg/h 1-D model without pockets<br />
Absolute pressure [bar]<br />
Figure 36: Comparison of measured and computed pressures<br />
for EI mass flow of 300kg/h<br />
Mass flow comparison<br />
160<br />
140<br />
120<br />
100<br />
80<br />
60<br />
40<br />
20<br />
0<br />
0 5000 10000 15000 20000<br />
PWS speed [rpm]<br />
m1-300kg/h-measured m1-300kg/h 1-D model without pockets<br />
m2-300kg/h 1-D model without pockets m3-300kg/h 1-D model without pockets<br />
Mass flow [g/sec]<br />
EGR [1]<br />
Internal exhaust gas recirculation<br />
0.4<br />
0.35<br />
0.3<br />
0.25<br />
0.2<br />
0.15<br />
0.1<br />
0.05<br />
0<br />
0 5000 10000 15000 20000<br />
PWS speed [rpm]<br />
egr-300kg/h-measured egr-300kg/h 1-D model without pockets<br />
Figure 37: Comparison of measured and computed AI mass<br />
flow and <strong>in</strong>ternal exhaust gas recirculation for EI mass flow of<br />
300kg/h<br />
Diagrams on Figure 38 - Figure 41 compare 1-D simulation<br />
results for three different EI temperatures (800K, 900K and<br />
1050K) and for constant EI pressure of 2 barAbsolute. The<br />
qualitative reaction of the 1-D model on EI temperature change<br />
is <strong>in</strong> a good agreement with the measurement for every<br />
observed quantity. The boost pressure <strong>in</strong>creases with the EI<br />
temperature. The maximal simulated boost pressure is for every<br />
temperature higher than the EI pressure (Figure 38). An<br />
<strong>in</strong>crease of EI temperature <strong>in</strong>creases the amount of fresh air<br />
which is sucked <strong>in</strong>to the PWS (Figure 40) and decreases the<br />
<strong>in</strong>ternal exhaust gas recirculation (Figure 41).<br />
p2 [bar]<br />
2.40<br />
2.30<br />
2.20<br />
2.10<br />
2.00<br />
1.90<br />
1.80<br />
1.70<br />
1.60<br />
1.50<br />
Absolute boost pressure<br />
for absolute back pressure of p3=2bar<br />
0 5000 10000<br />
PWS speed [rpm]<br />
15000 20000<br />
p3=2bar T3=800K measured p3=2bar T3=900K measured<br />
p3=2bar T3=1050K measured p3=2bar T3=800K 1-D model w/o pockets<br />
p3=2bar T3=900K 1-D model w/o pockets p3=2bar T3=1050K 1-D model w/o pockets<br />
Figure 38: Comparison of measured and computed boost<br />
pressures for tree different EI temperatures and constant EI<br />
absolute pressure of 2bar<br />
10 Copyright © 2007 by ASME
m2 [g/s]<br />
110<br />
100<br />
90<br />
80<br />
70<br />
60<br />
50<br />
40<br />
30<br />
20<br />
10<br />
0<br />
Air outlet mass flow<br />
for absolute back pressure of p3=2bar<br />
p3=2bar T3=800K measured<br />
p3=2bar T3=900K measured<br />
p3=2bar T3=1050K measured<br />
p3=2bar T3=800K 1D model w/o pockets<br />
p3=2bar T3=900K 1D model w/o pockets<br />
p3=2bar T3=1050K 1D model w/o pockets<br />
0 5000 10000<br />
PWS speed [rpm]<br />
15000 20000<br />
Figure 39: Comparison of measured and computed air outlet<br />
mass flows for tree different EI temperatures and constant EI<br />
pressure of 2bar<br />
m1 [g/s]<br />
160<br />
140<br />
120<br />
100<br />
80<br />
Air <strong>in</strong>let mass flow<br />
for absolute back pressure of p3=2bar<br />
60<br />
0 5000 10000<br />
PWS speed [rpm]<br />
15000 20000<br />
p3=2bar T3=800K measured p3=2bar T3=900K measured<br />
p3=2bar T3=1050K measured p3=2bar T3=800K 1D model w/o pockets<br />
p3=2bar T3=900K 1D model w/o pockets p3=2bar T3=1050K 1D model w/o pocktes<br />
Figure 40: Comparison of measured and computed air <strong>in</strong>let<br />
mass flows for tree different EI temperatures and constant EI<br />
absolute pressure of 2bar<br />
EGR [%]<br />
0.30<br />
0.20<br />
0.10<br />
Internal exhaust gas recirculation<br />
for absolute back pressure of p3=2bar<br />
0.00<br />
0 5000 10000<br />
PWS speed [rpm]<br />
15000 20000<br />
p3=2bar T3=800K measured p3=2bar T3=900K measured<br />
p3=2bar T3=1050K measured p3=2bar T3=800K 1D model w/o pockets<br />
p3=2bar T3=900K 1D model w/o pockets p3=2bar T3=1050K 1D model w/o pockets<br />
Figure 41: Comparison of measured and computed <strong>in</strong>ternal<br />
exhaust gas recirculations for tree different EI temperatures and<br />
constant EI absolute pressure of 2bar<br />
PWS model with all pockets has been simulated, as well (see<br />
diagrams on Figure 42 and Figure 43). Pockets extended the<br />
work<strong>in</strong>g range of the PWS model. Nevertheless, the modeled<br />
pockets <strong>in</strong>creased the boost pressure <strong>in</strong> low PWS speed too<br />
much <strong>in</strong> comparison to measurement.<br />
Absolute pressure [bar]<br />
3.5<br />
3<br />
2.5<br />
2<br />
1.5<br />
1<br />
Absolute pressure comparison<br />
0 2000 4000 6000 8000 10000 12000 14000 16000 18000 20000<br />
PWS speed [rpm]<br />
p3-300kg/h with pockets p2-300kg/h with pockets<br />
p2-300kg/h-measured p3-300kg/h-measured<br />
p2-300kg/h without pockets p3-300kg/h without pockets<br />
Figure 42: Comparison of measured and computed pressures<br />
for EI mass flow of 300kg/h and 1-D PWS model with pockets<br />
Mass flow [g/sec]<br />
Mass flow comparison<br />
160<br />
140<br />
120<br />
100<br />
80<br />
60<br />
40<br />
m3-300kg/h with pockets m2-300kg/h with pockets<br />
20<br />
0<br />
m1-300kg/h with pockets<br />
m1-300kg/h without pockets<br />
m1-300kg/h-measured<br />
0 5000 10000<br />
PWS speed [rpm]<br />
15000 20000<br />
EGR [1]<br />
EGR comparison<br />
1<br />
0.9<br />
egr-300kg/h with pockets egr-300kg/h-measured<br />
0.8<br />
0.7<br />
0.6<br />
0.5<br />
0.4<br />
0.3<br />
0.2<br />
0.1<br />
0<br />
egr-300kg/h without pockets<br />
0 2000 4000 6000 8000 10000 12000 14000 16000 18000 20000<br />
PWS speed [rpm]<br />
Figure 43: Comparison of measured and computed AI mass<br />
flow and <strong>in</strong>ternal exhaust gas recirculation for EI mass flow of<br />
300kg/h and 1-D PWS model with pockets<br />
Presented and described comparisons <strong>in</strong> diagrams above<br />
<strong>in</strong>dicate that the flow losses <strong>in</strong> the 1-D model of PWS rotor<br />
channel should be tuned with regard to pressure traces to come<br />
closer to the measurement. Follow<strong>in</strong>g paragraph discusses the<br />
problematic of <strong>in</strong>creased simulated exhaust gas recirculation <strong>in</strong><br />
comparison to measurement.<br />
In the channel of the PWS rotor the fresh air and exhaust gas<br />
are <strong>in</strong> direct contact. GT-Power is based on the f<strong>in</strong>ite volume<br />
method. Thus, the 1-D model is discretized <strong>in</strong>to many volumes<br />
and the solution is carried out by time <strong>in</strong>tegration of equations<br />
of cont<strong>in</strong>uity, energy and momentum. F<strong>in</strong>er discretization<br />
results <strong>in</strong> better accuracy and extends the computation time<br />
vice versa.<br />
Diagrams <strong>in</strong> Figure 44 and Figure 45 show <strong>in</strong>fluence of the<br />
discretization length on the simulated results. The <strong>in</strong>fluence has<br />
been <strong>in</strong>vestigated for constant mass flow of 300kg/h and EI<br />
temperature of 900K. By lower<strong>in</strong>g of the dicretization length<br />
by one third of the orig<strong>in</strong>al length (here to 5mm) the <strong>in</strong>ternal<br />
exhaust gas recirculation decreased by 10% (Figure 45) and the<br />
simulated boost pressure <strong>in</strong>creased by 5%. At the same time the<br />
computation time has been 1.8 times longer than the orig<strong>in</strong>al<br />
one.<br />
11 Copyright © 2007 by ASME
2.50<br />
2.40<br />
2.30<br />
2.20<br />
2.10<br />
2.00<br />
1.90<br />
1.80<br />
1.70<br />
1.60<br />
1.50<br />
1.40<br />
1.30<br />
1.20<br />
1.10<br />
1.00<br />
Absolute pressure [bar]<br />
Absolute pressure comparison<br />
p2-300kg/h-measured<br />
p3-300kg/h measured<br />
p2-300kg/h 1-D model without pockets<br />
p3-300kg/h 1-D model without pockets<br />
p2-300kg/h 1-D model without pockets with dx=5mm<br />
p3-300kg/h 1-D model without pockets with dx=5mm<br />
0 5000 10000 15000 20000<br />
PWS speed [rpm]<br />
Figure 44: Influence of discretization length of PWS rotor<br />
channel on pressure traces<br />
Mass flow [g/sec]<br />
Mass flow comparison<br />
160<br />
140<br />
120<br />
100<br />
80<br />
60<br />
m1-300kg/h-measured<br />
40<br />
m1-300kg/h 1-D model without pockets<br />
m2-300kg/h 1-D model without pockets<br />
20<br />
m3-300kg/h 1-D model without pockets<br />
0<br />
m1-300kg/h 1-D model without pockets with dx=5mm<br />
0 5000 10000<br />
PWS speed [rpm]<br />
15000 20000<br />
0.5<br />
0.45<br />
0.4<br />
0.35<br />
0.3<br />
0.25<br />
0.2<br />
0.15<br />
0.1<br />
0.05<br />
0<br />
EGR [1]<br />
EGR comparison<br />
egr-300kg/h-measured<br />
egr-300kg/h 1-D model without pockets<br />
egr-300kg/h 1-D model without pockets with dx=5mm<br />
5000 7000 9000 11000 13000 15000 17000 19000<br />
PWS speed [rpm]<br />
Figure 45: Influence of discretization length of PWS rotor<br />
channel on computed mass flow and <strong>in</strong>ternal exhaust gas<br />
recirculation<br />
PWS IN FUEL CELL APPLICATIONS<br />
Fuel cells are among the most promis<strong>in</strong>g alternative<br />
energy sources of the future with regard to clean and efficient<br />
power generation [33]. Hydrogen reacts with oxygen produc<strong>in</strong>g<br />
water, electric current and heat. Runn<strong>in</strong>g of the fuel cell at<br />
higher pressure <strong>in</strong>creases the power due to the polarization<br />
curve improvement [32], [35] and reduces the cell dimensions.<br />
Therefore, the fuel cells of 10kW or more utilize boost<strong>in</strong>g<br />
device for air compression to <strong>in</strong>crease oxygen partial pressure<br />
[32]. As the flow through the fuel cell can be described as the<br />
flow through a throttle the boost pressure has to be higher than<br />
the back pressure. The proton exchange membrane (PEM) fuel<br />
cell, the most preferred fuel cell type for automotive systems,<br />
must have sufficient water content <strong>in</strong> the polymer electrolyte<br />
and the humidity of the air must be carefully controlled [32].<br />
From the combustion chamber measurement of the tested PWS<br />
model CX93 follows (Figure 24) that its boost pressure is<br />
higher than the back pressure for EI temperature higher than<br />
900K. This makes a burner PWS upstream necessary to have<br />
enough energy for air compression. Due to the direct contact of<br />
air and vapor <strong>in</strong> the rotor channel, the PWS could be of<br />
advantage if used for air humidification realized by throttl<strong>in</strong>g at<br />
AI of PWS (Figure 29).<br />
Us<strong>in</strong>g the 1-D simulation the PWS93 with <strong>in</strong> [7] patented<br />
geometry, which provided significantly <strong>in</strong>creased boost<br />
pressure (Figure 1), has been computed at the test bench for<br />
back pressure of 2barAbsolute and EI temperatures of 150°C and<br />
500°C. From the diagrams (Figure 46 and Figure 47) is visible<br />
that at the lower temperature of 150°C the PWS is unsuitable<br />
for full cell applications. At the temperature of 500°C the boost<br />
pressure surpass the back pressure. Another way of us<strong>in</strong>g PWS<br />
for this purpose would be a comb<strong>in</strong>ation with serial connected,<br />
electric driven, compressor, which is necessary as a starter <strong>in</strong><br />
any case.<br />
Absolute boost pressure for absolute back pressure<br />
of 2bar<br />
2.2<br />
2.1<br />
2<br />
1.9<br />
1.8<br />
1.7<br />
1.6<br />
1.5<br />
1.4<br />
1.3<br />
1.2<br />
1.1<br />
1<br />
6000 6500 7000 7500 8000<br />
PWS speed [rpm]<br />
8500 9000 9500 10000<br />
Absolute pressure p2 [bar]<br />
p3=2bar T3=150degC 1-D model without pockets<br />
p3=2bar T3=500degC 1-D model without pockets<br />
Figure 46: Computed boost pressure for back pressure of 2bar<br />
and two different temperatures<br />
Air outlet mass flow for absolute back pressure of<br />
2bar<br />
131<br />
121<br />
111<br />
101<br />
91<br />
81<br />
71<br />
61<br />
51<br />
41<br />
31<br />
21<br />
11<br />
1<br />
6000 6500 7000 7500 8000<br />
PWS speed [rpm]<br />
8500 9000 9500 10000<br />
AO mass flow m2 [g/sec]<br />
p3=2bar T3=150degC 1-D model without pockets<br />
p3=2bar T3=500degC 1-D model without pockets<br />
Figure 47: Computed air outlet mass flow for back pressure of<br />
2bar and two different temperatures<br />
CONCLUSIONS<br />
In framework of the study presented <strong>in</strong> this paper the<br />
pressure wave supercharger (PWS) has been <strong>in</strong>vestigated us<strong>in</strong>g<br />
1-D eng<strong>in</strong>e simulation and experimental measurement at the<br />
combustion chamber test bench.<br />
1-D simulation of different PWS sizes contributed to<br />
understand<strong>in</strong>g of PWS behavior <strong>in</strong> eng<strong>in</strong>e application. The<br />
PWS has higher boost pressure at low eng<strong>in</strong>e speeds than the<br />
turbocharger. Us<strong>in</strong>g the variable transmission ratio between the<br />
PWS and the eng<strong>in</strong>e the boost pressure can be hold on high<br />
level over the whole eng<strong>in</strong>e speed range. Whereas the eng<strong>in</strong>e<br />
speed <strong>in</strong>creases the scaveng<strong>in</strong>g of the PWS rotor decreases. At<br />
the highest eng<strong>in</strong>e speeds the <strong>in</strong>ternal exhaust gas recirculation<br />
rises and deteriorates the eng<strong>in</strong>e power. The variable gas pocket<br />
improves the rotor scaveng<strong>in</strong>g and can be with advantage used<br />
for boost pressure control. Dur<strong>in</strong>g the transient operation the<br />
<strong>in</strong>creased <strong>in</strong>ternal exhaust gas recirculation appeared. Change<br />
of PWS speed dur<strong>in</strong>g the load step improved transient<br />
behavior.<br />
The PWS has been largely explored at the combustion chamber<br />
test bench and performance maps of measured PWS created.<br />
The measurement showed high sensitivity of PWS on flow<br />
losses ma<strong>in</strong>ly <strong>in</strong> exhaust outlet. Pressure <strong>in</strong>crease <strong>in</strong> air <strong>in</strong>let of<br />
PWS <strong>in</strong>creases the boost pressure by the same pressure.<br />
12 Copyright © 2007 by ASME
The 1-D model of PWS at the test bench has been created to<br />
compare simulation to experiment. The established database of<br />
measured data creates very good basis for further 1-D model<br />
calibration. The qualitative reaction of PWS model is <strong>in</strong> a very<br />
good agreement with the measurement. The 1-D model predicts<br />
higher difference between boost pressure and back pressure and<br />
<strong>in</strong> larger PWS speed range than measurements. In next steps<br />
ma<strong>in</strong>ly the flow losses <strong>in</strong> the model should be tuned to calibrate<br />
the model.<br />
Utilization of the PWS <strong>in</strong> the fuel cell application makes a<br />
burner PWS upstream necessary. 1-D model and measured<br />
database could be with advantage used for further<br />
<strong>in</strong>vestigations on this topic.<br />
NOMENCLATURE<br />
AI Air <strong>in</strong>let<br />
AO Air outlet<br />
C Molar fraction of CO2<br />
EI Exhaust <strong>in</strong>let<br />
EO Exhaust outlet<br />
etaPWS Total efficiency of PWS<br />
ISFC Indicated specific fuel consumption [g/kW/h]<br />
m1 Mass flow <strong>in</strong> AI [kg/h]<br />
m2 Mass flow <strong>in</strong> AO [kg/h]<br />
m2red Reduced air mass flow <strong>in</strong> AO [kg/h]<br />
m3 Air mass flow <strong>in</strong> EI [kg/h]<br />
p0 Ambient pressure [kPa]<br />
p2 Relative boost pressure [kPa]<br />
p3 Relative EI pressure [kPa]<br />
p4 Relative EO pressure [kPa]<br />
piC Pressure ratio [1]<br />
PWS Pressure wave supercharger<br />
t0 Ambient temperature<br />
t1 Inlet temperature [deg C]<br />
t2 AO temperature [deg C]<br />
t3 EI average temperature [deg C]<br />
t4 EO temperature [deg C]<br />
ACKNOWLEDGMENTS<br />
The authors would like to express their grateful thanks to<br />
<strong>Czech</strong> turbocharger maker ČZ a.s., division Turbo, namely to<br />
Mr. Stulík, Mr. Havelka, Mr. Mach and division director Mr.<br />
P<strong>in</strong>kas for fruitful cooperation and support throughout the<br />
project. Special thank belongs to prof. Takats from JBRC for<br />
his k<strong>in</strong>dly help with tak<strong>in</strong>g CO2 measurement <strong>in</strong>to operation.<br />
Additional thanks belong also to author’s colleges from JBRC<br />
prof. Uhlíř and prof. Novák for their k<strong>in</strong>d help with tak<strong>in</strong>g of<br />
PWS electric drive <strong>in</strong>to operation.<br />
.<br />
REFERENCES<br />
[1] Spr<strong>in</strong>g, P.: Model<strong>in</strong>g and Control of Pressure-Wave<br />
Supercharged Eng<strong>in</strong>e Systems. Dissertation ETH Zürich 2006,<br />
No.16490<br />
[2] Weber, F., Guzzella, L.: Control Oriented Model<strong>in</strong>g of a<br />
Pressure Wave Supercharger. SAE Paper 2000-01-0567, 2000,<br />
pp. 91-100<br />
[3] Spr<strong>in</strong>g, P., Guzzella, L., Onder, C.: Optimal Control<br />
Strategy for a Pressure-Wave Supercharged SI Eng<strong>in</strong>e.<br />
<strong>Technical</strong> Paper, ICES2003-645, Spr<strong>in</strong>g <strong>Technical</strong> Conference<br />
of the ASME International Combustion Eng<strong>in</strong>e Division,<br />
Salzburg, Austria, 2003<br />
[4] Akbari, P., Nalim R., Müller,N.: A Review of Wave Rotor<br />
Technology and its Applications. IMECE2004-60082, 2004<br />
ASME International Mechanical Eng<strong>in</strong>eer<strong>in</strong>g Congress,<br />
Anaheim, California USA<br />
[5] Akbari, P., Müller,N.: Wave Rotor Research Program at<br />
Michigan State <strong>University</strong>. AIAA 2005-3844, 41 st<br />
AIAA/ASME/SAE/ASEE Jo<strong>in</strong>t Propulsion Conference and<br />
Exhibit, Tucson, Arizona<br />
[6] Iancu, F.: Integration of a Wave Rotor to an Ultra-Micro<br />
Gas Turb<strong>in</strong>e. Dissertation Michigan State <strong>University</strong> 2005,<br />
[7] Wenger, U., Mart<strong>in</strong>, R., Swissauto Eng. S.A.: Gas-Dynamic<br />
Pressure Mach<strong>in</strong>e. International Patent No.: WO 99/11913<br />
[8] Mart<strong>in</strong>, R., Wenger, U., Swissauto Eng S.A.:<br />
Gasdynamische Druckwellenmasch<strong>in</strong>e. European Patent, EP<br />
0 899 434 A1<br />
[9] Wenger, U., Mart<strong>in</strong>, R., Swissauto Eng S.A.: Verfahren zur<br />
Regelung e<strong>in</strong>er Verbrennungsmasch<strong>in</strong>e mit e<strong>in</strong>er<br />
gasdynamischen Druckwellenmasch<strong>in</strong>e. European Patent, EP<br />
1 375 858 A1<br />
[10] Oguri, Y., Suzuki, T., Yoshida, M., Cho, M.: Research on<br />
Adaptation of Pressure Wave Supercharger (PWS) to Gasol<strong>in</strong>e<br />
Eng<strong>in</strong>e. SAE Paper 2001-01-0368, 2001, pp. 101-107<br />
[11] Jenny, E.: Berechnungen und Modellversuche über<br />
Druckwellen grosser Amplituden <strong>in</strong> Auspuff-Leitungen.<br />
Dissertation ETH Zürich, Ameba Druck Basel 1949<br />
[12] Berchtold, M.: Druckwellenaufladung für kle<strong>in</strong>e<br />
Fahrzeug-Dieselmotoren. Schweizerische Bauzeitung 79, No.<br />
46, Switzerland, 1961, pp. 801-808<br />
[13] Shapiro, A. H.: The Dynamics and Thermodynamics of<br />
Compressible Fluid Flow. The Ronald Press Comp., New York<br />
1953<br />
[14] Piechna, J., Lisewski, P.: Numerical Analysis of Unsteady<br />
Two–Dimensional Flow Effects <strong>in</strong> the Comprex Supercharger.<br />
The Archive of Mechanical Eng<strong>in</strong>eer<strong>in</strong>g, Vol. XLV, No. 4,<br />
1998, pp. 341-351<br />
[15] Piechna, J.: Numerical Simulation of the Pressure Wave<br />
Supercharger – Effect of Pockets on the Comprex Supercharger<br />
Characteristics. The Archive of Mechanical Eng<strong>in</strong>eer<strong>in</strong>g, Vol.<br />
XLV, No. 4, 1998, pp. 305-323<br />
[16] Selerowicz, W., Piechna, J.: Comprex Type Supercharger<br />
as a Pressure-Wave Transformer Flow Characteristics. The<br />
Archive of Mechanical Eng<strong>in</strong>eer<strong>in</strong>g, Vol. XLVI, No. 1, 1999,<br />
pp. 57-77<br />
[17] Piechna, J.: Numerical Simulation of the Comprex Type of<br />
Supercharger: Comparison of Two Models of Boundary<br />
Condition. The Archive of Mechanical Eng<strong>in</strong>eer<strong>in</strong>g, Vol. XLV,<br />
No. 3, 1998, pp. 233-250<br />
13 Copyright © 2007 by ASME
[18] Zehnder, G.: Berechnung von Druckwellen <strong>in</strong> der<br />
Aufladetechnik. Brown Boveri Mitteilung, 4/5, 1971<br />
[19] Flückiger, L., Tafel, S., Spr<strong>in</strong>g, P.: Hochaufladung mit<br />
Druckwellenlader für Ottomotoren. MTZ 12, 2006, pp. 946-<br />
954<br />
[20] Guzzella, L., Mart<strong>in</strong>, R.: Das SAVE-Motorkonzept. MTZ<br />
10, 1998, pp. 644-650<br />
[21] Mayer, A., Nashar, I. El., Perewusnyk, J.: Comprex with<br />
Gas Pocket Control. Institution of Mechanical Eng<strong>in</strong>eers,<br />
C405/032, 1990, pp. 289-294<br />
[22] Kollbrunner, T. A.: Comprex Supercharg<strong>in</strong>g for Passenger<br />
Diesel Car Eng<strong>in</strong>es. SAE Paper 800884, West Coast<br />
International Meet<strong>in</strong>g, Los Angeles 1980<br />
[23] Croes, N.: Die Wirkungsweise der Taschen des<br />
Druckwellenladers Comprex. Motortechnische Zeitschrift, Vol.<br />
40, No. 2, 1979, pp. 91-97<br />
[24] Mayer, A.: COMPREX-Aufladung von PKW-<br />
Dieselmotoren. Beitrag für die Tagung‚ Moderne PKW-<br />
Dieselmotoren’ im Haus der Technik, Essen am 17./18. März<br />
1988<br />
[25] Schruf, G.M., Kollbrunner, T. A.: Application and<br />
Match<strong>in</strong>g of the Comprex Pressure-Wave Supercharger to<br />
Automotive Diesel Eng<strong>in</strong>es. SAE Paper 840133, International<br />
Congress and Exposition, Detroit, 1984<br />
[26] Berchtold, M., Gull, H.P.: Road Performance of a<br />
Comprex Supercharged Diesel Truck. SAE Paper 00118U,<br />
SAE National Diesel Eng<strong>in</strong>e Meet<strong>in</strong>g, La Salle Hotel, Chicago,<br />
Ill<strong>in</strong>ois, 1959<br />
[27] Tatsutomi, Y., Yoshizu, K., Komagam<strong>in</strong>e, M.: Der<br />
Dieselmotor mit Comprex-Aufladung für den Mazda 626. MTZ<br />
51(1990), pp. 124-132<br />
[28] Jenny, E., Bulaty, T.: Die Druckwellen-Masch<strong>in</strong>e<br />
Comprex als Oberstufe e<strong>in</strong>er Gasturb<strong>in</strong>e. Teil 1 and 2, MTZ 34<br />
(1973) 10 and 12, pp. 329-335, 421-425<br />
[29] Endres, H.: Comprex-Aufladung schnellaufender<br />
direkte<strong>in</strong>spritzender Dieselmotoren. Dissertation RWTH<br />
Aachen, 1985<br />
[30] BBC Brown Boveri: Comprex bullet<strong>in</strong> 3. Ausgabe: Januar<br />
1978, Gedruckt <strong>in</strong> der Schweiz (7912-1250-1)<br />
[31] Gygax, J., Schneider G.: Betriebserfahrungen mit dem<br />
Druckwellenlader Comprex im Opel Senator. MTZ 49,1988,<br />
pp. 335-339<br />
[32] Larm<strong>in</strong>ie, J., Dicks, A.: Fuel Cell Systems Expla<strong>in</strong>ed. SAE<br />
International, 2nd edition (May 1, 2003), ISBN 0-7680-1259-7<br />
[33] Gruden, D., Borgmann, K., Hiemesch, O.: Power Units for<br />
Transporation. The Handbook of Environmental Chemistry<br />
Vol. 3. Part T, Spr<strong>in</strong>ger-Verlag Berl<strong>in</strong> Heidelberg 2003<br />
[34] Pisch<strong>in</strong>ger, S., Schönfelder, C., Bornscheuer, W., K<strong>in</strong>del,<br />
H., Wiartalla: Integrated Air Supply and Humidification<br />
Concepts for Fuel Cell Systems. SAE 2001-01-0233, SAE<br />
2001 World Congress Detroit, Michigan March 5-8,2001<br />
[35] Wiartalla, A., Pisch<strong>in</strong>ger S., Bornscheuer,W., Fieweger,<br />
K., Ogrzewalla, J.: Compressor Expander Units for Fuel Cell<br />
Systems. SAE 2000-01-0380, SAE 2000 World Congress<br />
Detroit, Michigan March 6-9,2000<br />
[36] Cantemir, C.-G,. Hubert, Ch., Rizzoni, G., Demetrescu,<br />
B.,: High Performance Fuel Cell Sedan. SAE 2004-01-1003,<br />
SAE 2000-01-0380, SAE 2004 World Congress Detroit,<br />
Michigan March 8-11,2004<br />
[37] Pohořelský, L., Macek,J., Polašek M., Vítek, O.:<br />
Simulation of a COMPREX © Pressure Exchanger <strong>in</strong> a 1-D<br />
Code.SAE Paper 2004-01-1000, SAE International Warrendale<br />
2004, 13 pp.<br />
[38] Pohořelský, L.: Simulation of a COMPREX Supercharger<br />
<strong>in</strong> Transient Operations. MECCA, September 2005, Volume<br />
III., ISSN 1214-0821, Extended issue 3/2005 “Transient<br />
Processes <strong>in</strong> International Combustion Eng<strong>in</strong>es and<br />
Automotive Powertra<strong>in</strong>s”<br />
14 Copyright © 2007 by ASME
Absolute pressure [bar]<br />
Absolute pressure comparison<br />
1.7<br />
1.6<br />
1.5<br />
1.4<br />
1.3<br />
1.2<br />
1.1<br />
1<br />
0 5000 10000 15000 20000<br />
PWS speed [rpm]<br />
p2-100kg/h-measured p3-100kg/h-measured<br />
p2-100kg/h 1-D model without pockets p3-100kg/h 1-D model without pockets<br />
Figure A1: 1-D simulation vs. measurement<br />
for constant EI mass flow of 100kg/h<br />
1.9<br />
1.8<br />
1.7<br />
1.6<br />
1.5<br />
1.4<br />
1.3<br />
1.2<br />
1.1<br />
1<br />
2<br />
2.9<br />
2.8<br />
2.7<br />
2.6<br />
2.5<br />
2.4<br />
2.3<br />
2.2<br />
2.1<br />
3<br />
3.1<br />
Absolute pressure [bar]<br />
Absolute pressure comparison<br />
6000 8000 10000 12000 14000 16000 18000 20000<br />
p3-400kg/h-measured<br />
PWS speed [rpm]<br />
p2-400kg/h-measured<br />
p2-400kg/h 1-D model without pockets p3-400kg/h 1-D model without pockets<br />
ANNEX A<br />
COMPARISON OF 1-D MODEL SIMULATION TO MEASUREMENT<br />
Figure A2: 1-D simulation vs. measurement for constant<br />
EI mass flow of 400kg/h<br />
1.9<br />
1.8<br />
1.7<br />
1.6<br />
1.5<br />
2<br />
2.9<br />
2.8<br />
2.7<br />
2.6<br />
2.5<br />
2.4<br />
2.3<br />
2.2<br />
2.1<br />
3<br />
3.5<br />
3.4<br />
3.3<br />
3.2<br />
3.1<br />
Absolute pressure [bar]<br />
Absolute pressure comparison<br />
6000 8000 10000 12000 14000 16000 18000 20000<br />
p2-500kg/h-measured<br />
PWS speed [rpm]<br />
p3-500kg/h-measured<br />
p2-500kg/h 1-D model without pockets p3-500kg/h 1-D model without pockets<br />
Figure A3: 1-D simulation vs. measurement for constant EI<br />
mass flow of 500kg/h<br />
Mass flow [g/sec]<br />
Mass flow comparison<br />
EGR comparison<br />
120<br />
0.2<br />
0.18<br />
100<br />
0.16<br />
80<br />
0.14<br />
0.12<br />
60<br />
0.1<br />
40<br />
0.08<br />
0.06<br />
20<br />
0.04<br />
0<br />
0.02<br />
0 5000 10000 15000 20000<br />
0<br />
PWS speed [rpm]<br />
0 5000 10000 15000 20000<br />
m1-100kg/h-measured m1-100kg/h 1-D model without pockets<br />
PWS speed [rpm]<br />
m2-100kg/h 1-D model without pockets m3-100kg/h 1-D model without pockets<br />
egr-100kg/h-measured egr-400kg/h 1-D model without pockets<br />
Mass flow comparison<br />
180<br />
160<br />
140<br />
120<br />
100<br />
80<br />
60<br />
40<br />
20<br />
0<br />
6000 8000 10000 12000 14000 16000 18000 20000<br />
m1-400kg/h-measured<br />
PWS speed [rpm]<br />
m1-400kg/h 1-D model without pockets<br />
m2-400kg/h 1-D model without pockets m3-400kg/h 1-D model without pockets<br />
Mass flow [g/sec]<br />
Mass flow comparison<br />
180<br />
160<br />
140<br />
120<br />
100<br />
80<br />
60<br />
40<br />
20<br />
0<br />
6000 8000 10000 12000 14000 16000 18000 20000<br />
m1-500kg/h-measured<br />
PWS speed [rpm]<br />
m1-500kg/h 1-D model without pockets<br />
m2-500kg/h 1-D model without pockets m3-500kg/h 1-D model without pockets<br />
Mass flow [g/sec]<br />
EGR [1]<br />
EGR comparison<br />
0.50<br />
0.45<br />
0.40<br />
0.35<br />
0.30<br />
0.25<br />
0.20<br />
0.15<br />
0.10<br />
0.05<br />
0.00<br />
6000 8000 10000 12000 14000 16000 18000 20000<br />
PWS speed [rpm]<br />
egr-400kg/h-measured p2-400kg/h 1-D model without pockets<br />
EGR [1]<br />
EGR [1]<br />
EGR comparison<br />
0.9<br />
0.8<br />
0.7<br />
0.6<br />
0.5<br />
0.4<br />
0.3<br />
0.2<br />
0.1<br />
0<br />
6000 8000 10000 12000 14000 16000 18000 20000<br />
PWS speed [rpm]<br />
500kg/h-measured 500kg/h 1-D model without pockets<br />
15 Copyright © 2007 by ASME