caten in dynamics - Albrecht-Kossel-Institute for Neuroregeneration
caten in dynamics - Albrecht-Kossel-Institute for Neuroregeneration
caten in dynamics - Albrecht-Kossel-Institute for Neuroregeneration

You also want an ePaper? Increase the reach of your titles
YUMPU automatically turns print PDFs into web optimized ePapers that Google loves.
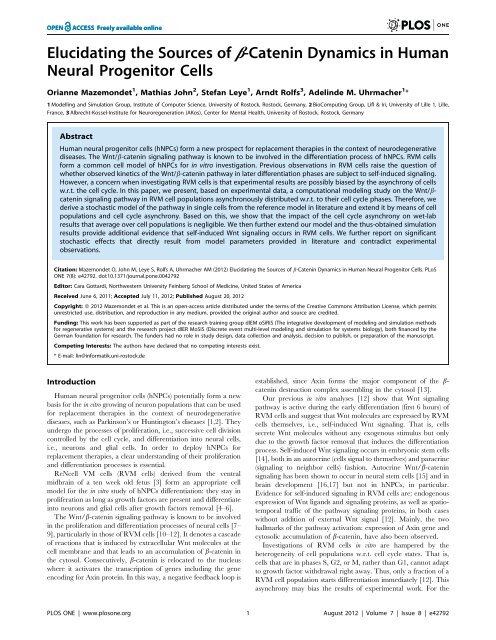
Elucidat<strong>in</strong>g the Sources of b-Caten<strong>in</strong> Dynamics <strong>in</strong> Human<br />
Neural Progenitor Cells<br />
Orianne Mazemondet 1 , Mathias John 2 , Stefan Leye 1 , Arndt Rolfs 3 , Adel<strong>in</strong>de M. Uhrmacher 1 *<br />
1 Modell<strong>in</strong>g and Simulation Group, <strong>Institute</strong> of Computer Science, University of Rostock, Rostock, Germany, 2 BioComput<strong>in</strong>g Group, Lifl & Iri, University of Lille 1, Lille,<br />
France, 3 <strong>Albrecht</strong>-<strong>Kossel</strong>-<strong>Institute</strong> <strong>for</strong> <strong>Neuroregeneration</strong> (AKos), Center <strong>for</strong> Mental Health, University of Rostock, Rostock, Germany<br />
Abstract<br />
Human neural progenitor cells (hNPCs) <strong>for</strong>m a new prospect <strong>for</strong> replacement therapies <strong>in</strong> the context of neurodegenerative<br />
diseases. The Wnt/b-<strong>caten</strong><strong>in</strong> signal<strong>in</strong>g pathway is known to be <strong>in</strong>volved <strong>in</strong> the differentiation process of hNPCs. RVM cells<br />
<strong>for</strong>m a common cell model of hNPCs <strong>for</strong> <strong>in</strong> vitro <strong>in</strong>vestigation. Previous observations <strong>in</strong> RVM cells raise the question of<br />
whether observed k<strong>in</strong>etics of the Wnt/b-<strong>caten</strong><strong>in</strong> pathway <strong>in</strong> later differentiation phases are subject to self-<strong>in</strong>duced signal<strong>in</strong>g.<br />
However, a concern when <strong>in</strong>vestigat<strong>in</strong>g RVM cells is that experimental results are possibly biased by the asynchrony of cells<br />
w.r.t. the cell cycle. In this paper, we present, based on experimental data, a computational model<strong>in</strong>g study on the Wnt/b<strong>caten</strong><strong>in</strong><br />
signal<strong>in</strong>g pathway <strong>in</strong> RVM cell populations asynchronously distributed w.r.t. to their cell cycle phases. There<strong>for</strong>e, we<br />
derive a stochastic model of the pathway <strong>in</strong> s<strong>in</strong>gle cells from the reference model <strong>in</strong> literature and extend it by means of cell<br />
populations and cell cycle asynchrony. Based on this, we show that the impact of the cell cycle asynchrony on wet-lab<br />
results that average over cell populations is negligible. We then further extend our model and the thus-obta<strong>in</strong>ed simulation<br />
results provide additional evidence that self-<strong>in</strong>duced Wnt signal<strong>in</strong>g occurs <strong>in</strong> RVM cells. We further report on significant<br />
stochastic effects that directly result from model parameters provided <strong>in</strong> literature and contradict experimental<br />
observations.<br />
Citation: Mazemondet O, John M, Leye S, Rolfs A, Uhrmacher AM (2012) Elucidat<strong>in</strong>g the Sources of b-Caten<strong>in</strong> Dynamics <strong>in</strong> Human Neural Progenitor Cells. PLoS<br />
ONE 7(8): e42792. doi:10.1371/journal.pone.0042792<br />
Editor: Cara Gottardi, Northwestern University Fe<strong>in</strong>berg School of Medic<strong>in</strong>e, United States of America<br />
Received June 6, 2011; Accepted July 11, 2012; Published August 20, 2012<br />
Copyright: ß 2012 Mazemondet et al. This is an open-access article distributed under the terms of the Creative Commons Attribution License, which permits<br />
unrestricted use, distribution, and reproduction <strong>in</strong> any medium, provided the orig<strong>in</strong>al author and source are credited.<br />
Fund<strong>in</strong>g: This work has been supported as part of the research tra<strong>in</strong><strong>in</strong>g group dIEM oSiRiS (The <strong>in</strong>tegrative development of model<strong>in</strong>g and simulation methods<br />
<strong>for</strong> regenerative systems) and the research project dIER MoSiS (Discrete event multi-level model<strong>in</strong>g and simulation <strong>for</strong> systems biology), both f<strong>in</strong>anced by the<br />
German foundation <strong>for</strong> research. The funders had no role <strong>in</strong> study design, data collection and analysis, decision to publish, or preparation of the manuscript.<br />
Compet<strong>in</strong>g Interests: The authors have declared that no compet<strong>in</strong>g <strong>in</strong>terests exist.<br />
* E-mail: l<strong>in</strong>@<strong>in</strong><strong>for</strong>matik.uni-rostock.de<br />
Introduction<br />
Human neural progenitor cells (hNPCs) potentially <strong>for</strong>m a new<br />
basis <strong>for</strong> the <strong>in</strong> vitro grow<strong>in</strong>g of neuron populations that can be used<br />
<strong>for</strong> replacement therapies <strong>in</strong> the context of neurodegenerative<br />
diseases, such as Park<strong>in</strong>son’s or Hunt<strong>in</strong>gton’s diseases [1,2]. They<br />
undergo the processes of proliferation, i.e., successive cell division<br />
controlled by the cell cycle, and differentiation <strong>in</strong>to neural cells,<br />
i.e., neurons and glial cells. In order to deploy hNPCs <strong>for</strong><br />
replacement therapies, a clear understand<strong>in</strong>g of their proliferation<br />
and differentiation processes is essential.<br />
ReNcell VM cells (RVM cells) derived from the ventral<br />
midbra<strong>in</strong> of a ten week old fetus [3] <strong>for</strong>m an appropriate cell<br />
model <strong>for</strong> the <strong>in</strong> vitro study of hNPCs differentiation: they stay <strong>in</strong><br />
proliferation as long as growth factors are present and differentiate<br />
<strong>in</strong>to neurons and glial cells after growth factors removal [4–6].<br />
The Wnt/b-<strong>caten</strong><strong>in</strong> signal<strong>in</strong>g pathway is known to be <strong>in</strong>volved<br />
<strong>in</strong> the proliferation and differentiation processes of neural cells [7–<br />
9], particularly <strong>in</strong> those of RVM cells [10–12]. It denotes a cascade<br />
of reactions that is <strong>in</strong>duced by extracellular Wnt molecules at the<br />
cell membrane and that leads to an accumulation of b-<strong>caten</strong><strong>in</strong> <strong>in</strong><br />
the cytosol. Consecutively, b-<strong>caten</strong><strong>in</strong> is relocated to the nucleus<br />
where it activates the transcription of genes <strong>in</strong>clud<strong>in</strong>g the gene<br />
encod<strong>in</strong>g <strong>for</strong> Ax<strong>in</strong> prote<strong>in</strong>. In this way, a negative feedback loop is<br />
established, s<strong>in</strong>ce Ax<strong>in</strong> <strong>for</strong>ms the major component of the b<strong>caten</strong><strong>in</strong><br />
destruction complex assembl<strong>in</strong>g <strong>in</strong> the cytosol [13].<br />
Our previous <strong>in</strong> vitro analyses [12] show that Wnt signal<strong>in</strong>g<br />
pathway is active dur<strong>in</strong>g the early differentiation (first 6 hours) of<br />
RVM cells and suggest that Wnt molecules are expressed by RVM<br />
cells themselves, i.e., self-<strong>in</strong>duced Wnt signal<strong>in</strong>g. That is, cells<br />
secrete Wnt molecules without any exogenous stimulus but only<br />
due to the growth factor removal that <strong>in</strong>duces the differentiation<br />
process. Self-<strong>in</strong>duced Wnt signal<strong>in</strong>g occurs <strong>in</strong> embryonic stem cells<br />
[14], both <strong>in</strong> an autocr<strong>in</strong>e (cells signal to themselves) and paracr<strong>in</strong>e<br />
(signal<strong>in</strong>g to neighbor cells) fashion. Autocr<strong>in</strong>e Wnt/b-<strong>caten</strong><strong>in</strong><br />
signal<strong>in</strong>g has been shown to occur <strong>in</strong> neural stem cells [15] and <strong>in</strong><br />
bra<strong>in</strong> development [16,17] but not <strong>in</strong> hNPCs, <strong>in</strong> particular.<br />
Evidence <strong>for</strong> self-<strong>in</strong>duced signal<strong>in</strong>g <strong>in</strong> RVM cells are: endogenous<br />
expression of Wnt ligands and signal<strong>in</strong>g prote<strong>in</strong>s, as well as spatiotemporal<br />
traffic of the pathway signal<strong>in</strong>g prote<strong>in</strong>s, <strong>in</strong> both cases<br />
without addition of external Wnt signal [12]. Ma<strong>in</strong>ly, the two<br />
hallmarks of the pathway activation: expression of Ax<strong>in</strong> gene and<br />
cytosolic accumulation of b-<strong>caten</strong><strong>in</strong>, have also been observed.<br />
Investigations of RVM cells <strong>in</strong> vitro are hampered by the<br />
heterogeneity of cell populations w.r.t. cell cycle states. That is,<br />
cells that are <strong>in</strong> phases S, G2, or M, rather than G1, cannot adapt<br />
to growth factor withdrawal right away. Thus, only a fraction of a<br />
RVM cell population starts differentiation immediately [12]. This<br />
asynchrony may bias the results of experimental work. For the<br />
PLOS ONE | www.plosone.org 1 August 2012 | Volume 7 | Issue 8 | e42792
time be<strong>in</strong>g, techniques to synchronize RVM cell populations<br />
dur<strong>in</strong>g proliferation could not be successfully applied.<br />
Computational model<strong>in</strong>g provides a way to circumvent the<br />
limitations of wet-lab experiments. The basic idea is to create an<br />
abstract representation of the system under study, a <strong>for</strong>mal model,<br />
which is then analyzed with the help of computers. Models to<br />
describe a system’s <strong>dynamics</strong> are <strong>in</strong> need of k<strong>in</strong>etic parameters,<br />
such as rate constants. The closer k<strong>in</strong>etic parameters relate to<br />
experimental data the more reliable the results of a model<strong>in</strong>g study<br />
are.<br />
Stochastic model<strong>in</strong>g, as described <strong>in</strong> [18], considers models <strong>in</strong><br />
terms of chemical reactions and multisets of molecules, which<br />
represent chemical solutions. Molecular <strong>in</strong>teractions are regarded<br />
as discrete events randomly distributed <strong>in</strong> time. Analysis of<br />
stochastic models <strong>in</strong> terms of stochastic simulation provides dist<strong>in</strong>ct<br />
sequences of molecular <strong>in</strong>teractions, with each simulation run<br />
be<strong>in</strong>g a different sequence. Stochastic effects have been shown to<br />
have significant impact on the <strong>dynamics</strong> of biochemical systems,<br />
especially <strong>in</strong> signal<strong>in</strong>g pathways where key players appear <strong>in</strong><br />
relatively low abundance [19]. Spatial aspects, such as molecular<br />
location or crowd<strong>in</strong>g, may add to this [20].<br />
Determ<strong>in</strong>istic model<strong>in</strong>g studies usually trans<strong>for</strong>m chemical<br />
reactions <strong>in</strong>to ord<strong>in</strong>ary differential equations (ODEs) and regard<br />
concentrations <strong>in</strong>stead of multisets of molecules. The equivalent to<br />
simulation <strong>in</strong> the context of ODEs is numerical <strong>in</strong>tegration.<br />
Studies based on ODEs <strong>for</strong>m an approximation of the stochastic<br />
approach that neglects the stochastic effects and thus may miss<br />
significant variations <strong>in</strong> the <strong>dynamics</strong> of systems [21,22].<br />
Furthermore, models expressed <strong>in</strong> ODEs often largely abstract<br />
from chemical reactions by aggregat<strong>in</strong>g several chemical species<br />
and reactions, e.g., <strong>in</strong> order to deal with a lack of k<strong>in</strong>etic<br />
parameters. This may largely hamper the switch back to the<br />
stochastic realm.<br />
In this paper, we present, based on experimental data, a<br />
computational model<strong>in</strong>g study on cell cycle asynchrony and self<strong>in</strong>duced<br />
signal<strong>in</strong>g <strong>in</strong> the context of the Wnt/b-<strong>caten</strong><strong>in</strong> pathway <strong>in</strong><br />
RVM cells. There<strong>for</strong>e, we derive a model of the core components<br />
of the Wnt/b-<strong>caten</strong><strong>in</strong> pathway from the reference model of this<br />
pathway <strong>in</strong> Xenopus oocyte (referred to as the Lee model<br />
subsequently) [23] and validate it with experimental data <strong>for</strong><br />
RVM cells, as obta<strong>in</strong>ed <strong>in</strong> our prior work [12]. Our model extends<br />
on the Lee model as it is fully specified <strong>in</strong> terms of chemical<br />
reactions, which allows us to easily switch between the stochastic<br />
and determ<strong>in</strong>istic doma<strong>in</strong>. Furthermore, it covers spatial aspects<br />
w.r.t. molecule location <strong>in</strong> compartments. For this, we provide<br />
additional experimental data on compartment volumes and<br />
molecule distribution <strong>in</strong> space.<br />
We extend this core model with means of cell populations and<br />
cell cycle asynchrony based partly on our own experimental data<br />
and partly on data from the literature <strong>for</strong> the distribution of RVM<br />
cell populations over cell cycle states. We show, based on the<br />
comparison of experimental <strong>in</strong> vitro and <strong>in</strong> silico simulation data,<br />
that the impact of the cell cycle asynchrony on the average b<strong>caten</strong><strong>in</strong><br />
<strong>dynamics</strong> <strong>in</strong> cell populations as observed <strong>in</strong> wet-lab<br />
experiments is negligible. We additionally extend our model with<br />
mechanisms <strong>for</strong> self-<strong>in</strong>duced signal<strong>in</strong>g. Compar<strong>in</strong>g further results<br />
from simulation studies to experimental data allows us to provide<br />
additional evidence that self-<strong>in</strong>duced Wnt signal<strong>in</strong>g may occur <strong>in</strong><br />
RVM cells. Moreover, we show that <strong>in</strong> our model of RVM cells,<br />
low Ax<strong>in</strong> amounts, such as suggested by [23] <strong>for</strong> Xenopus oocyte,<br />
lead to significant stochastic effects that contradict experimental<br />
observations and that are not observable <strong>in</strong> determ<strong>in</strong>istic<br />
<strong>in</strong>vestigations. To the best of our knowledge, so far, no results<br />
on stochastic <strong>in</strong>vestigations have been presented <strong>in</strong> the context of<br />
the Wnt/b-<strong>caten</strong><strong>in</strong> pathway.<br />
Related work<br />
The reference model of the Wnt/b-<strong>caten</strong><strong>in</strong> pathway, the Lee<br />
model, is based on ord<strong>in</strong>ary differential equations (ODEs) [23]. It<br />
represents the pathway <strong>in</strong> the Xenopus oocyte and is based on<br />
experimental data. Model analysis revealed that Ax<strong>in</strong> is the<br />
limit<strong>in</strong>g prote<strong>in</strong> of the system due to its low abundance.<br />
Furthermore, Ax<strong>in</strong> turnover strongly regulates b-<strong>caten</strong><strong>in</strong> <strong>dynamics</strong>.<br />
Three follow-ups of the Lee model exist. The work presented <strong>in</strong><br />
[24] and [25] extend the Lee model with one and two negative<br />
feedback loops, respectively. The latter shows that the addition of<br />
the negative feedbacks leads to an adaptation of the parameters<br />
given <strong>in</strong> the Lee model, especially an <strong>in</strong>crease of b-<strong>caten</strong><strong>in</strong> and Ax<strong>in</strong><br />
turnover. The work presented <strong>in</strong> [26] aims to reduce the Lee model.<br />
A first study of b-<strong>caten</strong><strong>in</strong>’s roles <strong>in</strong> correlation with its cellular<br />
location is presented <strong>in</strong> [27]. Based on the Lee model, they analyze,<br />
<strong>in</strong> the context of colorectal cancer, the balance between the two<br />
roles of b-<strong>caten</strong><strong>in</strong>: its participation <strong>in</strong> cell adhesion at the<br />
membrane and <strong>in</strong> the Wnt pathway <strong>in</strong> the cytosol. However,<br />
their computational model only considers s<strong>in</strong>gle cells and does not<br />
take <strong>in</strong>to account compartments such as the cytosol or the<br />
membrane.<br />
An exhaustive review of models related to the Wnt pathway is<br />
available <strong>in</strong> [28]. It covers models of the Wnt pathways and their<br />
implications <strong>in</strong> animal development and <strong>in</strong> cross-talks.<br />
Results and Discussion<br />
b-Caten<strong>in</strong> Dynamics Human Neural Progenitor Cells<br />
In the follow<strong>in</strong>g, we first recapitulate the experimental data<br />
result<strong>in</strong>g from our prior work [12]. They <strong>for</strong>m the crucial basis of<br />
any conclusion drawn <strong>in</strong> this study as they are the reference to<br />
which we compare our simulation results of b-<strong>caten</strong><strong>in</strong> <strong>dynamics</strong> <strong>in</strong><br />
RVM cells. Then, we describe our core model of the Wnt/b<strong>caten</strong><strong>in</strong><br />
pathway and its evaluation to experimental and literature<br />
data. This is followed by a report on the stochastic effects on our<br />
model’s behavior. Subsequently, we discuss our <strong>in</strong>vestigations on<br />
cell cycle asynchrony <strong>in</strong> the context of the Wnt/b-<strong>caten</strong><strong>in</strong> pathway<br />
and on self-<strong>in</strong>duced Wnt signal<strong>in</strong>g <strong>in</strong> RVM cells.<br />
Experimental data on b-<strong>caten</strong><strong>in</strong> <strong>dynamics</strong> <strong>in</strong> RVM cells<br />
Our study is based on wet-lab data obta<strong>in</strong>ed from Western blot<br />
experiments [29] presented <strong>in</strong> Figure 1, and reproduced from the<br />
Figure 8 <strong>in</strong> [12]. These data present the <strong>dynamics</strong> of nuclear b<strong>caten</strong><strong>in</strong><br />
<strong>in</strong> RVM cell populations from the start<strong>in</strong>g po<strong>in</strong>t of<br />
differentiation, i.e., growth factor removal (time po<strong>in</strong>t 0 hour) until<br />
72 hours after.<br />
The data show two significant <strong>in</strong>creases of b-<strong>caten</strong><strong>in</strong> dur<strong>in</strong>g the<br />
cell differentiation. The first with a peak at ca. 1 hour and the<br />
second cont<strong>in</strong>uously grow<strong>in</strong>g from 8 hours on (Figure 1B). Such<br />
biphasic activity of Wnt is known dur<strong>in</strong>g embryonic stem cell<br />
development [30,31]. We expect the first <strong>in</strong>crease to be a direct<br />
result of the Wnt/b-<strong>caten</strong><strong>in</strong> pathway activity, e.g., through<br />
crosstalk with growth factor pathways [32]. The source of the<br />
second <strong>in</strong>crease, however, rema<strong>in</strong>s controversial. On one hand it<br />
may result from cell cycle asynchrony. On the other hand, it may<br />
be caused by a subsequent self-<strong>in</strong>duced signal<strong>in</strong>g from time po<strong>in</strong>t<br />
8 hours on, as the Wnt signal is also developmental-stage specific<br />
[30]. Whereas we show <strong>in</strong> the 3rd section of this chapter that the<br />
first hypothesis can be rejected, we provide evidence <strong>for</strong> the second<br />
<strong>in</strong> the last section of this chapter. After 24 hours, another<br />
accumulation of b-<strong>caten</strong><strong>in</strong> can be observed. However, at that<br />
PLOS ONE | www.plosone.org 2 August 2012 | Volume 7 | Issue 8 | e42792
time, the cell population is already heterogeneous due to<br />
differentiation, such that the accumulation may orig<strong>in</strong>ate from<br />
multiple sources. There<strong>for</strong>e, our study presented focuses only on<br />
the first 12 hours.<br />
The measurements presented <strong>in</strong> Figure 1 are <strong>in</strong> terms of relative<br />
fold changes compared to time po<strong>in</strong>t 0 hour, whose value is set to<br />
1.0 (see Materials & Methods). Throughout this paper, when<br />
compar<strong>in</strong>g wet-lab experiments to simulation results, we there<strong>for</strong>e<br />
consider relative amounts of nuclear b-<strong>caten</strong><strong>in</strong> (bnuc <strong>in</strong> our<br />
model), where value 1.0 represents the <strong>in</strong>itial concentration or<br />
<strong>in</strong>itial amount <strong>in</strong> determ<strong>in</strong>istic or stochastic simulations, respectively.<br />
Model of the Wnt/b-<strong>caten</strong><strong>in</strong> pathway <strong>in</strong> RVM cells<br />
In this section, we describe our core model and detail its<br />
underly<strong>in</strong>g assumptions. We evaluate the model based on two<br />
determ<strong>in</strong>istic simulation experiments, whereby the first compares<br />
to the Lee model to show that we cover the basic mach<strong>in</strong>ery of the<br />
Wnt/b-<strong>caten</strong><strong>in</strong> pathway, as it is currently known, and the second<br />
compares to our own experimental data. Parameter sets are partly<br />
derived from literature [23,33] and from wet-lab experiments<br />
[10,12]. Furthermore, due to unknown parameters, each evaluation<br />
procedure <strong>in</strong>volves some <strong>in</strong> silico experiments fitt<strong>in</strong>g the<br />
behavior of the model to the respective reference behaviors<br />
(parameter fitt<strong>in</strong>g experiments). There<strong>for</strong>e each evaluation study<br />
comes with its <strong>in</strong>dividual sets of parameters. The parameter set<br />
result<strong>in</strong>g from the comparison to our own experimental data<br />
serves as a basis <strong>for</strong> the <strong>in</strong>vestigations as reported <strong>in</strong> the subsequent<br />
sections.<br />
Model def<strong>in</strong>ition. Our core model of the Wnt/b-<strong>caten</strong><strong>in</strong><br />
pathway is derived from the Lee model and covers the basic<br />
components and processes <strong>in</strong> two compartments. In the cytosol, b<strong>caten</strong><strong>in</strong><br />
is destructed by the degradation complex, which <strong>for</strong>ms<br />
around Ax<strong>in</strong> and is deactivated by Wnt. In the nucleus the<br />
negative feedback loop is established that consists <strong>in</strong> b-<strong>caten</strong><strong>in</strong><br />
b-Caten<strong>in</strong> Dynamics Human Neural Progenitor Cells<br />
Figure 1. Nuclearb-<strong>caten</strong><strong>in</strong> dur<strong>in</strong>g RVM cell differentiation. (A) Representative Western-blot from which the b-<strong>caten</strong><strong>in</strong> prote<strong>in</strong> amount was<br />
quantified (B). Time po<strong>in</strong>t 0 stands <strong>for</strong> control us<strong>in</strong>g proliferat<strong>in</strong>g cells and b-act<strong>in</strong> was used as a load<strong>in</strong>g control. The signal <strong>in</strong>tensities at 0 hour are<br />
normalized to 1.0 and the values are presented as mean + standard error on the mean from at least 3 <strong>in</strong>dependent experiments. The figure is<br />
reproduced from [12] (Figures 8C and 8D) where details about experimentation can be found, as well as <strong>in</strong> the section Materials & Methods.<br />
doi:10.1371/journal.pone.0042792.g001<br />
trigger<strong>in</strong>g Ax<strong>in</strong> production, lead<strong>in</strong>g to a higher amount of<br />
degradation complex <strong>in</strong> the cytosol. The nucleus is assumed to<br />
be spherical and the cytosol, as it is surround<strong>in</strong>g the nucleus, to<br />
<strong>for</strong>m a spherical shell, see Figure 2.<br />
We only consider the three ma<strong>in</strong> prote<strong>in</strong>s: Wnt, b-<strong>caten</strong><strong>in</strong>, and<br />
Ax<strong>in</strong>. They are represented by five species. We <strong>in</strong>troduce two<br />
species <strong>for</strong> b-<strong>caten</strong><strong>in</strong>, bcyt and bnuc, to represent its cellular<br />
location <strong>in</strong> the cytosol and <strong>in</strong> the nucleus, respectively, and two<br />
species <strong>for</strong> Ax<strong>in</strong> reflect<strong>in</strong>g the phosphorylation state of Ax<strong>in</strong> (Ax<strong>in</strong><br />
and Ax<strong>in</strong>P). Follow<strong>in</strong>g the ideas <strong>in</strong> [34], Ax<strong>in</strong> entirely abstracts<br />
the degradation complex: Ax<strong>in</strong> and Ax<strong>in</strong>P represent<strong>in</strong>g the<br />
<strong>in</strong>active and active degradation complex, respectively. Ax<strong>in</strong> only<br />
occurs <strong>in</strong> the cytosol. Furthermore also Wnt is located <strong>in</strong> the<br />
cytosol, s<strong>in</strong>ce we do not consider the processes of transferr<strong>in</strong>g the<br />
Wnt signal from the outside to the <strong>in</strong>side of the cell.<br />
Our model is entirely expressed <strong>in</strong> terms of chemical reactions<br />
(listed <strong>in</strong> Table 1). can either decay (r6, kA;) or phosphorylate to<br />
become Ax<strong>in</strong>P (r4, kA?AP ). The latter can aga<strong>in</strong> dephosphorylate<br />
(r3, kAP?A), decay (r5, kAP; ), or degrade bcyt (r7, kbY). We<br />
represent the Wnt-dependent deactivation of the degradation<br />
complex by Wnt promot<strong>in</strong>g Ax<strong>in</strong>P dephosphorylation (r2,<br />
kAP[A). Notice that by this the amount of bcyt is <strong>in</strong>directly<br />
<strong>in</strong>creased. Moreover, this <strong>for</strong>ms also the only way <strong>in</strong> which the<br />
Wnt signal <strong>in</strong>fluences b-<strong>caten</strong><strong>in</strong> <strong>dynamics</strong>.<br />
Previous wet-lab experiments suggest that the passage from cell<br />
proliferation to differentiation after removal of growth factors is<br />
accompanied with an extra-cellular presence of active Wnt<br />
molecules that is self-<strong>in</strong>duced by the cell population [12]. Our<br />
model reflects this fact by consider<strong>in</strong>g a given <strong>in</strong>itial amount of<br />
Wnt. The effect of the signal decreases over time, s<strong>in</strong>ce Wnt<br />
decays (r1, kW;) and is not further produced.<br />
For bcyt, there exists a constant flux of production (r8, kb:) and<br />
decay (r9, kb;). Furthermore, bcyt travels between the cytosol and<br />
the nucleus <strong>in</strong> both directions (r10, kb<strong>in</strong>, and r11, kbout). In the<br />
nucleus, bnuc <strong>in</strong>duces Ax<strong>in</strong> production (r12, kA:), represent<strong>in</strong>g the<br />
PLOS ONE | www.plosone.org 3 August 2012 | Volume 7 | Issue 8 | e42792
Figure 2. Schematic representation of the <strong>in</strong>tracellular Wnt/b-<strong>caten</strong><strong>in</strong> pathway model. A cell is composed of two compartments, the<br />
cytosol and the nucleus, separated by the dashed lane. The five species are framed <strong>in</strong> gray. Only the species Wnt is extra-cellular. For a given reaction,<br />
an arrow-less lane shows the reactant(s), and an arrow lane po<strong>in</strong>ts to the product. Bended arrows represent prote<strong>in</strong> production <strong>for</strong> reaction r8 or<br />
prote<strong>in</strong> decay <strong>for</strong> reactions r1, r5, r6, and r9. An open arrow com<strong>in</strong>g after a large vertical bar represents a trigger effect (accord<strong>in</strong>g to the Systems<br />
Biology Graphical Notation [60]) where the reactant is not consumed <strong>in</strong> the reaction, but necessary <strong>for</strong> the process to take place. The reactions’<br />
numbers correspond to the ones <strong>in</strong> Table 1.<br />
doi:10.1371/journal.pone.0042792.g002<br />
pathway’s negative feedback loop. Except <strong>for</strong> bcyt production (r8,<br />
kb:) that is modeled as a constant flux, all the reactions follow<br />
Mass action k<strong>in</strong>etics.<br />
It is worth not<strong>in</strong>g that the Lee model conta<strong>in</strong>s reactions <strong>for</strong> both<br />
basal Ax<strong>in</strong> and basal b-<strong>caten</strong><strong>in</strong> production. By contrast, our model<br />
only conta<strong>in</strong>s basal b-<strong>caten</strong><strong>in</strong> production. The reason is that basal<br />
Ax<strong>in</strong> production is a constant flux, i.e., its reaction speed is<br />
<strong>in</strong>dependent of species concentration levels. As the reaction rate<br />
constant of this flux is, accord<strong>in</strong>g to the Lee model, five orders of<br />
magnitudes lower than the one of basal b-<strong>caten</strong><strong>in</strong> production, its<br />
impact is negligible and can there<strong>for</strong>e be omitted.<br />
Model assumptions. We adopt the usual assumptions made<br />
when model<strong>in</strong>g cell-biological systems, i.e., constant compartment<br />
volumes, molecules without volumes, etc. [18]. Besides focuss<strong>in</strong>g<br />
only on the major components of the Wnt/b-<strong>caten</strong><strong>in</strong> pathway, we<br />
Table 1. Reactions of the <strong>in</strong>tracellular Wnt/b-<strong>caten</strong><strong>in</strong> pathway<br />
model.<br />
Wnt ? kw1 1<br />
WntzAx<strong>in</strong>P ?<br />
KA P [A<br />
WntzAx<strong>in</strong><br />
Ax<strong>in</strong>P ?<br />
kA?AP<br />
Ax<strong>in</strong><br />
Ax<strong>in</strong> ?<br />
kA?AP<br />
Ax<strong>in</strong>P<br />
Ax<strong>in</strong>P ?<br />
kA P;<br />
1<br />
Ax<strong>in</strong> ? kA;<br />
1<br />
Ax<strong>in</strong>PzBcyt ? kbY<br />
Ax<strong>in</strong>P<br />
1 ? kb:<br />
Bcyt<br />
Bcyt ? kb;<br />
1<br />
Bcyt ? kb<strong>in</strong><br />
Bnuc<br />
Bnuc ?<br />
kbout<br />
Bcyt<br />
Bnuc ? kA:<br />
Ax<strong>in</strong>zBnuc<br />
All reactions are follow<strong>in</strong>g Mass action k<strong>in</strong>etics, but b-<strong>caten</strong><strong>in</strong> production (1)<br />
that is a constant flux. The reaction numbers correspond to the ones <strong>in</strong> the<br />
model schema (Figure 1).<br />
doi:10.1371/journal.pone.0042792.t001<br />
(1)<br />
(2)<br />
(3)<br />
(4)<br />
(5)<br />
(6)<br />
(7)<br />
(8)<br />
(9)<br />
(10)<br />
(11)<br />
(12)<br />
b-Caten<strong>in</strong> Dynamics Human Neural Progenitor Cells<br />
also neglect possible crosstalks with other pathways, such as Ryk<br />
[35] or Notch [36]. Follow<strong>in</strong>g the ideas <strong>in</strong> [34], we abstract the<br />
degradation complex by only one of its components, Ax<strong>in</strong>. This is<br />
possible s<strong>in</strong>ce Ax<strong>in</strong> is the limit<strong>in</strong>g factor of the degradation<br />
complex due to its low amount <strong>in</strong> comparison to the other three<br />
components, GSK3b, APC, and CKIa [23]. The b<strong>in</strong>d<strong>in</strong>g of Wnt<br />
molecules to the membrane receptors is not represented as it still<br />
rema<strong>in</strong>s, biologically, poorly understood. The reaction of Wnt decay<br />
(r1) represents both its consumption and deactivation after<br />
signal<strong>in</strong>g. The nucleo-cytoplasmic shuttl<strong>in</strong>g of b-<strong>caten</strong><strong>in</strong> rema<strong>in</strong>s<br />
yet unclear [37], thus we <strong>in</strong>troduce the motion of b-<strong>caten</strong><strong>in</strong> as a<br />
simple diffusion [38] with rate constants based on experimental<br />
data [33].<br />
Model evaluation by comparison to the Lee model. In the<br />
follow<strong>in</strong>g, we provide an evaluation study <strong>for</strong> the overall concept<br />
of our model, with its reactions and the assumptions made, based<br />
on a comparison to the Lee model. It focuses on compar<strong>in</strong>g the<br />
concentration of bnuc to the concentration of free b-<strong>caten</strong><strong>in</strong> <strong>in</strong> the<br />
Lee model (that considers only the cytosolic compartment).<br />
In our model, <strong>in</strong>itial concentrations are taken from the Lee model,<br />
as they were retrieved from experiments <strong>in</strong> Xenopus oocyte. An<br />
exception <strong>for</strong>ms the concentration of Wnt. In the Lee model, Wnt<br />
molecules are not considered but replaced by a rather abstract<br />
signal called W. The signal W has a real value between 0 and 1<br />
that decreases exponentially follow<strong>in</strong>g: W(t)~exp({0:133 : t=20).<br />
In our model, Wnt molecules decay over time follow<strong>in</strong>g a Mass<br />
action k<strong>in</strong>etics (r1). The k<strong>in</strong>etic rate value <strong>for</strong> this reaction is<br />
obta<strong>in</strong>ed from the previous function W(t):<br />
~{0:133=20~6:65 : 10 {3 m<strong>in</strong> {1 , and an <strong>in</strong>itial Wnt concentration<br />
of 100 (unitless) is assumed. Reactions <strong>for</strong> decay and<br />
production and <strong>for</strong> Ax<strong>in</strong> decay are conserved from the Lee model.<br />
Table 2 presents the parameter names and values as used <strong>in</strong> the<br />
Lee model and their respective names <strong>in</strong> our model.<br />
Table 3, Set 1 provides the values of all model parameters: The<br />
k<strong>in</strong>etic rates of reactions r10 and r11 are taken from literature [33].<br />
As several other rate constants are unknown, we per<strong>for</strong>med<br />
parameter fitt<strong>in</strong>g experiments (parameter estimation details are<br />
given <strong>in</strong> Materials & Methods Section).<br />
The results of simulation experiments with Wnt set to 100<br />
(transient Wnt stimulation) <strong>in</strong> our model, and W~1 <strong>in</strong> the Lee<br />
model are provided <strong>in</strong> Figures 3. They show a good fit between the<br />
concentrations of bnuc <strong>in</strong> our model and b-<strong>caten</strong><strong>in</strong> <strong>in</strong> the Lee model.<br />
PLOS ONE | www.plosone.org 4 August 2012 | Volume 7 | Issue 8 | e42792
Table 2. Parameters from the Lee model [23] used <strong>in</strong> our model and their stochastic conversion.<br />
Lee model our model<br />
Parameters Determ<strong>in</strong>istic values Parameters Stochastic values<br />
Species <strong>in</strong>itial values<br />
X11 25.01 nM nbcyt 13141 molecules<br />
nbnuc 5347 molecules<br />
X12 0.02 nM nAx<strong>in</strong> 11 molecules<br />
nAx<strong>in</strong>P 11 molecules<br />
W 0ƒWƒ1 nWnt 100 (dimensionless)<br />
Rate constants<br />
v12 0:423 nM : m<strong>in</strong> {1 kb: 222 m<strong>in</strong> {1<br />
W(t) exp({0:133 : t=20) kW; 6:65 : 10 {3 m<strong>in</strong> {1<br />
k15 0:167 m<strong>in</strong> {1 kAP; 0:167 m<strong>in</strong> {1<br />
Model evaluation by comparison to experimental<br />
data. Here, we present the results of a parameter fitt<strong>in</strong>g<br />
experiment that compares the <strong>dynamics</strong> of <strong>in</strong> bnuc our model to<br />
those provided by our wet-lab experiments (see Figure 1). Only the<br />
first <strong>in</strong>crease <strong>in</strong> the data is subject to the fitt<strong>in</strong>g, s<strong>in</strong>ce it is the one<br />
kA; 0:167 m<strong>in</strong> {1<br />
k13 2:57 : 10 {4 m<strong>in</strong> {1 kb; 2:57 : 10 {4 m<strong>in</strong> {1<br />
Parameters’ names and values are given as <strong>in</strong> [23]. Their correspond<strong>in</strong>g names <strong>in</strong> our model are given with their stochastic values.<br />
doi:10.1371/journal.pone.0042792.t002<br />
Table 3. List of model parameters.<br />
b-Caten<strong>in</strong> Dynamics Human Neural Progenitor Cells<br />
considered to reflect the <strong>dynamics</strong> of the Wnt/b-<strong>caten</strong><strong>in</strong> pathway<br />
as <strong>in</strong>itially <strong>in</strong>duced by growth factor removal. Notice that at this<br />
po<strong>in</strong>t we compare s<strong>in</strong>gle <strong>in</strong> silico cells to the average behavior of<br />
entire populations as measured <strong>in</strong> our wet-lab experiments. This<br />
Parameters Determ<strong>in</strong>istic values Stochastic values<br />
Set 1 Set 2 Set 3 Set4<br />
Species <strong>in</strong>itial values<br />
nbcyt 24.9 nM 23.6 nM 11145 molecules 12989 molecules<br />
nbnuc 24.9 nM 23.6 nM 4532 molecules 5282 molecules<br />
nAx<strong>in</strong> 0.007 nM 0.051 nM 144 molecules 252 molecules<br />
nAx<strong>in</strong>P 0.042 nM 0 nM 125 molecules 219 molecules<br />
nWnt<br />
Rate constants<br />
100 1000 1000 1000<br />
kb: 0.232* 0.571* 420 600<br />
kW; 6:65 : 10 {3 0.27 0.6 0.27<br />
kAP[A 7 10 10 20<br />
kAP?A 0.3 0.0182 0.03 0.03<br />
kA?AP 3 1:619 : 10 {3 0.03 0.03<br />
kAP; 0.167 0.167 4:48 : 10 {3 4:48 : 10 {3<br />
kA; 0.367 0.0167 2:4 : 10 {3 4:48 : 10 {3<br />
kbY 4:17 : 10 {4 * 52.5* 3 : 10 {4 2:1 : 10 {4<br />
kb; 9:98 : 10 {5 1:13 : 10 {4 1:13 : 10 {4 1:13 : 10 {4<br />
kb<strong>in</strong> 0.0549 0.0549 0.0549 0.0549<br />
kbout 0.135 0.135 0.135 0.135<br />
kA: 9:3 : 10 {5 9:9 : 10 {5 2 : 10 {4 4 : 10 {4<br />
Parameters used <strong>in</strong> our model <strong>for</strong> the different <strong>in</strong> silico experiments. Sets 1 and 2 are the results of the parameter fitt<strong>in</strong>g experiments compar<strong>in</strong>g to the Lee model and<br />
our experimental data, respectively. Sets 3 and 4 are obta<strong>in</strong>ed from our stochastic and our cell cycle <strong>in</strong>vestigation, respectively. All rate constants are <strong>in</strong> m<strong>in</strong> {1 but the<br />
ones <strong>in</strong>dicated by ‘‘*’’: the determ<strong>in</strong>istic values of kb: are given <strong>in</strong> nmol : L {1: m<strong>in</strong> {1 , and the determ<strong>in</strong>istic values of kbY are given <strong>in</strong> L : m<strong>in</strong> {1: nmol {1 .<br />
doi:10.1371/journal.pone.0042792.t003<br />
PLOS ONE | www.plosone.org 5 August 2012 | Volume 7 | Issue 8 | e42792
Figure 3. Comparison of b-<strong>caten</strong><strong>in</strong> <strong>dynamics</strong> between our core<br />
model and the Lee model. Time-dependent response of b-<strong>caten</strong><strong>in</strong><br />
under transient Wnt signal (W(t)~exp({0:133 : t=20) <strong>in</strong>troduced <strong>in</strong>to<br />
the system at the steady-state, at t~0). The <strong>dynamics</strong> of total <strong>in</strong> the and<br />
of nuclear b-<strong>caten</strong><strong>in</strong> (bnuc) <strong>in</strong> our core model are correspond<strong>in</strong>g.<br />
Simulations of the Lee model are per<strong>for</strong>med through the JWS plat<strong>for</strong>m<br />
[55].<br />
doi:10.1371/journal.pone.0042792.g003<br />
means <strong>in</strong> particular that we implicitly assume a synchronized<br />
RVM cell population w.r.t. the cell cycle.<br />
The results of our experiment are provided <strong>in</strong> Table 3, Set 2.<br />
Whereas <strong>in</strong>itial species values rema<strong>in</strong> as be<strong>for</strong>e, the values of most<br />
rate constants are adjusted. In particular, the value of the rate<br />
constant of Ax<strong>in</strong>-dependent b-<strong>caten</strong><strong>in</strong> degradation (kbY) shows a<br />
significant <strong>in</strong>crease (see the section on stochastic <strong>in</strong>vestigations <strong>for</strong><br />
further details).<br />
In Figure 4, results of simulation experiments with the obta<strong>in</strong>ed<br />
parameters are provided. We obta<strong>in</strong> a good fit to the first <strong>in</strong>crease<br />
<strong>in</strong> our data. Moreover, after two hours of differentiation, bnuc<br />
rema<strong>in</strong>s constant and no second <strong>in</strong>crease can be observed.<br />
Stochastic effects due to low Ax<strong>in</strong>P amounts<br />
In this section, we report on stochastic fluctuations <strong>in</strong> the<br />
<strong>dynamics</strong> of our model that contradict our wet-lab observations.<br />
Figure 4. Model evaluation <strong>in</strong> comparison to the experimental<br />
data. Comparison of the model time course to the experimental data<br />
<strong>for</strong> nuclear b-<strong>caten</strong><strong>in</strong> <strong>dynamics</strong>. The simulation data fit the experimental<br />
ones <strong>for</strong> the first 2 hours.<br />
doi:10.1371/journal.pone.0042792.g004<br />
We show that these fluctuations directly result from the low Ax<strong>in</strong><br />
amounts as suggested by the Lee model [23] rather than from our<br />
specific choices of parameter values. This study requires a<br />
trans<strong>for</strong>mation of the concentrations and k<strong>in</strong>etic rate constants<br />
<strong>in</strong> Table 3 (Set 2) <strong>in</strong>to molecule numbers and stochastic rate<br />
constants, follow<strong>in</strong>g, e.g. [39], (Table 3, Set 3).<br />
The stochastic fluctuations <strong>in</strong> the b-<strong>caten</strong><strong>in</strong> <strong>dynamics</strong> result<strong>in</strong>g<br />
from Parameter Set 3 are shown <strong>in</strong> Figures 5A, 5B. These figures<br />
present the amount of bnuc and AixnP molecules over time <strong>in</strong><br />
absence of Wnt signal, as the result of a s<strong>in</strong>gle simulation run.<br />
Large fluctuations <strong>in</strong> the bnuc amounts can be observed that were<br />
not visible <strong>in</strong> the determ<strong>in</strong>istic <strong>in</strong>vestigations of the previous<br />
section. Along with the fluctuations, we see only small differences<br />
<strong>in</strong> the number of AixnP, which underl<strong>in</strong>es the high impact of<br />
AixnP changes on the bnuc <strong>dynamics</strong>. This impact results from a<br />
comparatively high rate of AixnP-dependent b-<strong>caten</strong><strong>in</strong> degradation<br />
(kbY) that is necessary to fit our experimental data. The<br />
stochastic fluctuations contradict our <strong>in</strong> vitro results, s<strong>in</strong>ce they do<br />
not allow <strong>for</strong> a clear transient peak of bnuc <strong>in</strong> response to the Wnt<br />
signal (not shown).<br />
In order to exclude that these stochastic fluctuations are the<br />
result of our specific choice of parameter values, we explored<br />
different strategies to change parameter values <strong>in</strong> order to lower<br />
stochastic effects and at the same time to ma<strong>in</strong>ta<strong>in</strong> the amounts of<br />
AixnP and the average behavior of the model w.r.t. bnuc<br />
<strong>dynamics</strong>.<br />
An obvious solution would be to decrease the rate constant of<br />
AixnP-dependent b-<strong>caten</strong><strong>in</strong> degradation (kbY) and ma<strong>in</strong>ta<strong>in</strong><strong>in</strong>g<br />
the b-<strong>caten</strong><strong>in</strong> level by simultaneously decreas<strong>in</strong>g the flux of bcyt<br />
production (kb:). However, simulation experiments showed that<br />
already through small changes of this sort, the amount of bnuc is<br />
prevented from <strong>in</strong>creas<strong>in</strong>g <strong>in</strong> response to Wnt signal (results not<br />
shown).<br />
Only one other parameter modification strategy seems to be<br />
plausible to us: to deploy the <strong>in</strong>ertia of b-<strong>caten</strong><strong>in</strong> react<strong>in</strong>g on<br />
changes <strong>in</strong> AixnP amounts. S<strong>in</strong>ce the amount of b-<strong>caten</strong><strong>in</strong> is<br />
relatively high, observable changes due to differences <strong>in</strong> AixnP<br />
amounts can only take place with a certa<strong>in</strong> delay. The amount of<br />
AixnP is impacted only by its decay (kAP; ) and its de-/<br />
phosphorylation (kAP?A, kA?AP<br />
). Instead of <strong>in</strong>creas<strong>in</strong>g one of<br />
the correspond<strong>in</strong>g rate constants separately, which would result <strong>in</strong><br />
a change <strong>in</strong> the overall amount of AixnP, one can <strong>in</strong>crease the<br />
rate constants <strong>for</strong> de-/phosphorylation simultaneously. Figures 5C,<br />
5D show the results when <strong>in</strong>creas<strong>in</strong>g the rate constants <strong>for</strong><br />
dephosphorylation (kAP?A) by about 1000 times and the one <strong>for</strong><br />
phosphorylation (kA?AP<br />
b-Caten<strong>in</strong> Dynamics Human Neural Progenitor Cells<br />
) accord<strong>in</strong>gly. Changes <strong>in</strong> AixnP numbers<br />
happen much faster. However, although they are lower, the<br />
stochastic fluctuations <strong>in</strong> the bnuc <strong>dynamics</strong> are still too high.<br />
Rais<strong>in</strong>g the dephosphorylation rate (kAP?A) even more seems not<br />
plausible to us, s<strong>in</strong>ce then changes on the few AixnP molecules<br />
happen <strong>in</strong> periods of milliseconds.<br />
We are there<strong>for</strong>e conv<strong>in</strong>ced that <strong>in</strong> our model with low AixnP<br />
level, as derived from the Lee model, stochastic fluctuations <strong>in</strong> the<br />
bnuc level cannot be limited to fit our experimental data. As<br />
additional support <strong>for</strong> this statement, we also provide an Sbml<br />
version of our model <strong>in</strong> the supplementary material (Model S1).<br />
Our results may <strong>in</strong>dicate on one hand that our RVM cells<br />
conta<strong>in</strong> higher amounts of Ax<strong>in</strong> than suggested <strong>for</strong> the Xenopus<br />
oocyte by [23]. This is supported by the recent work of Tan and<br />
colleagues [40] as they report that mammalian cells have a higher<br />
Ax<strong>in</strong> concentration than the Xenopus extract and that yet b-<strong>caten</strong><strong>in</strong><br />
concentrations rema<strong>in</strong> higher than Ax<strong>in</strong> concentration. Notice,<br />
however, that <strong>in</strong> prior wet-lab experiments, we failed to detect<br />
Ax<strong>in</strong>. On the other hand, our model and thus our understand<strong>in</strong>g<br />
PLOS ONE | www.plosone.org 6 August 2012 | Volume 7 | Issue 8 | e42792
Figure 5. Effects of Ax<strong>in</strong>P on b-<strong>caten</strong><strong>in</strong> <strong>dynamics</strong> accord<strong>in</strong>g to stochastic simulation. In absence of Wnt signal, small variations of Ax<strong>in</strong>P<br />
(A) <strong>in</strong>fluence bnuc <strong>dynamics</strong> (B) lead<strong>in</strong>g to high variance. Increase of kAP?A and kA?AP by 1000 accelerate Ax<strong>in</strong>P changes (C), but bnuc fluctuations<br />
still rema<strong>in</strong> too high (D). Each plot represents a s<strong>in</strong>gle simulation run.<br />
doi:10.1371/journal.pone.0042792.g005<br />
of the system may miss an important mechanism to reduce<br />
stochastic noise, such as dimerization [41,42] or additional<br />
feedback loops [43].<br />
As a basis <strong>for</strong> our subsequent <strong>in</strong>vestigations, we per<strong>for</strong>med<br />
additional parameter fitt<strong>in</strong>g experiments, thereby stepwise <strong>in</strong>creas<strong>in</strong>g<br />
the amount of AixnP and Aixn. As a result, we found a<br />
parameter set with acceptable stochastic fluctuations at an <strong>in</strong>itial<br />
amount of AixnP of 125, see Table 3, Set 3. In Figure 6A, the<br />
<strong>dynamics</strong> of bnuc <strong>for</strong> 10 simulation runs are shown, where the<br />
Wnt signal is switched off (Wnt = 0). One can see that the<br />
fluctuations <strong>in</strong> bnuc levels have been effectively decreased. The ttest<br />
provides that at the time po<strong>in</strong>t of maximum deviation (ca.<br />
426 m<strong>in</strong>utes), the mean value of bnuc numbers <strong>in</strong> the 10<br />
simulation runs lies <strong>in</strong> the <strong>in</strong>terval of +254:13 (ca. 5.5% of the<br />
simulated mean value) around the simulated mean value with a<br />
confidence of 95%. Figure 6B shows the <strong>dynamics</strong> of bnuc <strong>for</strong> 10<br />
simulation runs when the Wnt signal is switched on. We observe <strong>in</strong><br />
our simulation a transient peak with<strong>in</strong> the standard deviation of<br />
the experimental data.<br />
Impact of the Cell Cycle on b-<strong>caten</strong><strong>in</strong> <strong>dynamics</strong> <strong>in</strong> RVM cells<br />
In this section, we show that <strong>in</strong> the results of wet-lab<br />
experiments, the impact of the cell cycle on the average <strong>dynamics</strong><br />
of b-<strong>caten</strong><strong>in</strong> <strong>in</strong> RVM cell populations can be neglected.<br />
b-Caten<strong>in</strong> Dynamics Human Neural Progenitor Cells<br />
The idea of extend<strong>in</strong>g our model to represent asynchronous cell<br />
populations is to consider a number of copies of our core model,<br />
each represent<strong>in</strong>g an <strong>in</strong>dividual cell. Follow<strong>in</strong>g [12], cells have to<br />
first complete the cell cycle be<strong>for</strong>e they can process the Wnt signal.<br />
As <strong>for</strong> our previous model Wnt is not produced and decays<br />
overtime. However, we assign an <strong>in</strong>dividual delay to the start time<br />
of Wnt degradation (kW;) and Wnt-dependent Ax<strong>in</strong> dephosphorylation<br />
(kAP[A) of each cell that represents the cell delay to exit the<br />
cell cycle. That is the correspond<strong>in</strong>g reactions r1 and r2 are<br />
ensured not to happen be<strong>for</strong>e a fixed time po<strong>in</strong>t has passed. Cells,<br />
which are already <strong>in</strong> the G1 phase at the beg<strong>in</strong>n<strong>in</strong>g of a simulation<br />
experiment, i.e., at time po<strong>in</strong>t 0 hour, start to per<strong>for</strong>m their<br />
reactions without any delay. Notice that, s<strong>in</strong>ce each cell has its own<br />
pool of Wnt and also reaction r1 is delayed <strong>for</strong> each cell<br />
<strong>in</strong>dividually, we assume self-<strong>in</strong>duced signal<strong>in</strong>g to happen <strong>in</strong> an<br />
autocr<strong>in</strong>e fashion. The <strong>in</strong>tegration of delays <strong>in</strong>to our stochastic<br />
model is described <strong>in</strong> the Materials & Methods Section.<br />
Cell cycle states are assigned to cells follow<strong>in</strong>g the distribution of<br />
cells over the cycle phases as obta<strong>in</strong>ed from experiments (see<br />
Figure 2 <strong>in</strong> [12] and details <strong>in</strong> Materials & Methods). For example,<br />
<strong>in</strong> a population of n cells, 0:23 n cells are assigned to state S.<br />
Potential round<strong>in</strong>g problems are solved by randomly assign<strong>in</strong>g<br />
states to rema<strong>in</strong><strong>in</strong>g cells with probabilities to be <strong>in</strong> certa<strong>in</strong> states<br />
follow<strong>in</strong>g our experimental data. Notice that we do not separate<br />
PLOS ONE | www.plosone.org 7 August 2012 | Volume 7 | Issue 8 | e42792
Figure 6. Nuclear b-<strong>caten</strong><strong>in</strong> <strong>dynamics</strong> with higher number of<br />
Ax<strong>in</strong>P. (A) In absence of Wnt signal. (B) Under transient Wnt signal. The<br />
plots represent 10 simulation runs.<br />
doi:10.1371/journal.pone.0042792.g006<br />
G2 and M phases. The delay <strong>for</strong> each cell is computed <strong>in</strong> the<br />
follow<strong>in</strong>g way: cells are assumed to be equally distributed over<br />
their respective states. That is, to a cell <strong>in</strong> state G2=M a delay<br />
t~k d G2=M is assigned, where k is equally distributed <strong>in</strong> ½0,1Š<br />
and d G2=M is the duration of phase G2. Similarly, s<strong>in</strong>ce each cell <strong>in</strong><br />
state S has to additionally pass state G2, the delay of a cell <strong>in</strong> state<br />
S is given by t’~d G2=Mzk dS, with d G2=M be<strong>in</strong>g the duration of<br />
phase G2=M. The duration of each cell cycle phase is obta<strong>in</strong>ed<br />
from literature [10,44] (details <strong>in</strong> Materials & Methods).<br />
We per<strong>for</strong>med simulation experiments with the parameters <strong>in</strong><br />
Table 3, Set 3, as obta<strong>in</strong>ed from our stochastic <strong>in</strong>vestigation. In<br />
Figure 7A, the sum of the number of bnuc (nuclear b-<strong>caten</strong><strong>in</strong>) <strong>for</strong> a<br />
s<strong>in</strong>gle simulation run with 100 cells is presented. Similar to the<br />
results of the previous section (Figure 6B), we observe a s<strong>in</strong>gle<br />
transient <strong>in</strong>crease. This, however, shows only a value about 1.28<br />
<strong>in</strong>stead of 1.48, i.e., we obta<strong>in</strong> only 86% of the expected amount.<br />
The reason is that, follow<strong>in</strong>g our experimental data on the cell<br />
cycle <strong>in</strong> RVM cells, the b-<strong>caten</strong><strong>in</strong> amounts <strong>in</strong> most of the cells<br />
<strong>in</strong>itially dedicated to the cell cycle, does not start to <strong>in</strong>crease be<strong>for</strong>e<br />
30 m<strong>in</strong>utes, i.e., after the time of the first peak is over. Thus, only<br />
about 60% of the cells contribute to the first peak, result<strong>in</strong>g <strong>in</strong> the<br />
limited <strong>in</strong>crease.<br />
As mentioned earlier fitt<strong>in</strong>g experiments to obta<strong>in</strong> the parameters<br />
(Table 3, Set 3) implicitly assume that cells are homoge-<br />
b-Caten<strong>in</strong> Dynamics Human Neural Progenitor Cells<br />
neously distributed over the cell cycle as we compared the<br />
behavior of s<strong>in</strong>gle cells, i.e., one <strong>in</strong>stance of our core model, with<br />
the average behavior of entire cell populations as observed <strong>in</strong><br />
experiments. Thus, the results of our simulation experiments imply<br />
that this assumption is not feasible and that when model<strong>in</strong>g the<br />
Wnt/b-<strong>caten</strong><strong>in</strong> pathway <strong>in</strong> RVM cells, the cells’ commitment to<br />
the cell cycle may need to be considered.<br />
We present an additional parameter set to fit the first <strong>in</strong>crease <strong>in</strong><br />
our experimental data with the simulation data <strong>in</strong> asynchronous cell<br />
populations (see Table 3, set 4). Only a few parameters are<br />
adjusted, as compared to the previous one. Correspond<strong>in</strong>g<br />
simulation results are presented <strong>in</strong> Figure 7B. It can be seen that<br />
with the new parameter set, the first <strong>in</strong>crease of nuclear b-<strong>caten</strong><strong>in</strong><br />
is well-fitted. Furthermore, no other <strong>in</strong>crease than the first one can<br />
be observed <strong>in</strong> our simulation results.<br />
Our simulation results <strong>in</strong>dicate that when study<strong>in</strong>g the Wnt<br />
pathway <strong>in</strong> RVM cell populations by wet-lab experiments the<br />
impact of the cell cycle on the average b-<strong>caten</strong><strong>in</strong> <strong>dynamics</strong> can be<br />
neglected. No significant changes occur other than the <strong>in</strong>crease<br />
caused by Wnt pathway activation. In particular, the second<br />
<strong>in</strong>crease <strong>in</strong> the experimental data shows not to be a result of the<br />
cells’ asynchrony. The reason <strong>for</strong> this becomes obvious when<br />
look<strong>in</strong>g at the <strong>dynamics</strong> of b-<strong>caten</strong><strong>in</strong> <strong>for</strong> each cell separately, as<br />
presented <strong>in</strong> Figure 7C. Although, all the cells, which are <strong>in</strong>itially<br />
dedicated to the cell cycle, start their b-<strong>caten</strong><strong>in</strong> <strong>in</strong>crease<br />
comparatively late, they do not per<strong>for</strong>m it simultaneously but<br />
rather widely distributed over time (between 0.5 and 10 hours).<br />
Thus, summ<strong>in</strong>g up over all cells, the <strong>in</strong>dividual peaks only lead to<br />
small deviations. It is important to notice here that this observation<br />
is rather <strong>in</strong>dependent from the particular design decisions of our<br />
model but results ma<strong>in</strong>ly from the distribution of RVM cells over<br />
the cell cycle as it is obta<strong>in</strong>ed experimentally and from the basic<br />
knowledge about the Wnt/b-<strong>caten</strong><strong>in</strong> pathway as represented <strong>in</strong><br />
our model.<br />
Self-<strong>in</strong>duced Wnt signal<strong>in</strong>g<br />
In this section, we provide new evidence <strong>for</strong> the hypothesis that<br />
the b-<strong>caten</strong><strong>in</strong> <strong>dynamics</strong> from 8 hours on after the start of<br />
differentiation arises from a second wave of Wnt signal that could<br />
be self-<strong>in</strong>duced. This hypothesis is <strong>in</strong> the l<strong>in</strong>es with our previous<br />
study [12] list<strong>in</strong>g various <strong>in</strong>dicators from wet lab experiments <strong>for</strong><br />
late self-<strong>in</strong>duced Wnt signal<strong>in</strong>g. Among these are an <strong>in</strong>crease of<br />
Ax<strong>in</strong>, Wnt ligands, and receptor gene expression, as well as an<br />
accumulation of the pathway’s <strong>in</strong>tracellular prote<strong>in</strong>s dur<strong>in</strong>g cell<br />
differentiation without addition of external Wnt signal (see also this<br />
article’s <strong>in</strong>troduction). Notice that the goal here is not to expla<strong>in</strong><br />
the detailed underly<strong>in</strong>g mechanisms of self-<strong>in</strong>duced Wnt signal<strong>in</strong>g,<br />
but rather to explore whether our experimental data actually<br />
suggest that such a process may occur <strong>in</strong> RVM cell populations. In<br />
particular, we leave possible spatial extensions to our model to<br />
dist<strong>in</strong>ct autocr<strong>in</strong>e from paracr<strong>in</strong>e signal<strong>in</strong>g as subject to future<br />
work and consider only autocr<strong>in</strong>e signal<strong>in</strong>g here.<br />
To model self-<strong>in</strong>duced Wnt signal<strong>in</strong>g, we extend our model with<br />
a s<strong>in</strong>gle reaction of Wnt production represent<strong>in</strong>g the overall<br />
process <strong>in</strong> a very abstract way. This reaction occurs with a given<br />
delay after cells exit the cell cycle. The delay is to reflect the time<br />
necessary to <strong>in</strong>duce the signal. It is implemented <strong>in</strong> the same way<br />
as the one <strong>for</strong> the cell cycle reaction (details <strong>in</strong> Materials &<br />
Methods section). Once the delay is over, cells cont<strong>in</strong>uously<br />
produce Wnt molecules with rate constant kW:~0:05 m<strong>in</strong> {1 ,<br />
each <strong>for</strong> themselves (autocr<strong>in</strong>e signal<strong>in</strong>g).<br />
We per<strong>for</strong>med a simulation experiment with a cell population of<br />
100 cells and a Wnt <strong>in</strong>duction delay of 150 m<strong>in</strong>utes (2.5 hours).<br />
Such value <strong>for</strong> the delay is plausible, s<strong>in</strong>ce our Wnt-produc<strong>in</strong>g<br />
PLOS ONE | www.plosone.org 8 August 2012 | Volume 7 | Issue 8 | e42792
eaction encompasses various biological processes, i.e., gene<br />
transcription of Wnt molecules, their subsequent <strong>in</strong>tracellular<br />
traffick<strong>in</strong>g, post-translational modifications [45], secretion of Wnt<br />
<strong>in</strong> the extracellular environment, and its b<strong>in</strong>d<strong>in</strong>g to the cell<br />
receptors.<br />
In Figure 7D, the results of a s<strong>in</strong>gle simulation run are<br />
presented. The first peak of bnuc is still fitt<strong>in</strong>g the experimental<br />
data. Furthermore, the simulation data at the other time po<strong>in</strong>ts,<br />
i.e., 3, 4, 8, and 12 hours, are also fitt<strong>in</strong>g the experimental ones.<br />
S<strong>in</strong>ce the previous variants of the model failed to reproduce the<br />
biphasic k<strong>in</strong>etics of nuclear b-<strong>caten</strong><strong>in</strong>, our results suggest that self<strong>in</strong>duced<br />
Wnt signal<strong>in</strong>g is responsible of such <strong>dynamics</strong> and occurs<br />
<strong>in</strong> RVM cells dur<strong>in</strong>g differentiation from 2.5 to 12 hours.<br />
It should be noticed here that the <strong>in</strong>vestigations of Wnt<br />
production <strong>in</strong> RVM cells at 3, 6, and 24 hours of differentiation<br />
shows only <strong>for</strong> the latter time po<strong>in</strong>t an <strong>in</strong>crease of Wnt mRNA<br />
level (mRNA of Wnt5a and Wnt7a) [11,12]. These observations<br />
are, however, not necessarily <strong>in</strong> contradiction to the hypothesis of<br />
self-<strong>in</strong>duced signal<strong>in</strong>g whit<strong>in</strong> the first hours of cell differentiation.<br />
On one hand, without measurements of <strong>in</strong>termediate time po<strong>in</strong>ts,<br />
b-Caten<strong>in</strong> Dynamics Human Neural Progenitor Cells<br />
Figure 7. Dynamics of nuclear b-<strong>caten</strong><strong>in</strong> <strong>in</strong> heterogeneous cell population. A population of 100 cells is simulated. (A, B, and D) represent the<br />
sum of nuclear <strong>in</strong> b-<strong>caten</strong><strong>in</strong> 100 cells as compared to the experimental data. (C) represents the number of nuclear b-<strong>caten</strong><strong>in</strong> <strong>in</strong> each cell <strong>in</strong>dividually<br />
<strong>for</strong> a population of 100 cells. (A) The total cell population is analyzed. The simulation data do not correlate with the experimental ones. (B) The cell<br />
population asynchrony toward the cell cycle does not give rise to a second <strong>in</strong>crease of nuclear b-<strong>caten</strong><strong>in</strong> after 2 hours. (C) S<strong>in</strong>gle cell analysis shows<br />
the delay <strong>in</strong> b-<strong>caten</strong><strong>in</strong> <strong>dynamics</strong> due to the cell cycle asynchrony. (D) The addition of a cont<strong>in</strong>uous and autocr<strong>in</strong>e Wnt signal to the previous<br />
experimental sett<strong>in</strong>g produces simulation data <strong>in</strong> perfect agreement to the experimental ones. (A, C) Parameters used are given <strong>in</strong> Table 3 (Set 3). (B,<br />
D) Parameters used <strong>for</strong> both experiments are given <strong>in</strong> Table 3 (Set 4).<br />
doi:10.1371/journal.pone.0042792.g007<br />
Wnt production could start as soon as 8 hours. On the other hand,<br />
even without an <strong>in</strong>crease <strong>in</strong> the Wnt mRNA level, self-<strong>in</strong>duced<br />
signal<strong>in</strong>g could occur. It is known that Wnt molecules are<br />
produced <strong>in</strong> the cell and are subsequently stored <strong>in</strong> cytosolic<br />
vesicles that can then fuse with the membrane <strong>in</strong> order to release<br />
Wnt molecules outside of the cell, <strong>in</strong>duc<strong>in</strong>g signal<strong>in</strong>g [46]. Thus,<br />
the self-<strong>in</strong>duced Wnt signal<strong>in</strong>g can result not only from a constant<br />
production and secretion dur<strong>in</strong>g RVM cell differentiation but also<br />
from an anticipated production of Wnt molecules followed by a<br />
vesicle storage and a delayed cont<strong>in</strong>uous secretion dur<strong>in</strong>g<br />
differentiation. Clarification on this po<strong>in</strong>t could be achieved by<br />
further <strong>in</strong> vitro experiments, based, e.g., on a constant <strong>in</strong>hibition of<br />
the Wnt/b-<strong>caten</strong><strong>in</strong> pathway, <strong>in</strong> particular with Dickkopf 1, Mesd,<br />
or Porcup<strong>in</strong> [46–48], followed by k<strong>in</strong>etic analysis of nuclear b<strong>caten</strong><strong>in</strong><br />
between 2 and 12 hours of differentiation.<br />
Furthermore, the occurrence of crosstalk rema<strong>in</strong>s to be a valid<br />
alternative to the hypothesis of self-<strong>in</strong>duced Wnt signal<strong>in</strong>g.<br />
Previous works show that dur<strong>in</strong>g nervous system development<br />
[49,50], although not dur<strong>in</strong>g neural differentiation <strong>in</strong> particular,<br />
crosstalks occur between the Wnt/b-<strong>caten</strong><strong>in</strong> pathway and other<br />
PLOS ONE | www.plosone.org 9 August 2012 | Volume 7 | Issue 8 | e42792
pathways, among which are the Ryk [35], Notch [36], and<br />
extracellular signal regulated-k<strong>in</strong>ase (ERK) pathways [51]. There<strong>for</strong>e,<br />
to f<strong>in</strong>ally answer the question of self-<strong>in</strong>duced Wnt signal<strong>in</strong>g <strong>in</strong><br />
human neural progenitor cells, further <strong>in</strong> vitro or <strong>in</strong> silico<br />
<strong>in</strong>vestigations are required.<br />
Materials and Methods<br />
b-<strong>caten</strong><strong>in</strong> Western-blott<strong>in</strong>g<br />
Western-blots were per<strong>for</strong>med accord<strong>in</strong>g to the protocol<br />
described previously <strong>in</strong> [10]. Visualization and quantification of<br />
b-<strong>caten</strong><strong>in</strong> were per<strong>for</strong>med us<strong>in</strong>g the Odyssey Infrared Imag<strong>in</strong>g<br />
System (LI-COR Biosciences GmbH, Bad Homburg, Germany).<br />
For the purpose of quantification, time-series samples were loaded<br />
onto the gel <strong>in</strong> a randomized and non-chronological order to<br />
reduce systematic errors [52]. Expression of b-act<strong>in</strong> prote<strong>in</strong> was<br />
used as a load<strong>in</strong>g control to normalize the expression of b-<strong>caten</strong><strong>in</strong>.<br />
Thereby relative expression levels of b-<strong>caten</strong><strong>in</strong> prote<strong>in</strong>s were<br />
determ<strong>in</strong>ed. For each quantified Western-blot, the relative<br />
expression at a given time po<strong>in</strong>t is normalized to the mean of<br />
the time series. Normalization is per<strong>for</strong>med <strong>for</strong> each experiment<br />
separately, as the raw data obta<strong>in</strong>ed <strong>for</strong> each Western-blot are not<br />
absolute values. For each time po<strong>in</strong>t, the mean of all experiments<br />
is computed. Thus, the values observed <strong>in</strong> Figure 1 show the mean<br />
of 26 experiments (9 cell cultures with 2 to 3 Western-blots<br />
per<strong>for</strong>med <strong>for</strong> each cell culture) <strong>for</strong> the time po<strong>in</strong>ts 0, 0.5, 1, 3, 8,<br />
24, and 48 hours, and the mean of 11 experiments (4 cell cultures<br />
with 2 to 3 Western-blots per<strong>for</strong>med <strong>for</strong> each cell culture) <strong>for</strong> the<br />
other time po<strong>in</strong>ts 2, 4, 12, and 72 hours. Statistical evaluation was<br />
carried out us<strong>in</strong>g the Mann-Whitney test. An <strong>in</strong>crease was<br />
considered to be statistically significant when the p-value ƒ0:05<br />
( pƒ0:05, pƒ0:01, and pƒ0:001) as compared to control<br />
(time po<strong>in</strong>t 0 hour). The values of the mean and the standard error<br />
of the mean were rescaled to the mean at time po<strong>in</strong>t 0 hour which<br />
is set to 1.0.<br />
Cell volume determ<strong>in</strong>ation<br />
Data on compartment volumes is a prerequisite <strong>for</strong> calculat<strong>in</strong>g<br />
stochastic parameters as the reaction speed is dependent on the<br />
probability of molecules to collide. As the cell volume and thus the<br />
compartment volumes might change along cell differentiation, the<br />
volume measurement is restricted to proliferat<strong>in</strong>g RVM cells, as at<br />
this stage their general shape is regular, follow<strong>in</strong>g a cobble-stone<br />
pattern [3]. The global volume of proliferat<strong>in</strong>g RVM cells was<br />
determ<strong>in</strong>ed us<strong>in</strong>g the electric cell counter CASYH (Innovatis AG,<br />
Germany) which uses impedance technique. The RVM cells were<br />
cultivated accord<strong>in</strong>g to the protocol described previously <strong>in</strong> [10].<br />
The cells were detached from the coated cell culture flask T75 with<br />
addition of Tryps<strong>in</strong>-Benzonase solution (2.5 ml/flask) followed by<br />
tryps<strong>in</strong>-<strong>in</strong>hibition solution (5 ml/flask). As the solutions are<br />
isotonic they do not cause cell volume changes. In presence of<br />
Tryps<strong>in</strong>, RVM cells are <strong>in</strong> nearly spherical shape with<strong>in</strong> the<br />
solution suspension. This condition is necessary and sufficient <strong>for</strong><br />
the device CASYH to retrieve the mean volume of the cells<br />
analyzed <strong>in</strong> the sample. Cell suspension (25 ml) was diluted <strong>in</strong><br />
10 ml of CasyTon buffer and analyzed by CASYH. The analysis<br />
results conta<strong>in</strong> the mean volume of the spherical cells pass<strong>in</strong>g<br />
through the capillary. Thus, given 79 cell samples, from cell<br />
passage 9 to 27, the average volume of RVM cells is<br />
VVM~1:365 : 10 z3 +0:0495 fl. To obta<strong>in</strong> the compartment volumes,<br />
the average area of the cytosol and nucleus <strong>in</strong> proliferat<strong>in</strong>g<br />
cells, was measured via microscopy. The cytosol represents an<br />
average of 64% of the cell surface, whereas the nucleus represents<br />
26% of the cell surface. These values were considered to hold true<br />
b-Caten<strong>in</strong> Dynamics Human Neural Progenitor Cells<br />
<strong>for</strong> the volume proportions, lead<strong>in</strong>g to:<br />
Vcyto~0:64 : 1:365 : 10 z3 ~0:873 : 10 z3 fl~8:73 : 10 {16 m 3 ,<br />
Vnucl~0:26 : 1:365 : 10 z3 ~0:355 : 10 z3 fl~3:55 : 10 {16 m 3 :<br />
Duration and distribution of cell cycle phases<br />
The duration of the RVM cell cycle is given <strong>in</strong> [10] with a<br />
doubl<strong>in</strong>g time of 19.8+0.6 hours (ca. 1188 m<strong>in</strong>utes). In order to<br />
estimate the duration of each phase, we took reference values from<br />
[44] that describes a relative duration of 50% <strong>for</strong> G1, 33.3% <strong>for</strong> S,<br />
and 16.7% <strong>for</strong> G2/M of the cell cycle entire duration <strong>in</strong><br />
mammalian cells. Thus, the delay <strong>for</strong> the G2/M phase amounts<br />
to d G2=M~0:167 1188~198:396 m<strong>in</strong>utes and <strong>for</strong> the S phase to<br />
dS~395:604 m<strong>in</strong>utes. The amount of RVM cells committed <strong>in</strong><br />
the cell cycle was retrieved experimentally as described <strong>in</strong> [12].<br />
Around 20% of RVM cells are <strong>in</strong> G2 phase and around 23% <strong>in</strong> S<br />
phase when differentiation is <strong>in</strong>duced (time po<strong>in</strong>t 0 hour).<br />
Parameter estimation & simulation<br />
Parameter estimation <strong>for</strong> the unknown values of rate constants<br />
and species amount was done us<strong>in</strong>g COPASI [53]. The method<br />
chosen is Hooke & Jeeves [54]. Estimation experiments were<br />
supported by sensitivity analysis available <strong>in</strong> the supplementary<br />
material (Text S1). The Lee model simulations were per<strong>for</strong>med us<strong>in</strong>g<br />
the onl<strong>in</strong>e tool JWS Onl<strong>in</strong>e [55]. Determ<strong>in</strong>istic simulations were<br />
also done with the tool COPASI [53] us<strong>in</strong>g the determ<strong>in</strong>istic<br />
LSODA method. Stochastic simulations were per<strong>for</strong>med us<strong>in</strong>g a<br />
small extension of the stochastic simulation algorithm, the version<br />
presented <strong>in</strong> [56], that allows to directly reflect normally<br />
distributed delays (see paragraph below). We implemented this<br />
extension and per<strong>for</strong>med stochastic simulation experiments based<br />
on the model<strong>in</strong>g and simulation framework JamesII [57].<br />
Model<strong>in</strong>g delays<br />
We used the follow<strong>in</strong>g approach to model delays: <strong>for</strong> each delay<br />
d a species S and a reaction r : 1 ? d S is <strong>in</strong>troduced. Initially, the<br />
amount of S is set to 0. Reaction r produces a s<strong>in</strong>gle <strong>in</strong>stance of S<br />
to denote the end of the delay. Reactions, which are supposed not<br />
to happen be<strong>for</strong>e the delay has ended, are equipped with an<br />
additional reactant and product of species S, e.g., reaction<br />
r : A ? kB<br />
B is trans<strong>for</strong>med to rB : AzS ? kB<br />
BzS. Notice that<br />
when ensur<strong>in</strong>g that the amount of S is always 1, the rate of<br />
reactions with Mass action k<strong>in</strong>etics is not affected by this<br />
modification. Reaction r cannot be directly mapped to a stochastic<br />
reaction s<strong>in</strong>ce it is required to happen only once and at a time<br />
po<strong>in</strong>t not exponentially distributed, but normally distributed <strong>in</strong><br />
time that denotes the end of delay d. This can be achieved by<br />
us<strong>in</strong>g the next-reaction method [56] version of the stochastic<br />
simulation algorithm [18], which schedules the time po<strong>in</strong>t of each<br />
reaction <strong>in</strong> an event queue. The fir<strong>in</strong>g of a reaction at a fixed time<br />
po<strong>in</strong>t that models the end of a delay can thus be just scheduled as<br />
an additional event. We assumed that the end time po<strong>in</strong>t of a delay<br />
is drawn from a normal distribution on the length of the delay with<br />
a standard deviation of 5%.<br />
Similar ideas to <strong>in</strong>tegrate delays <strong>in</strong>to stochastic models have<br />
already been presented <strong>in</strong> [58]. Alternatively, one can also<br />
approximate events at normally distributed time po<strong>in</strong>ts with sets<br />
of fast <strong>in</strong>termediate reactions [59].<br />
PLOS ONE | www.plosone.org 10 August 2012 | Volume 7 | Issue 8 | e42792
Support<strong>in</strong>g In<strong>for</strong>mation<br />
Model S1 We provide the details of the model <strong>in</strong> Sbml<br />
<strong>for</strong>mat. The parameter values correspond to the ones<br />
found <strong>in</strong> Table 3, Set 2.<br />
(XML)<br />
Text S1 We provide details regard<strong>in</strong>g the parameter<br />
sensitivity analysis.<br />
(PDF)<br />
References<br />
1. L<strong>in</strong>dvall O, Kokaia Z, Mart<strong>in</strong>ez-Serrano A (2004) Stem cell therapy <strong>for</strong> human<br />
neurodegenerative disorders-how to make it work. Nature Medic<strong>in</strong>e 10: S42–<br />
S50.<br />
2. Clelland CD, Barker RA, Watts C (2008) Cell therapy <strong>in</strong> hunt<strong>in</strong>gton disease.<br />
Neurosurgical Focus 24(3–4): E8.<br />
3. Donato R, Miljan EA, H<strong>in</strong>es SJ, Aouabdi S, Pollock K, et al. (2007) Differential<br />
development of neuronal physiological responsiveness <strong>in</strong> two human neural stem<br />
cell l<strong>in</strong>es. BMC Neuroscience 8:36.<br />
4. Wood-Kaczmar A, Gandhi S, Yao Z, Abramov ASY, Miljan EA, et al. (2008)<br />
P<strong>in</strong>k1 is necessary <strong>for</strong> long term survival and mitochondrial function <strong>in</strong> human<br />
dopam<strong>in</strong>ergic neurons. PLoS ONE 3(6): e2455.<br />
5. Le MT, Xie H, Zhou B, Chia PH, Rizk P, et al. (2009) Microrna-125b promotes<br />
neuronal differentiation <strong>in</strong> human cells by repress<strong>in</strong>g multiple targets. Molecular<br />
and Cellular Biology 29(19): 5290–5305.<br />
6. Morgan PJ, Ort<strong>in</strong>au S, Frahm J, Krueger N, Rolfs A, et al. (2009) Protection of<br />
neurons derived from human neural progenitor cells by veratrid<strong>in</strong>e. Neuroreport<br />
20: 1225–1229.<br />
7. Castelo-Branco G, Wagner J, Rodriguez FJ, Kele J, Sousa K, et al. (2003)<br />
Differential regulation of midbra<strong>in</strong> dopam<strong>in</strong>ergic neuron development by wnt-1,<br />
wnt-3a, and wnt-5a. PNAS 100(22): 12747–12752.<br />
8. Michaelidis TM, Lie DC (2008) Wnt signal<strong>in</strong>g and neural stem cells: caught <strong>in</strong><br />
the Wnt web. Cell Tissue Research 331: 193–210.<br />
9. Israsena N, Hu M, Fu W, Kan L, Kessler JA (2004) The presence of FGF2<br />
signal<strong>in</strong>g determ<strong>in</strong>es whether beta-<strong>caten</strong><strong>in</strong> exerts effects on proliferation or<br />
neuronal differentiation of neural stem cells. Developmental Biology 268: 220–<br />
231.<br />
10. Schmöle AC, Brennführer A, Karapetyan G, Jaster R, Pews-Davtyan A, et al.<br />
(2010) Novel <strong>in</strong>dolylmaleimide acts as GSK-3b <strong>in</strong>hibitor <strong>in</strong> human neural<br />
progenitor cells. Bioorganic & Medic<strong>in</strong>al Chemistry 18: 6785–6795.<br />
11. Hübner R, Schmöle AC, Liedmann A, Frech MJ, Rolfs A, et al. (2010)<br />
Differentiation of human neural progenitor cells regulated by Wnt-3a.<br />
Biochemical and Biophysical Research Communications 400: 358–362.<br />
12. Mazemondet O, Hubner R, Frahm J, Koczan D, Bader B, et al. (2011)<br />
Quantitative and k<strong>in</strong>etic profile of Wnt/b-<strong>caten</strong><strong>in</strong> signal<strong>in</strong>g components dur<strong>in</strong>g<br />
human neural progenitor cell differentiation. Cellular & Molecular Biology<br />
Letters 16: 515–538.<br />
13. Lustig B, Jerchow B, Sachs M, Weiler S, Pietsch T, et al. (2002) Negative<br />
feedback loop of wnt signal<strong>in</strong>g through upregulation of conduct<strong>in</strong>/ax<strong>in</strong>2 <strong>in</strong><br />
colorectal and liver tumors. Molecular and Cellular Biology 22(4): 1184–1193.<br />
14. ten Berge D, Kurek D, Blauwkamp T, Koole W, Maas A, et al. (2011)<br />
Embryonic stem cells require Wnt prote<strong>in</strong>s to prevent differentiation to epiblast<br />
stem cells. Nature Cell Biology 13: 1070–1075.<br />
15. Wexler EM, Paucer A, Kornblum HI, Palmer TD, Geschw<strong>in</strong>d DH (2009)<br />
Endogenous Wnt signal<strong>in</strong>g ma<strong>in</strong>ta<strong>in</strong>s neural progenitor cell potency. Stem Cells<br />
27: 1130–1141.<br />
16. Chenn A, Walsh CA (2002) Regulation of cerebral cortical size by control of cell<br />
cycle exit <strong>in</strong> neural precursors. Science 297: 365.<br />
17. Cann<strong>in</strong>g CA, Lee L, Irv<strong>in</strong>g C, Mason I, Jones CM (2007) Sustauned <strong>in</strong>teractive<br />
Wnt and FGF signal<strong>in</strong>g is required to ma<strong>in</strong>ta<strong>in</strong> isthmic identity. Developmental<br />
Biology 305(1): 276–286.<br />
18. Gillespie DT (1977) Exact stochastic simulation of coupled chemical reactions.<br />
Journal of Physical Chemistry 81: 2340–2361.<br />
19. McAdams HH, Ark<strong>in</strong> A (1999) It’s a noisy bus<strong>in</strong>ess! Genetic regulation at the<br />
nanomolar scale. Trends <strong>in</strong> Genetics 15: 65–69.<br />
20. Kholodenko BN (2006) Cell-signall<strong>in</strong>g <strong>dynamics</strong> <strong>in</strong> time and space. Nature<br />
Reviews Molecular Cell Biology 7: 165–176.<br />
21. Wilk<strong>in</strong>son DJ (2009) Stochastic modell<strong>in</strong>g <strong>for</strong> quantitative description of<br />
heterogeneous biological systems. Nature Reviews Genetics 10: 122–133.<br />
22. Wolkenhauer O, Ullah M, Kolch W, Cho KH (2004) Modell<strong>in</strong>g and simulation<br />
of <strong>in</strong>tracellular <strong>dynamics</strong>: Choos<strong>in</strong>g an appropriate framework.<br />
IEEE T Nanobiosci 3: 200–207.<br />
23. Lee E, Salic A, Krüger R, He<strong>in</strong>rich R, Kirschner MW (2003) The roles of apc<br />
and ax<strong>in</strong> derived from experimental and theoretical analysis of the wnt pathway.<br />
PLoS Biol 1: 116–132.<br />
24. Cho KH, Baek S, Sung MH (2006) Wnt pathway mutations selected by optimal<br />
beta-<strong>caten</strong><strong>in</strong> signal<strong>in</strong>g <strong>for</strong> tumorigenesis. FEBS Letters 580: 3665–3670.<br />
Acknowledgments<br />
We would like to thank Tareck Rharass <strong>for</strong> discussions regard<strong>in</strong>g FRAP<br />
experiments and cell volumes, as well as the reviewers, Fiete Haack, and<br />
Hans-Jörg Schulz <strong>for</strong> their valuable comments on the paper.<br />
Author Contributions<br />
b-Caten<strong>in</strong> Dynamics Human Neural Progenitor Cells<br />
Conceived and designed the experiments: OM MJ AU. Per<strong>for</strong>med the<br />
experiments: OM MJ SL. Analyzed the data: OM MJ AR AU.<br />
Contributed reagents/materials/analysis tools: OM MJ SL. Wrote the<br />
paper: OM MJ AU.<br />
25. Wawra C, Kühl M, Kestler HA (2007) Extended analyses of the wnt/beta<strong>caten</strong><strong>in</strong><br />
pathway: Robustness and oscillatory behaviour. FEBS Letters 581:<br />
4043–4048.<br />
26. Mirams GR, Byrne HM, K<strong>in</strong>g JR (2010) A multiple timescale analysis of a<br />
mathematical modelof the wnt/beta-<strong>caten</strong><strong>in</strong> signall<strong>in</strong>g pathway. Journal<br />
Mathematical Biology 60: 131–160.<br />
27. van Leeuwen IM, Byrne HM, Jensen OE, K<strong>in</strong>g JR (2007) Elucidat<strong>in</strong>g the<br />
<strong>in</strong>teractions between the adhesive and transcriptional functions of b-<strong>caten</strong><strong>in</strong> <strong>in</strong><br />
normal and cancerous cells. Journal of Theoretical Biology 247: 77–102.<br />
28. Kofahl B, Wolf J (2010) Mathematical modell<strong>in</strong>g of wnt/b-<strong>caten</strong><strong>in</strong> signall<strong>in</strong>g.<br />
Biochemical Society Transactions 38(5): 1281–1285.<br />
29. Towb<strong>in</strong> H, Staehel<strong>in</strong> T, Gordon J (1979) Electrophoretic transfer of prote<strong>in</strong>s<br />
from polyacrylamide gels to nitrocellulose sheets: Procedure and some<br />
applications. PNAS 76: 4350–4354.<br />
30. Naito AT, Shiojima I, Akazawa H, Hidaka K, Morisaki T, et al. (2006)<br />
Developmental stagespecific biphasic roles of Wnt/b-<strong>caten</strong><strong>in</strong> signal<strong>in</strong>g <strong>in</strong><br />
cardiomyogenesis and hematopoiesis. PNAS 103: 19812–19817.<br />
31. Ueno S, Weid<strong>in</strong>ger G, Osugi T, Kohn AD, Golob JL, et al. (2007) Biphasic role<br />
<strong>for</strong> Wnt/b-<strong>caten</strong><strong>in</strong> signal<strong>in</strong>g <strong>in</strong> cardiac specification <strong>in</strong> zebrafish and embryonic<br />
stem cells. PNAS 104: 9685–9690.<br />
32. Israsena N, Hu M, Fu W, Kan L, Kessler JA (2004) The presence of FGF2<br />
signal<strong>in</strong>g determ<strong>in</strong>es whether b-<strong>caten</strong><strong>in</strong> exerts effects on proliferation or<br />
neuronal differentiation of neural stem cells. Developmental Biology 268:<br />
220–231.<br />
33. Krieghoff E, Behrens J, Mayr B (2006) Nucleo-cytoplasmic distribution of beta<strong>caten</strong><strong>in</strong><br />
is regulated by retention. Journal of Cell Science 119: 1453–1463.<br />
34. Tymchyshyn O, Kwiatkowska M (2008) Comb<strong>in</strong><strong>in</strong>g <strong>in</strong>tra- and <strong>in</strong>ter-cellular<br />
<strong>dynamics</strong> to <strong>in</strong>vestigate <strong>in</strong>test<strong>in</strong>al homeostasis. In: Formal Methods <strong>in</strong> Systems<br />
Biology: First International Workshop, FMSB 2008, Cambridge, UK, June 4–5,<br />
2008, Proceed<strong>in</strong>gs. Spr<strong>in</strong>ger, pp. 63–76.<br />
35. Fradk<strong>in</strong> LG, Dura JM, Noordermeer JN (2010) Ryks: new partners <strong>for</strong> Wnts <strong>in</strong><br />
the develop<strong>in</strong>g and regenerat<strong>in</strong>g nervous system. Trends <strong>in</strong> Neurosciences 33:<br />
84–92.<br />
36. Sethi JK, Vidal-Puig A (2010) Wnt signall<strong>in</strong>g and the control of cellular<br />
metabolism. Biochemical Journal 427: 1–17.<br />
37. Städeli R, Hoffmans R, Basler K (2006) Transcription under the control of<br />
nuclear Arm/b-<strong>caten</strong><strong>in</strong>. Current Biology 16: R378–R385.<br />
38. Schmitz Y, Wolkenhauer O, Rateitschak K (2011) Nucleo-cytoplasmic shuttl<strong>in</strong>g<br />
of apc can maximize b-<strong>caten</strong><strong>in</strong>/TCF concentration. Journal of Theoretical<br />
Biology 279(1): 132–142.<br />
39. Mazemondet O, John M, Maus C, Uhrmacher AM, Rolfs A (2009) Intergrat<strong>in</strong>g<br />
diverse reaction types <strong>in</strong>to stochastic models - a signal<strong>in</strong>g pathway case study <strong>in</strong><br />
the imperative pi-calculus. In: Rossetti MD, Hill RR, Johansson B, Dunk<strong>in</strong> A,<br />
Ingalls RG, editors, Proceed<strong>in</strong>gs of the 2009 W<strong>in</strong>ter Simulation Conference. pp.<br />
932–943.<br />
40. Tan CW, Gard<strong>in</strong>er BS, Hirokawa Y, Layton MJ, Smith DW, et al. (2012) Wnt<br />
signall<strong>in</strong>g pathway parameters <strong>for</strong> mammalian cells. PLoS One 7: e31882.<br />
41. Bundschuh R (2003) The role of dimerization <strong>in</strong> noise reduction of simple<br />
genetic networks. Journal of Theoretical Biology 220: 261–269.<br />
42. Morishita Y (2004) Noise-reduction through <strong>in</strong>teraction <strong>in</strong> gene expression and<br />
biochemical reaction processes. Journal of Theoretical Biology 228: 315–325.<br />
43. Orrell D, Ramsey S, Marelli M, Smith J, Petersen T, et al. (2006) Feedback<br />
control of stochastic noise <strong>in</strong> the yeast galactose utilization pathway. Physica D:<br />
Nonl<strong>in</strong>ear Phenomena 217: 64–76.<br />
44. Alam S, Sen A, Behie LA, Kallos MS (2004) Cell cycle k<strong>in</strong>etics of expand<strong>in</strong>g<br />
populations of neural stem and progenitor cells <strong>in</strong> vitro. Biotechnology and<br />
bioeng<strong>in</strong>eer<strong>in</strong>g 88: 332–347.<br />
45. Lorenowicz MJ, Korswagen HC (2009) Sail<strong>in</strong>g with the wnt: Chart<strong>in</strong>g the wnt<br />
process<strong>in</strong>g and secretion route. Experimental Cell Research 315: 2683–2689.<br />
46. Coudreuse D, Korswagen HC (2007) The mak<strong>in</strong>g of Wnt: new <strong>in</strong>sights <strong>in</strong>to Wnt<br />
maturation, sort<strong>in</strong>g and secretion. Development 134: 3–12.<br />
47. Semënov MV, Tamai H, Brott BK, Kühl M, Sokol S, et al. (2001) Head <strong>in</strong>ducer<br />
Dickkopf-1 is a ligand <strong>for</strong> Wnt coreceptor LRP6. Current Biology 11: 951–961.<br />
48. Lu W, Liu CC, Thottassery JV, Bu G, Liang Y (2010) Mesd is a universal<br />
<strong>in</strong>hibitor of Wnt coreceptors LRP5 and LRP6 and block Wnt/beta-<strong>caten</strong><strong>in</strong><br />
signal<strong>in</strong>g <strong>in</strong> cancer cells. Biochemistry 49: 4635–4643.<br />
PLOS ONE | www.plosone.org 11 August 2012 | Volume 7 | Issue 8 | e42792
49. McNeill H, Woodgett JR (2010) When pathways collide: collaboration and<br />
connivance among signall<strong>in</strong>g prote<strong>in</strong>s <strong>in</strong> development. Nature Reviews<br />
Molecular Cell Biology 11: 404–413.<br />
50. Cotter D, Honavar M, Lovestone S, Raymond L, Kerw<strong>in</strong> R, et al. (1999)<br />
Disturbance of Notch-1 and Wnt signall<strong>in</strong>g prote<strong>in</strong>s <strong>in</strong> neuroglial balloon cells<br />
and adbnormal large neurons <strong>in</strong> focal cortical dysplasia <strong>in</strong> human cortex. Acta<br />
Neuropathologica 98: 465–472.<br />
51. Kim D, Rath O, Kolch W, Cho KH (2007) A hidden oncogenic positive<br />
feedback loop caused by crosstalk between wnt and erk pathways. Oncogene 26:<br />
4571–4579.<br />
52. Schill<strong>in</strong>g M, Maiwalk T, Bohl S, Kollmann M, Kreutz C, et al. (2005)<br />
Computational process<strong>in</strong>g and error reduction strategies <strong>for</strong> standardized<br />
quantitative data <strong>in</strong> biological networks. FEBS Journal 272: 6400–6411.<br />
53. Hoops S, Sahle S, Gauges R, Lee C, Pahle J, et al. (2006) Copasi-a complex<br />
pathway simulator. Bio<strong>in</strong><strong>for</strong>matics 22(24): 3067–3074.<br />
b-Caten<strong>in</strong> Dynamics Human Neural Progenitor Cells<br />
54. Hooke R, Jeeves TA (1961) ‘‘direct search’’ solution of numerical and statistical<br />
problems. Journal of the Association <strong>for</strong> Comput<strong>in</strong>g Mach<strong>in</strong>ery 8: 212–229.<br />
55. Olivier BG, Snoep JJ (2004) Web-based k<strong>in</strong>etic modell<strong>in</strong>g us<strong>in</strong>g jws onl<strong>in</strong>e.<br />
Bio<strong>in</strong><strong>for</strong>matics 20: 2143–2144.<br />
56. Gibson MA, Bruck J (2000) Efficient exact stochastic simulation of chemical<br />
systems with many species and many channels. Journal of Physical Chemistry<br />
104: 1876–1889.<br />
57. Himmelspach J, Uhrmacher A (2007) Plug’n simulate. In: Proc. of the Annual<br />
Simulation Symposium. IEEE Computer Society, pp. 137–143. URL http://dx.<br />
doi.org/10.1109/ANSS.2007.34.<br />
58. Ciocchetta F (2009) Bio-pepa with events. Transactions on Computational<br />
Systems Biology XI: 45–68.<br />
59. Schlicht R, W<strong>in</strong>kler G (2008) A delay stochastic process with applications <strong>in</strong><br />
molecular biology. Journal of mathematical biology 57: 613–648.<br />
60. Novere NL, Hucka M, Mi H, Moodie S, Schreiber F, et al. (2009) The systems<br />
biology graphical notation. Nat Biotech 27: 735–741.<br />
PLOS ONE | www.plosone.org 12 August 2012 | Volume 7 | Issue 8 | e42792