Fabrics for the twenty-first century - The Courtauld Institute of Art
Fabrics for the twenty-first century - The Courtauld Institute of Art
Fabrics for the twenty-first century - The Courtauld Institute of Art

Create successful ePaper yourself
Turn your PDF publications into a flip-book with our unique Google optimized e-Paper software.
Young and Jardine <strong>Fabrics</strong> <strong>for</strong> <strong>the</strong> <strong>twenty</strong>-<strong>first</strong> <strong>century</strong><br />
10<br />
comparing across <strong>the</strong> uniaxial and biaxial data one<br />
can see that <strong>first</strong>ly, uniaxial data give lower stiffness<br />
and modulii. Secondly, <strong>the</strong> direction <strong>of</strong> highest stiffness<br />
(weft or warp) was in some cases reversed. Both<br />
<strong>the</strong>se features occur because under uniaxial tensile tensioning<br />
<strong>the</strong> yarns are not restrained in <strong>the</strong> non-tensioning<br />
direction. Thus, <strong>the</strong> interaction between <strong>the</strong> pulling<br />
out <strong>of</strong> <strong>the</strong> crimp (low load), <strong>the</strong>n <strong>the</strong> subsequent<br />
stretching <strong>of</strong> yarns (higher load), and <strong>the</strong> friction at<br />
<strong>the</strong> cross-over points is different than when under<br />
biaxial tensile tensioning under load control.<br />
For contemporary paintings and new artist canvas<br />
it is reasonable to suggest that, when new, goodquality<br />
artist linen and cotton-duck canvas has<br />
adequate strength. <strong>The</strong>re<strong>for</strong>e, values <strong>of</strong> UTS <strong>for</strong> new<br />
fabrics can be compared against <strong>the</strong>ir values (see<br />
Table 1). <strong>The</strong> quality available to and from <strong>the</strong><br />
supplier can vary across batches, as canvas <strong>for</strong> artists<br />
is a small market dependent on <strong>the</strong> commodities<br />
market <strong>for</strong> its source. Both <strong>the</strong> raw material and <strong>the</strong><br />
weaving will influence properties. For degraded paintings<br />
on cotton and linen, UTS values can be compared<br />
with published data, by <strong>the</strong> authors and o<strong>the</strong>r<br />
researchers, on archival and artificially aged painting<br />
reconstructions (Hackney & Hedley, 1981; Carr et al.,<br />
2003). UTS values <strong>for</strong> new Ulster linen 3151, 12 oz<br />
cotton duck, and Sailcloth 00169 are approximately<br />
550, 600, and 900 N, respectively (Young, 1996b;<br />
Carr et al., 2003). Carbotex 03_120 CF, Carbotex<br />
03_82 CF, Peektex 17-220/56, and mon<strong>of</strong>ilament<br />
55/31 have significantly smaller UTS values than sailcloth<br />
e.g. in <strong>the</strong> warp <strong>the</strong>ir values are 154, 128, 147,<br />
and 167 N, respectively. However, <strong>the</strong>se materials<br />
are much thinner, e.g. <strong>the</strong> mon<strong>of</strong>ilament 33/51 is<br />
0.05 mm thick compared to 0.23 mm <strong>for</strong> <strong>the</strong> sailcloth.<br />
Biaxial tensile data<br />
<strong>The</strong> biaxial stiffness and <strong>the</strong> biaxial modulus are summarized<br />
in Table 5. <strong>The</strong> stiffness <strong>of</strong> <strong>the</strong> fabrics in <strong>the</strong><br />
warp and weft was calculated from <strong>the</strong> tangent <strong>of</strong><br />
<strong>the</strong> load extension curves at 50 ± 10 N on <strong>the</strong> second<br />
loading cycle <strong>of</strong> tensioning; this is representative <strong>of</strong><br />
<strong>the</strong> typical load on a 300 mm 2 stretched canvas<br />
(Young & Hibberd, 1999). (For new canvas a tension<br />
<strong>of</strong> 120–200 N/m needs to be applied to become<br />
taut.) For a universal comparison <strong>of</strong> mechanical properties<br />
in <strong>the</strong> warp and weft, Young’s modulus was calculated<br />
from tangent <strong>of</strong> <strong>the</strong> stress–strain curve (<strong>for</strong> a<br />
stress 50 N m 2 ± 10 N) on <strong>the</strong> second loading cycle.<br />
(Stress is defined as <strong>the</strong> load divided by area under<br />
load.) For example, mon<strong>of</strong>ilament 55/31 has a lower<br />
weft biaxial stiffness <strong>of</strong> 38 730 N/m than Sailcloth<br />
00169 which is 118 340 N/m. However, as stated<br />
earlier <strong>the</strong> mon<strong>of</strong>ilament is much thinner.<br />
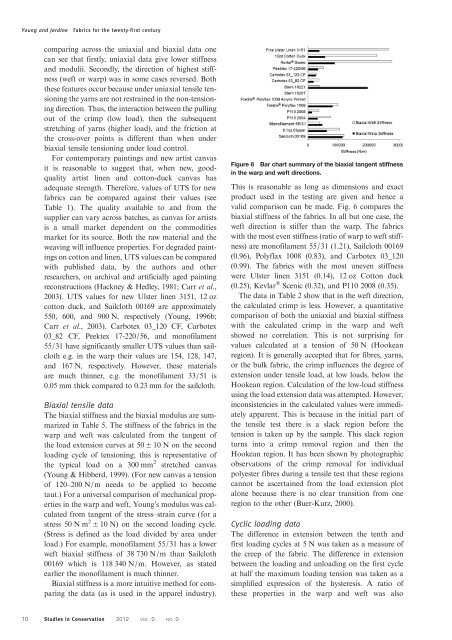
Biaxial stiffness is a more intuitive method <strong>for</strong> comparing<br />
<strong>the</strong> data (as is used in <strong>the</strong> apparel industry).<br />
Studies in Conservation 2012 VOL. 0 NO. 0<br />
Figure 6 Bar chart summary <strong>of</strong> <strong>the</strong> biaxial tangent stiffness<br />
in <strong>the</strong> warp and weft directions.<br />
This is reasonable as long as dimensions and exact<br />
product used in <strong>the</strong> testing are given and hence a<br />
valid comparison can be made. Fig. 6 compares <strong>the</strong><br />
biaxial stiffness <strong>of</strong> <strong>the</strong> fabrics. In all but one case, <strong>the</strong><br />
weft direction is stiffer than <strong>the</strong> warp. <strong>The</strong> fabrics<br />
with <strong>the</strong> most even stiffness (ratio <strong>of</strong> warp to weft stiffness)<br />
are mon<strong>of</strong>ilament 55/31 (1.21), Sailcloth 00169<br />
(0.96), Polyflax 1008 (0.83), and Carbotex 03_120<br />
(0.99). <strong>The</strong> fabrics with <strong>the</strong> most uneven stiffness<br />
were Ulster linen 3151 (0.14), 12 oz Cotton duck<br />
(0.25), Kevlar ® Scenic (0.32), and P110 2008 (0.35).<br />
<strong>The</strong> data in Table 2 show that in <strong>the</strong> weft direction,<br />
<strong>the</strong> calculated crimp is less. However, a quantitative<br />
comparison <strong>of</strong> both <strong>the</strong> uniaxial and biaxial stiffness<br />
with <strong>the</strong> calculated crimp in <strong>the</strong> warp and weft<br />
showed no correlation. This is not surprising <strong>for</strong><br />
values calculated at a tension <strong>of</strong> 50 N (Hookean<br />
region). It is generally accepted that <strong>for</strong> fibres, yarns,<br />
or <strong>the</strong> bulk fabric, <strong>the</strong> crimp influences <strong>the</strong> degree <strong>of</strong><br />
extension under tensile load, at low loads, below <strong>the</strong><br />
Hookean region. Calculation <strong>of</strong> <strong>the</strong> low-load stiffness<br />
using <strong>the</strong> load extension data was attempted. However,<br />
inconsistencies in <strong>the</strong> calculated values were immediately<br />
apparent. This is because in <strong>the</strong> initial part <strong>of</strong><br />
<strong>the</strong> tensile test <strong>the</strong>re is a slack region be<strong>for</strong>e <strong>the</strong><br />
tension is taken up by <strong>the</strong> sample. This slack region<br />
turns into a crimp removal region and <strong>the</strong>n <strong>the</strong><br />
Hookean region. It has been shown by photographic<br />
observations <strong>of</strong> <strong>the</strong> crimp removal <strong>for</strong> individual<br />
polyester fibres during a tensile test that <strong>the</strong>se regions<br />
cannot be ascertained from <strong>the</strong> load extension plot<br />
alone because <strong>the</strong>re is no clear transition from one<br />
region to <strong>the</strong> o<strong>the</strong>r (Buer-Kurz, 2000).<br />
Cyclic loading data<br />
<strong>The</strong> difference in extension between <strong>the</strong> tenth and<br />
<strong>first</strong> loading cycles at 5 N was taken as a measure <strong>of</strong><br />
<strong>the</strong> creep <strong>of</strong> <strong>the</strong> fabric. <strong>The</strong> difference in extension<br />
between <strong>the</strong> loading and unloading on <strong>the</strong> <strong>first</strong> cycle<br />
at half <strong>the</strong> maximum loading tension was taken as a<br />
simplified expression <strong>of</strong> <strong>the</strong> hysteresis. A ratio <strong>of</strong><br />
<strong>the</strong>se properties in <strong>the</strong> warp and weft was also